Comprehensive Business Valuation & Analysis of Blackmores Ltd
VerifiedAdded on 2023/06/04
|23
|4420
|279
Report
AI Summary
This report provides a comprehensive business valuation and financial analysis of Blackmores Limited, an Australian company specializing in natural health products. The analysis employs various tools, including ratio analysis (ROE, RNOA, Profit Margin, Asset Turnover, Financial Leverage, and Net Borrowing Cost) and cash flow analysis, to assess the company's financial health and performance. The report identifies key expenses impacting profit margins, such as raw materials, employee benefits, and selling & marketing costs. Liquidity and solvency positions are evaluated, along with cash flow management and financial risks. The findings suggest that Blackmores Limited has made strategic adjustments to improve its financial performance, but continuous monitoring and refinement of strategies are necessary to maintain competitiveness and stability in the market. This document is available on Desklib, a platform offering a wide range of study resources for students.
Running Head: Business Valuation and analysis
1
Project Report: Business Valuation and analysis
1
Project Report: Business Valuation and analysis
Paraphrase This Document
Need a fresh take? Get an instant paraphrase of this document with our AI Paraphraser
Business Valuation and analysis 2
Contents
Introduction.......................................................................................................................3
Company analysis.............................................................................................................3
Financial analysis..............................................................................................................3
Ratio analysis................................................................................................................3
Major expenses which impact the profit margin..........................................................8
Ratio trend..................................................................................................................10
Cash flow analysis..........................................................................................................10
Liquidity analysis........................................................................................................10
Cash flow analysis......................................................................................................11
Solvency analysis........................................................................................................12
Cash flow management and financial risk..................................................................12
Conclusion......................................................................................................................13
References.......................................................................................................................14
Appendix.........................................................................................................................16
Reformatted income statement...................................................................................16
Reformatted Balance sheet.........................................................................................17
Ratios..........................................................................................................................20
Business Valuation and analysis 3
Introduction:
Business valuation is a set of processed and methods which is used by the financial managers,
financial analyst, investors and other stakeholders of the business to identify the economic value and
actual worth of the equity in the business (Vogel, 2014). Business valuation and analysis could be
done through various tools such as economic value added, cash flow analysis, ratio analysis, trend in
the financial performance etc. This report has been prepared to identify the business value of
Blackmores limited. To identify the performance of the business, the ratio analysis study has been
done and the various expenses which affect the performance of the business has been studied along
with the performance of the cash flow analysis of the business to identify the overall position of the
business in the industry.
Company analysis:
Balckmores limited is an Australian company which develop markets and sells the natural
products related to the health of human and animals. The main market are of the company is Asia,
Australia and New Zealand. Mainly, the company offers the herbal, mineral and vitamin nutrition
product and supplements to its customers. Company also offers various other products for the cold,
flu, joint pains, bones, muscles, brain health etc. the company also offers the product for the
betterment of its customers (Bloomberg, 2018).
Financial analysis:
Financial analysis is a process which collects the financial statement of a business and
conducts various valuation models on the company to identify the financial status and performance of
the business (Moyer, McGuigan, Rao and Kretlow, 2011). In the report, the financial ratio analysis
method has been applied on Blackmores financial statement to identify the changes and the
performance of the company.
Ratio analysis:
Ratio analysis method is one of the most used and easier method of financial analysis
technique. This method collects and records the main data of the company in order to reach over the
conclusion about the financial status of the business. The ratio analysis study of the company is as
follows:
Return on equity (ROE):
Return on equity is major ratio analysis method which is used to identify the profit generation
capabilities of the business against the total owner’s equity of the business which is maintained by the
business to run the operations (Brigham and Daves, 2012). The return on equity position of the
⊘ This is a preview!⊘
Do you want full access?
Subscribe today to unlock all pages.
Trusted by 1+ million students worldwide
Business Valuation and analysis 4
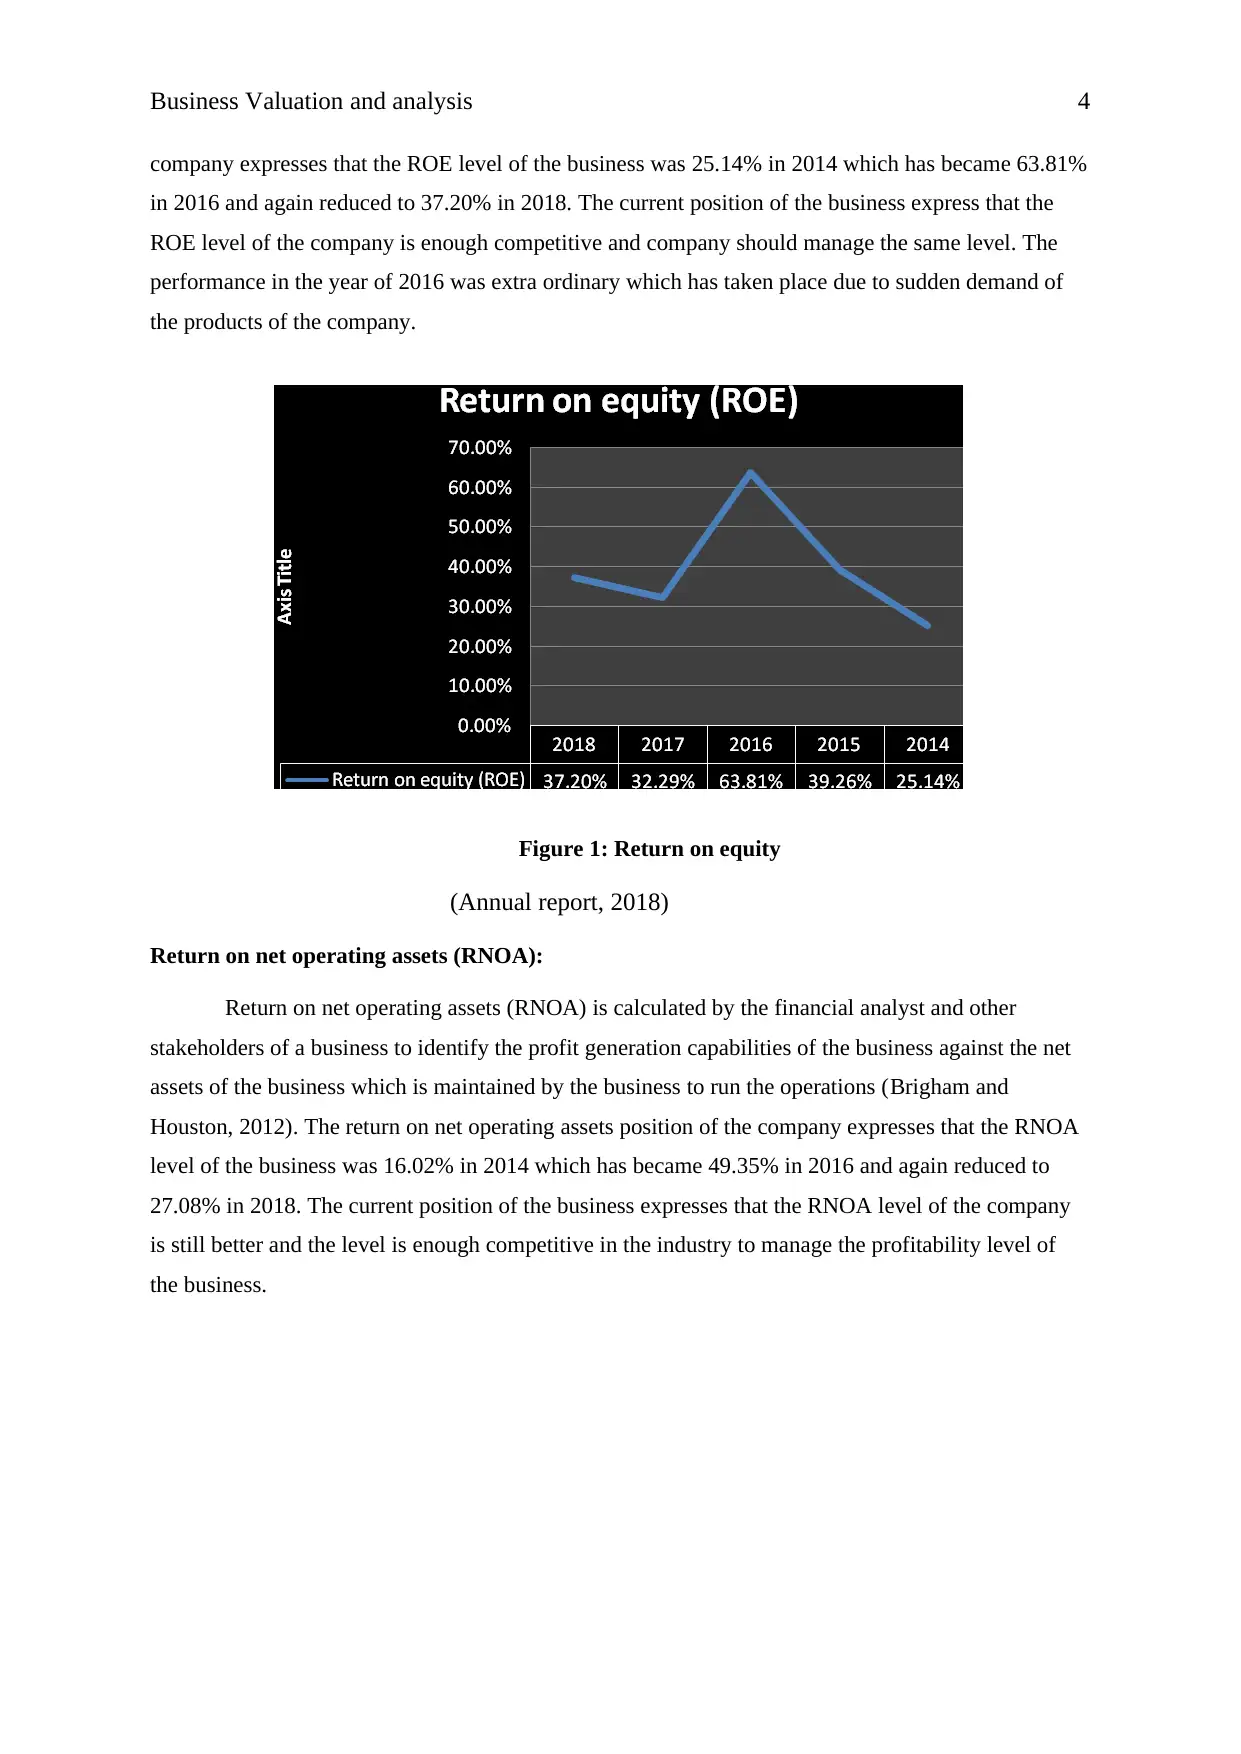
company expresses that the ROE level of the business was 25.14% in 2014 which has became 63.81%
in 2016 and again reduced to 37.20% in 2018. The current position of the business express that the
ROE level of the company is enough competitive and company should manage the same level. The
performance in the year of 2016 was extra ordinary which has taken place due to sudden demand of
the products of the company.
Figure 1: Return on equity
(Annual report, 2018)
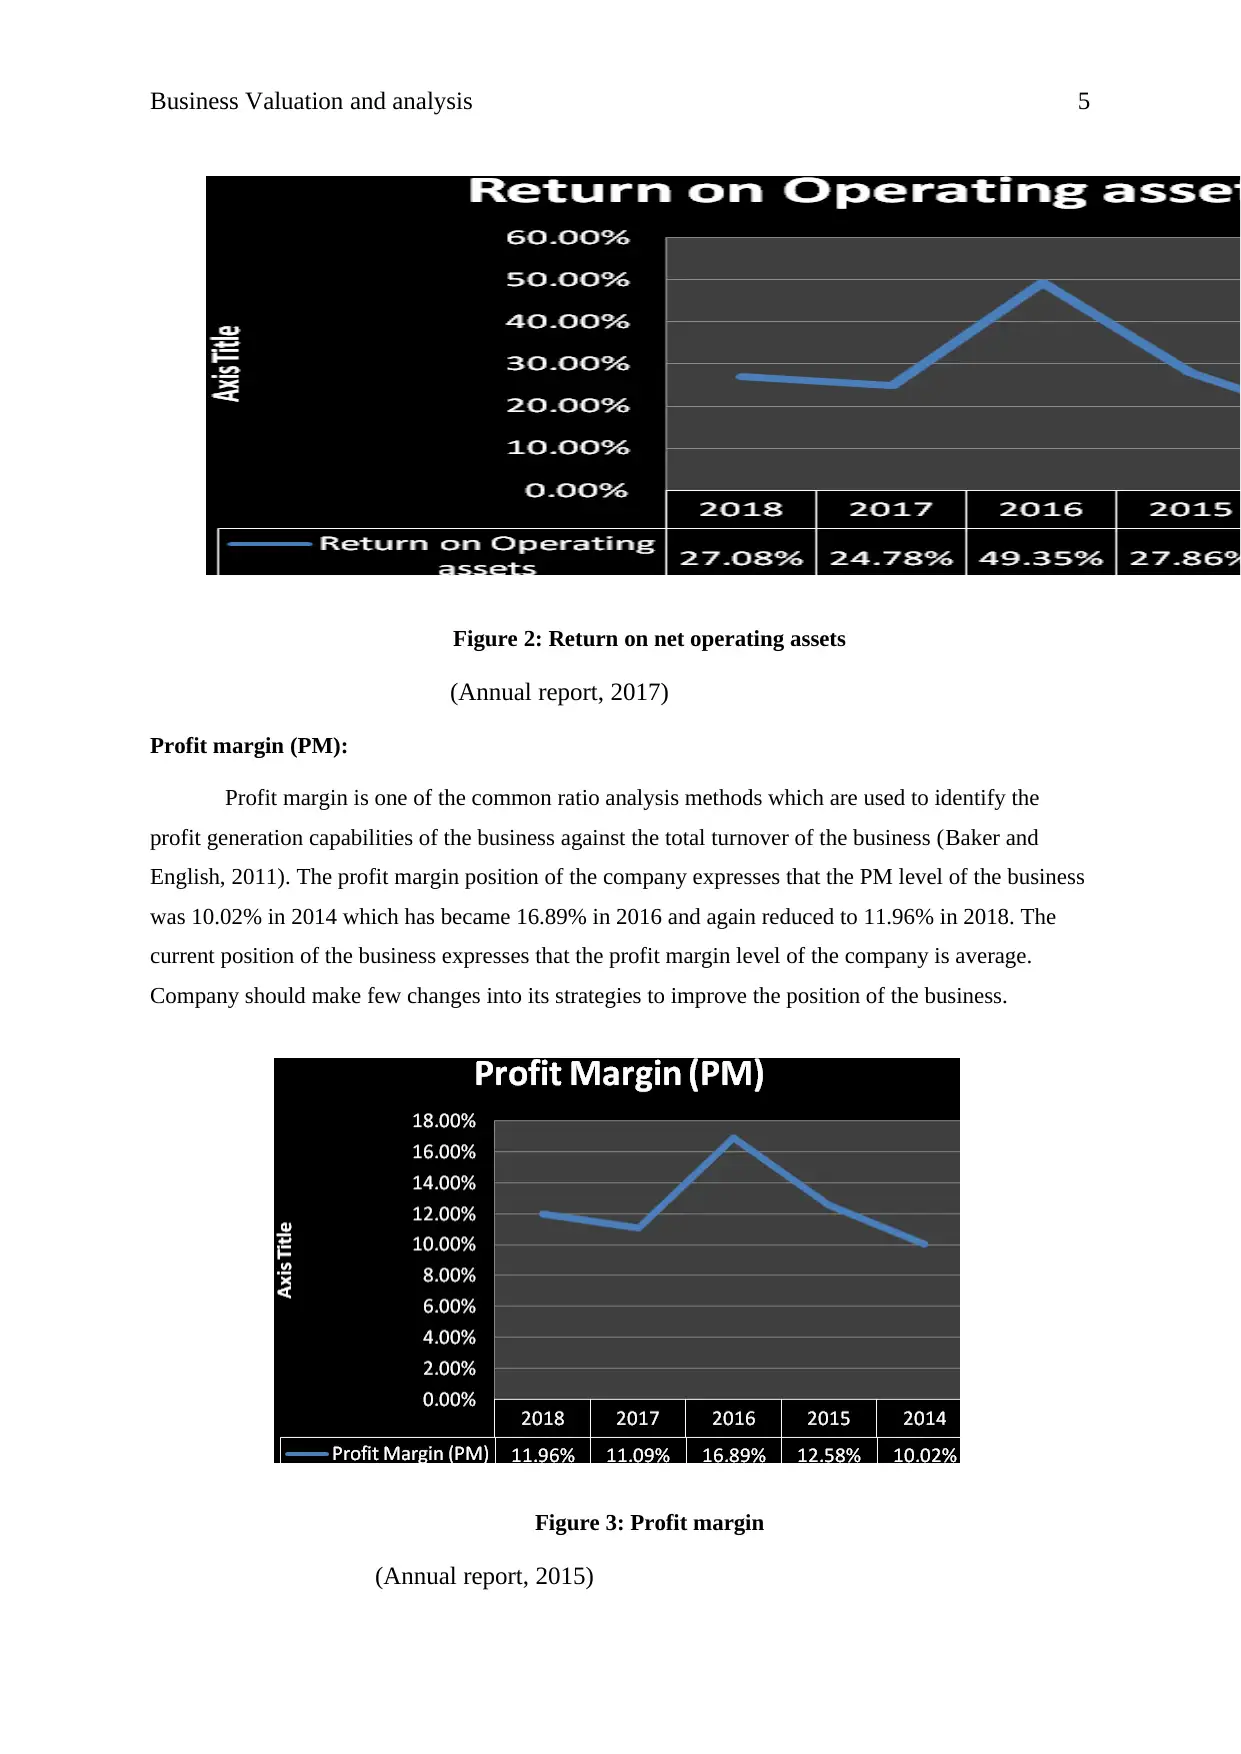
Return on net operating assets (RNOA):
Return on net operating assets (RNOA) is calculated by the financial analyst and other
stakeholders of a business to identify the profit generation capabilities of the business against the net
assets of the business which is maintained by the business to run the operations (Brigham and
Houston, 2012). The return on net operating assets position of the company expresses that the RNOA
level of the business was 16.02% in 2014 which has became 49.35% in 2016 and again reduced to
27.08% in 2018. The current position of the business expresses that the RNOA level of the company
is still better and the level is enough competitive in the industry to manage the profitability level of
the business.
company expresses that the ROE level of the business was 25.14% in 2014 which has became 63.81%
in 2016 and again reduced to 37.20% in 2018. The current position of the business express that the
ROE level of the company is enough competitive and company should manage the same level. The
performance in the year of 2016 was extra ordinary which has taken place due to sudden demand of
the products of the company.
Figure 1: Return on equity
(Annual report, 2018)
Return on net operating assets (RNOA):
Return on net operating assets (RNOA) is calculated by the financial analyst and other
stakeholders of a business to identify the profit generation capabilities of the business against the net
assets of the business which is maintained by the business to run the operations (Brigham and
Houston, 2012). The return on net operating assets position of the company expresses that the RNOA
level of the business was 16.02% in 2014 which has became 49.35% in 2016 and again reduced to
27.08% in 2018. The current position of the business expresses that the RNOA level of the company
is still better and the level is enough competitive in the industry to manage the profitability level of
the business.
Paraphrase This Document
Need a fresh take? Get an instant paraphrase of this document with our AI Paraphraser
Business Valuation and analysis 5
Figure 2: Return on net operating assets
(Annual report, 2017)
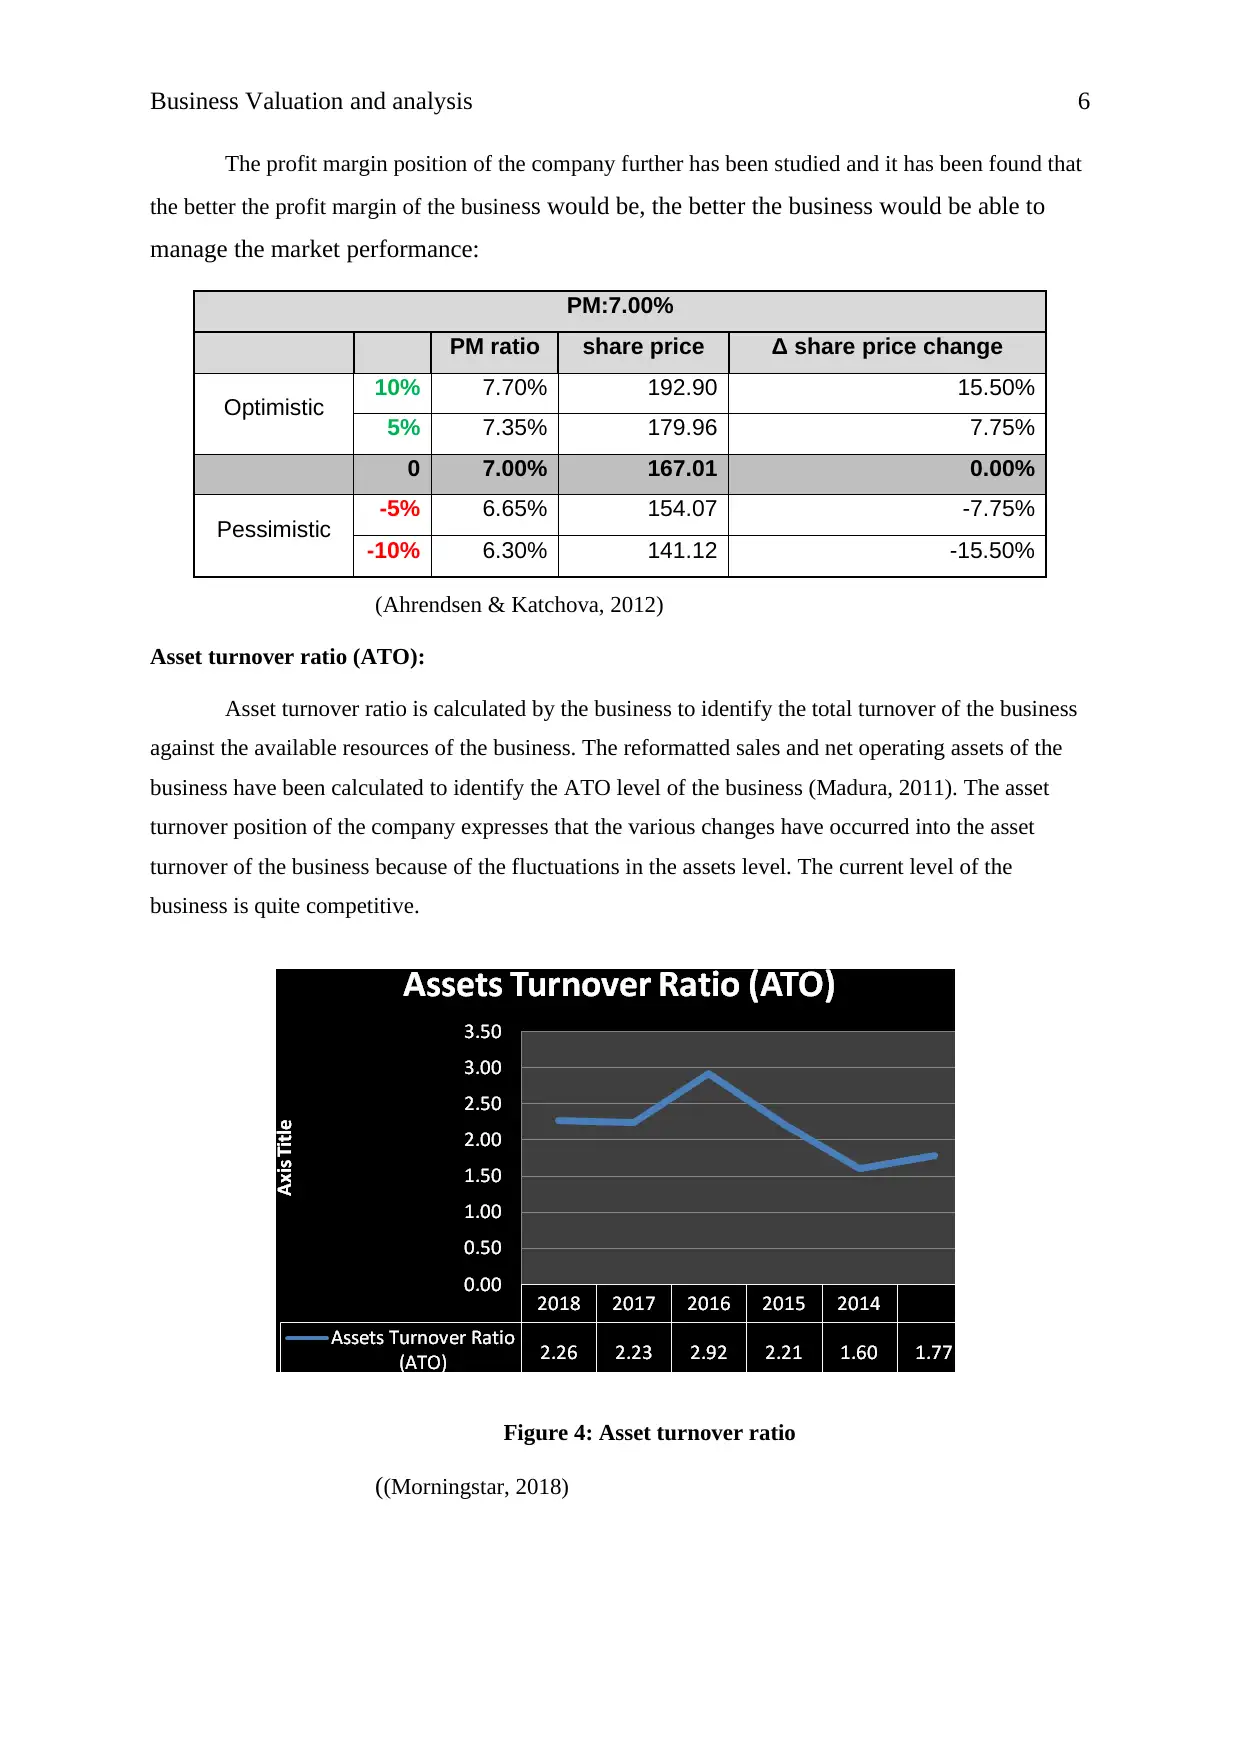
Profit margin (PM):
Profit margin is one of the common ratio analysis methods which are used to identify the
profit generation capabilities of the business against the total turnover of the business (Baker and
English, 2011). The profit margin position of the company expresses that the PM level of the business
was 10.02% in 2014 which has became 16.89% in 2016 and again reduced to 11.96% in 2018. The
current position of the business expresses that the profit margin level of the company is average.
Company should make few changes into its strategies to improve the position of the business.
Figure 3: Profit margin
(Annual report, 2015)
Figure 2: Return on net operating assets
(Annual report, 2017)
Profit margin (PM):
Profit margin is one of the common ratio analysis methods which are used to identify the
profit generation capabilities of the business against the total turnover of the business (Baker and
English, 2011). The profit margin position of the company expresses that the PM level of the business
was 10.02% in 2014 which has became 16.89% in 2016 and again reduced to 11.96% in 2018. The
current position of the business expresses that the profit margin level of the company is average.
Company should make few changes into its strategies to improve the position of the business.
Figure 3: Profit margin
(Annual report, 2015)
Business Valuation and analysis 6
The profit margin position of the company further has been studied and it has been found that
the better the profit margin of the business would be, the better the business would be able to
manage the market performance:
PM:7.00%
PM ratio share price Δ share price change
Optimistic 10% 7.70% 192.90 15.50%
5% 7.35% 179.96 7.75%
0 7.00% 167.01 0.00%
Pessimistic -5% 6.65% 154.07 -7.75%
-10% 6.30% 141.12 -15.50%
(Ahrendsen & Katchova, 2012)
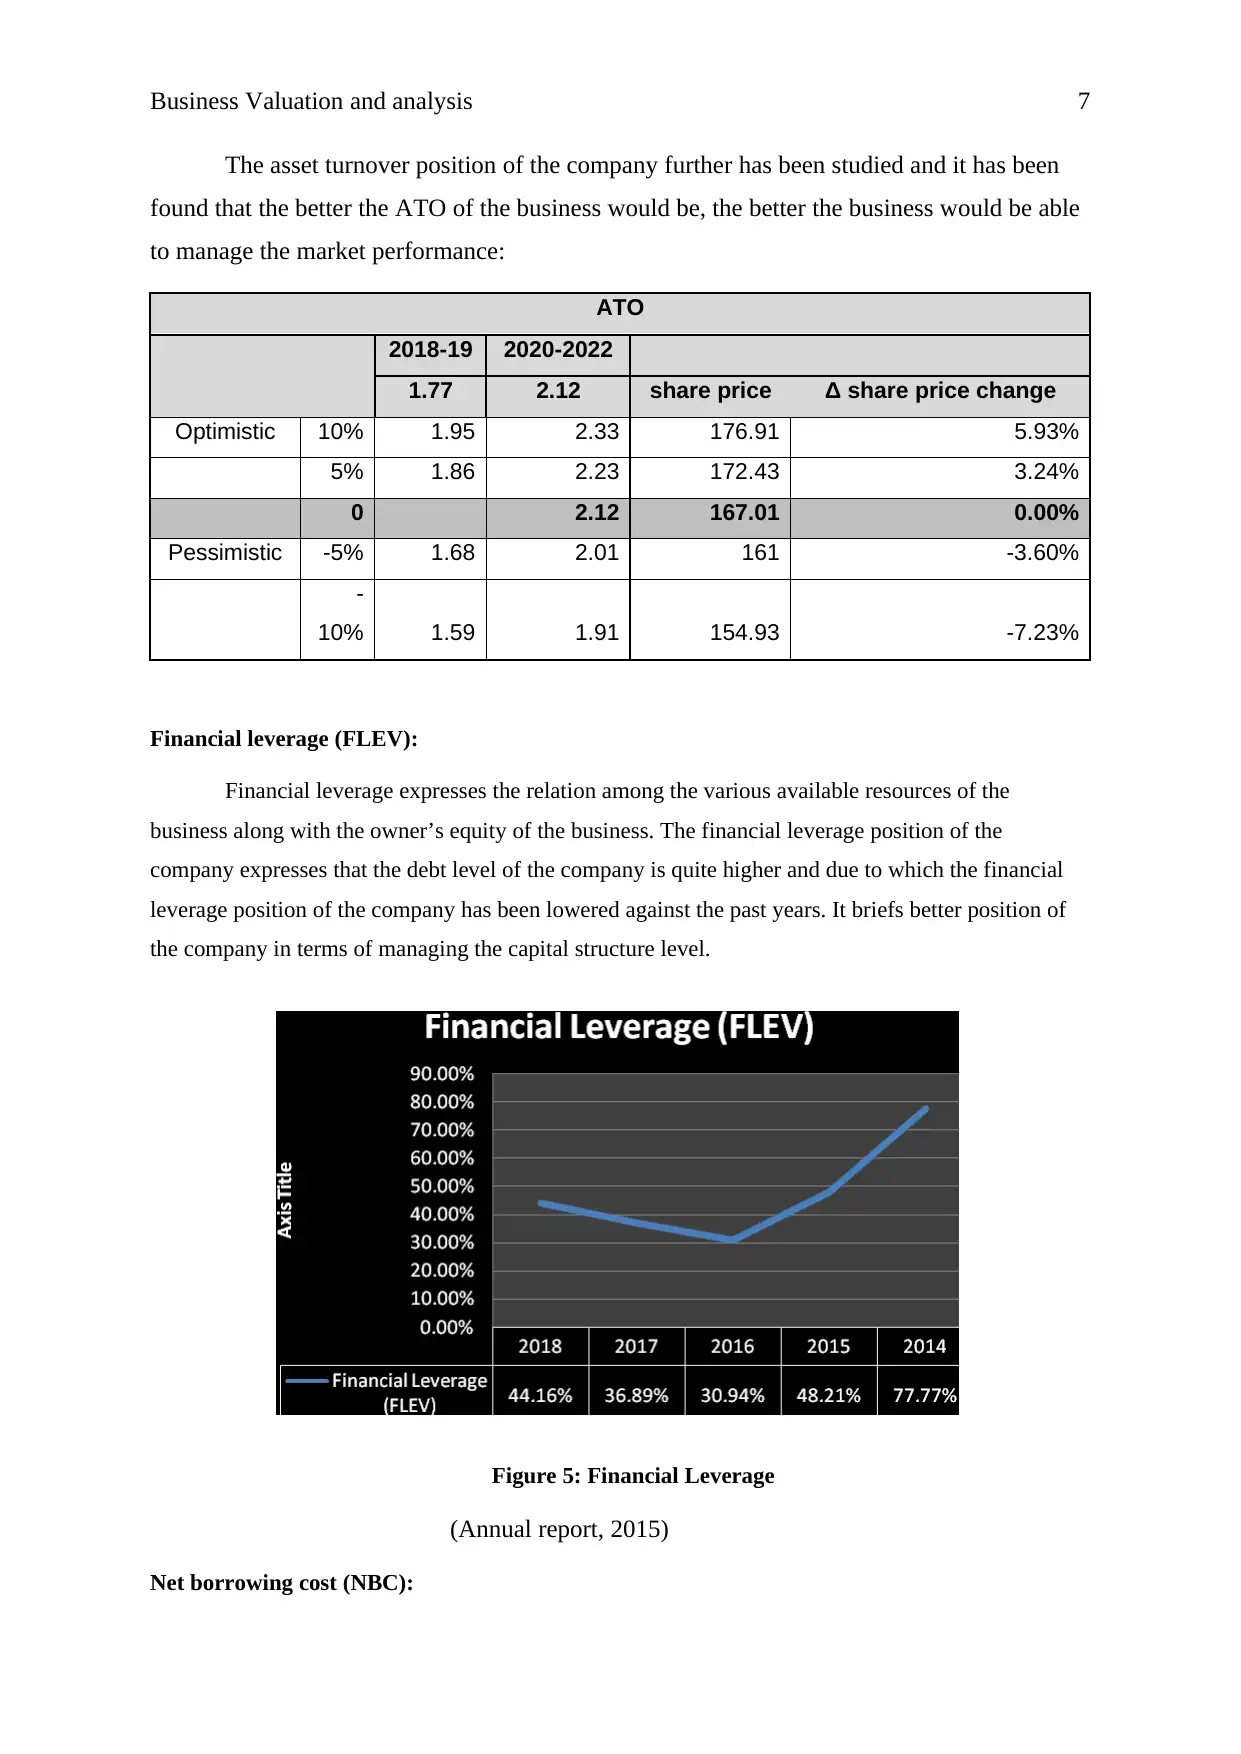
Asset turnover ratio (ATO):
Asset turnover ratio is calculated by the business to identify the total turnover of the business
against the available resources of the business. The reformatted sales and net operating assets of the
business have been calculated to identify the ATO level of the business (Madura, 2011). The asset
turnover position of the company expresses that the various changes have occurred into the asset
turnover of the business because of the fluctuations in the assets level. The current level of the
business is quite competitive.
Figure 4: Asset turnover ratio
((Morningstar, 2018)
The profit margin position of the company further has been studied and it has been found that
the better the profit margin of the business would be, the better the business would be able to
manage the market performance:
PM:7.00%
PM ratio share price Δ share price change
Optimistic 10% 7.70% 192.90 15.50%
5% 7.35% 179.96 7.75%
0 7.00% 167.01 0.00%
Pessimistic -5% 6.65% 154.07 -7.75%
-10% 6.30% 141.12 -15.50%
(Ahrendsen & Katchova, 2012)
Asset turnover ratio (ATO):
Asset turnover ratio is calculated by the business to identify the total turnover of the business
against the available resources of the business. The reformatted sales and net operating assets of the
business have been calculated to identify the ATO level of the business (Madura, 2011). The asset
turnover position of the company expresses that the various changes have occurred into the asset
turnover of the business because of the fluctuations in the assets level. The current level of the
business is quite competitive.
Figure 4: Asset turnover ratio
((Morningstar, 2018)
⊘ This is a preview!⊘
Do you want full access?
Subscribe today to unlock all pages.
Trusted by 1+ million students worldwide
Business Valuation and analysis 7
The asset turnover position of the company further has been studied and it has been
found that the better the ATO of the business would be, the better the business would be able
to manage the market performance:
ATO
2018-19 2020-2022
1.77 2.12 share price Δ share price change
Optimistic 10% 1.95 2.33 176.91 5.93%
5% 1.86 2.23 172.43 3.24%
0 2.12 167.01 0.00%
Pessimistic -5% 1.68 2.01 161 -3.60%
-
10% 1.59 1.91 154.93 -7.23%
Financial leverage (FLEV):
Financial leverage expresses the relation among the various available resources of the
business along with the owner’s equity of the business. The financial leverage position of the
company expresses that the debt level of the company is quite higher and due to which the financial
leverage position of the company has been lowered against the past years. It briefs better position of
the company in terms of managing the capital structure level.
Figure 5: Financial Leverage
(Annual report, 2015)
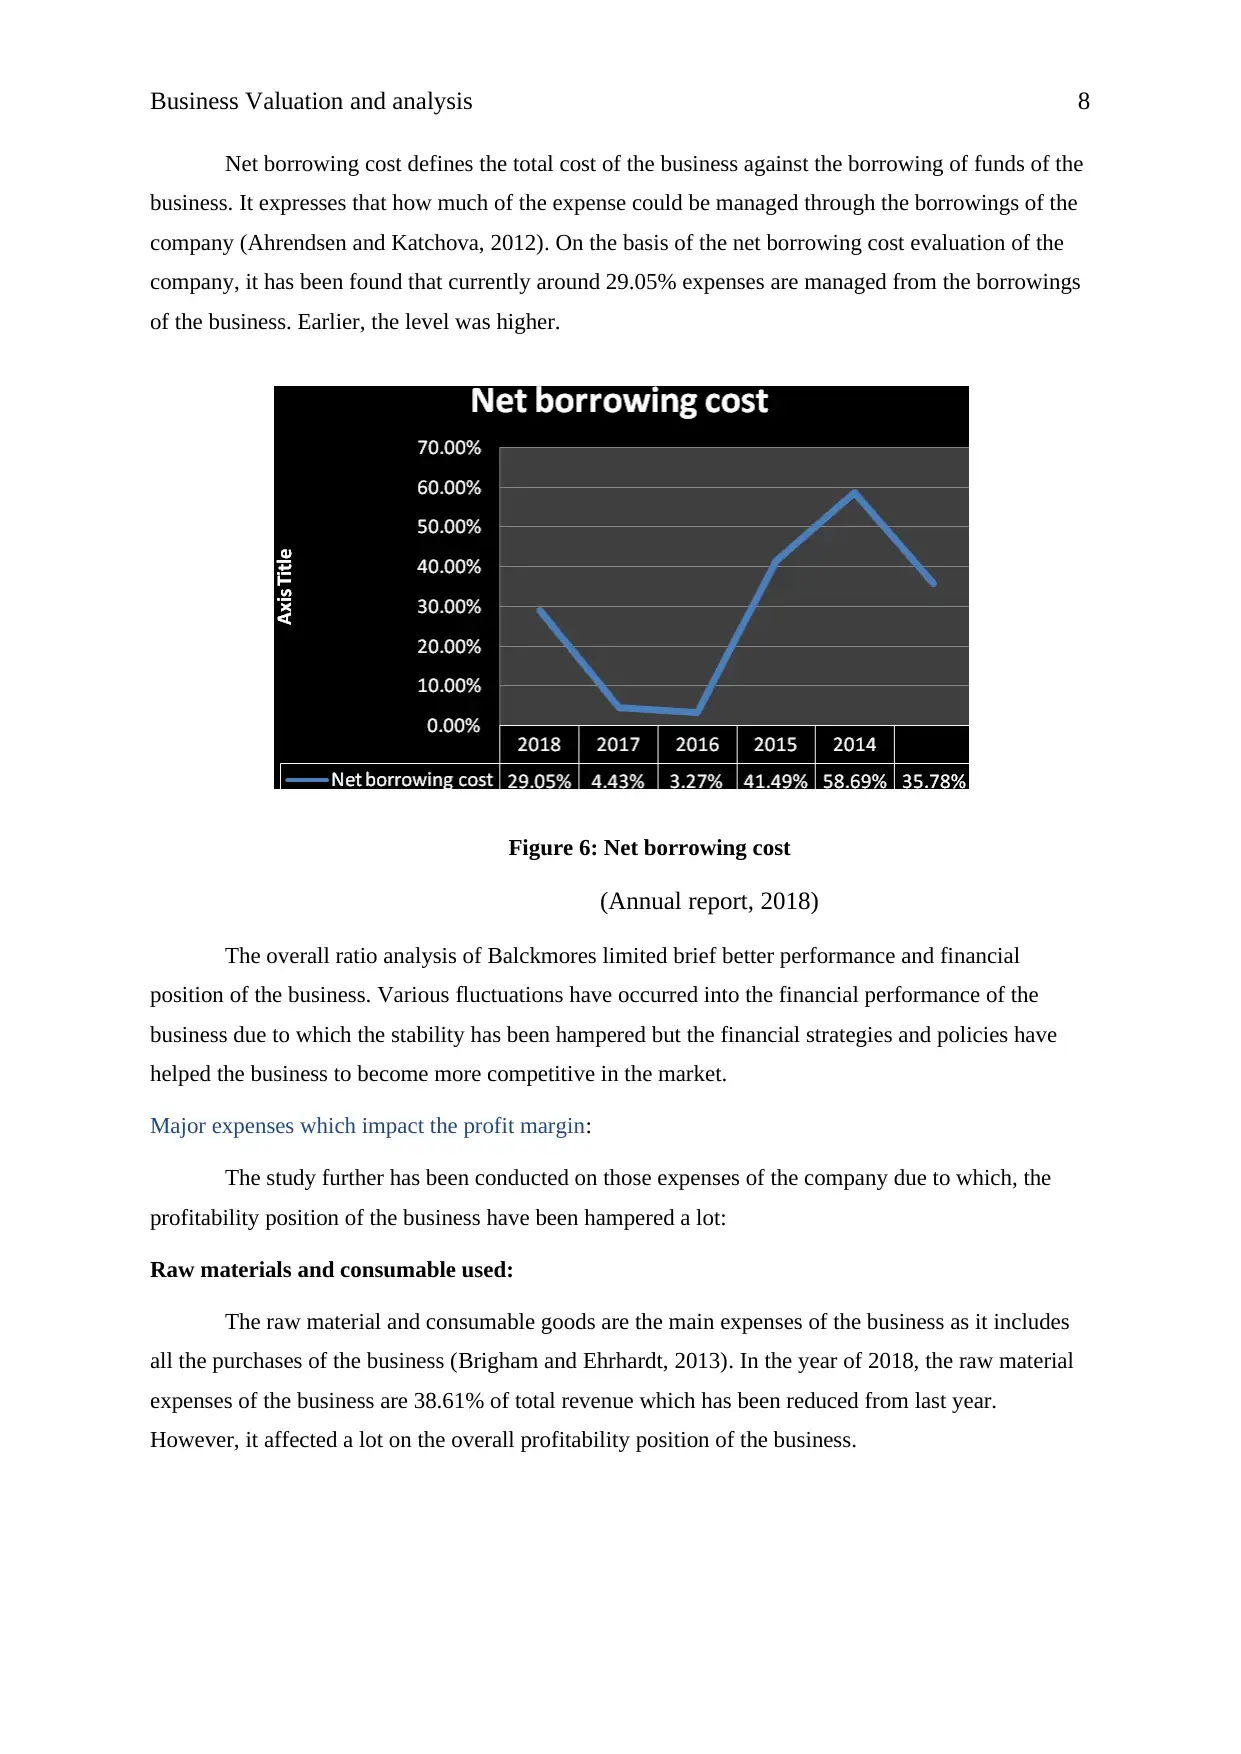
Net borrowing cost (NBC):
The asset turnover position of the company further has been studied and it has been
found that the better the ATO of the business would be, the better the business would be able
to manage the market performance:
ATO
2018-19 2020-2022
1.77 2.12 share price Δ share price change
Optimistic 10% 1.95 2.33 176.91 5.93%
5% 1.86 2.23 172.43 3.24%
0 2.12 167.01 0.00%
Pessimistic -5% 1.68 2.01 161 -3.60%
-
10% 1.59 1.91 154.93 -7.23%
Financial leverage (FLEV):
Financial leverage expresses the relation among the various available resources of the
business along with the owner’s equity of the business. The financial leverage position of the
company expresses that the debt level of the company is quite higher and due to which the financial
leverage position of the company has been lowered against the past years. It briefs better position of
the company in terms of managing the capital structure level.
Figure 5: Financial Leverage
(Annual report, 2015)
Net borrowing cost (NBC):
Paraphrase This Document
Need a fresh take? Get an instant paraphrase of this document with our AI Paraphraser
Business Valuation and analysis 8
Net borrowing cost defines the total cost of the business against the borrowing of funds of the
business. It expresses that how much of the expense could be managed through the borrowings of the
company (Ahrendsen and Katchova, 2012). On the basis of the net borrowing cost evaluation of the
company, it has been found that currently around 29.05% expenses are managed from the borrowings
of the business. Earlier, the level was higher.
Figure 6: Net borrowing cost
(Annual report, 2018)
The overall ratio analysis of Balckmores limited brief better performance and financial
position of the business. Various fluctuations have occurred into the financial performance of the
business due to which the stability has been hampered but the financial strategies and policies have
helped the business to become more competitive in the market.
Major expenses which impact the profit margin:
The study further has been conducted on those expenses of the company due to which, the
profitability position of the business have been hampered a lot:
Raw materials and consumable used:
The raw material and consumable goods are the main expenses of the business as it includes
all the purchases of the business (Brigham and Ehrhardt, 2013). In the year of 2018, the raw material
expenses of the business are 38.61% of total revenue which has been reduced from last year.
However, it affected a lot on the overall profitability position of the business.
Business Valuation and analysis 9
Figure 7: Raw materials and consumable used
(Annual report, 2017)
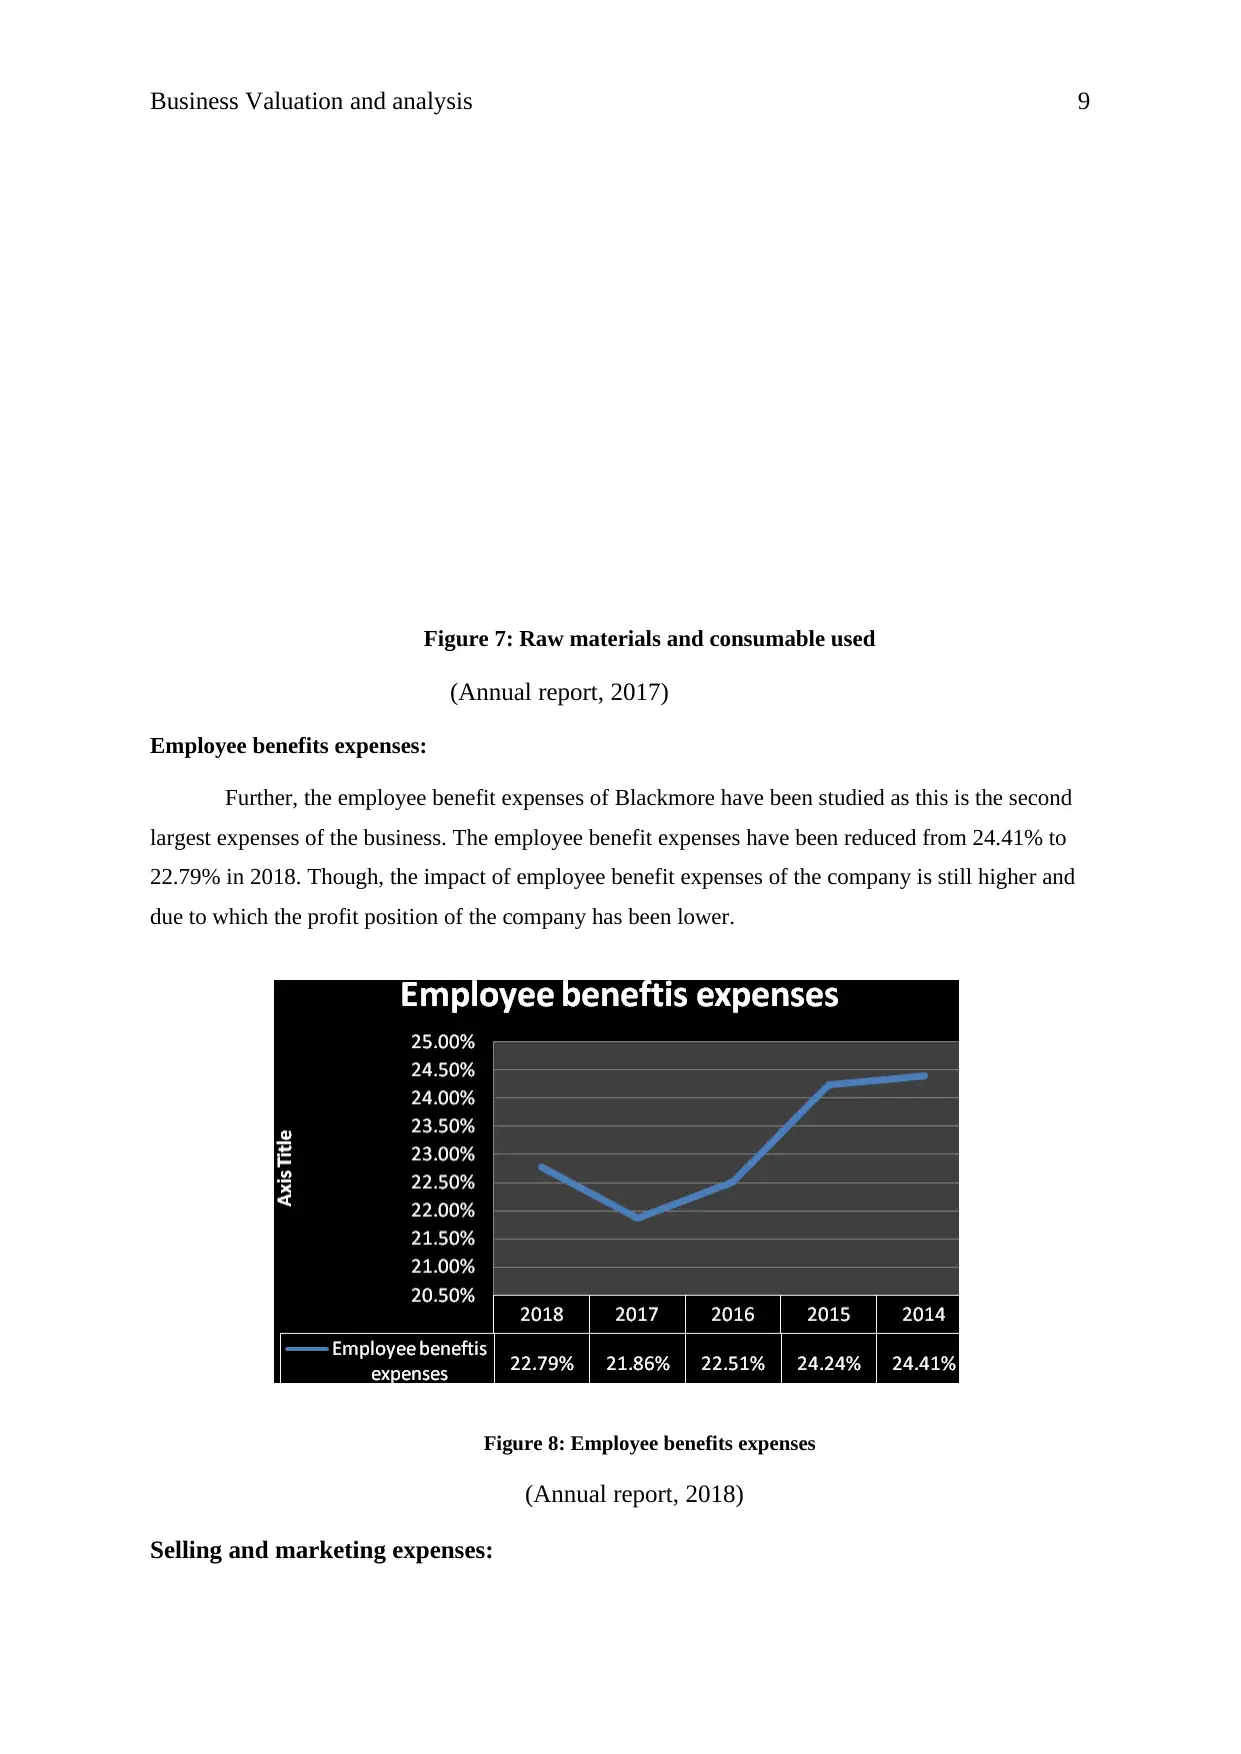
Employee benefits expenses:
Further, the employee benefit expenses of Blackmore have been studied as this is the second
largest expenses of the business. The employee benefit expenses have been reduced from 24.41% to
22.79% in 2018. Though, the impact of employee benefit expenses of the company is still higher and
due to which the profit position of the company has been lower.
Figure 8: Employee benefits expenses
(Annual report, 2018)
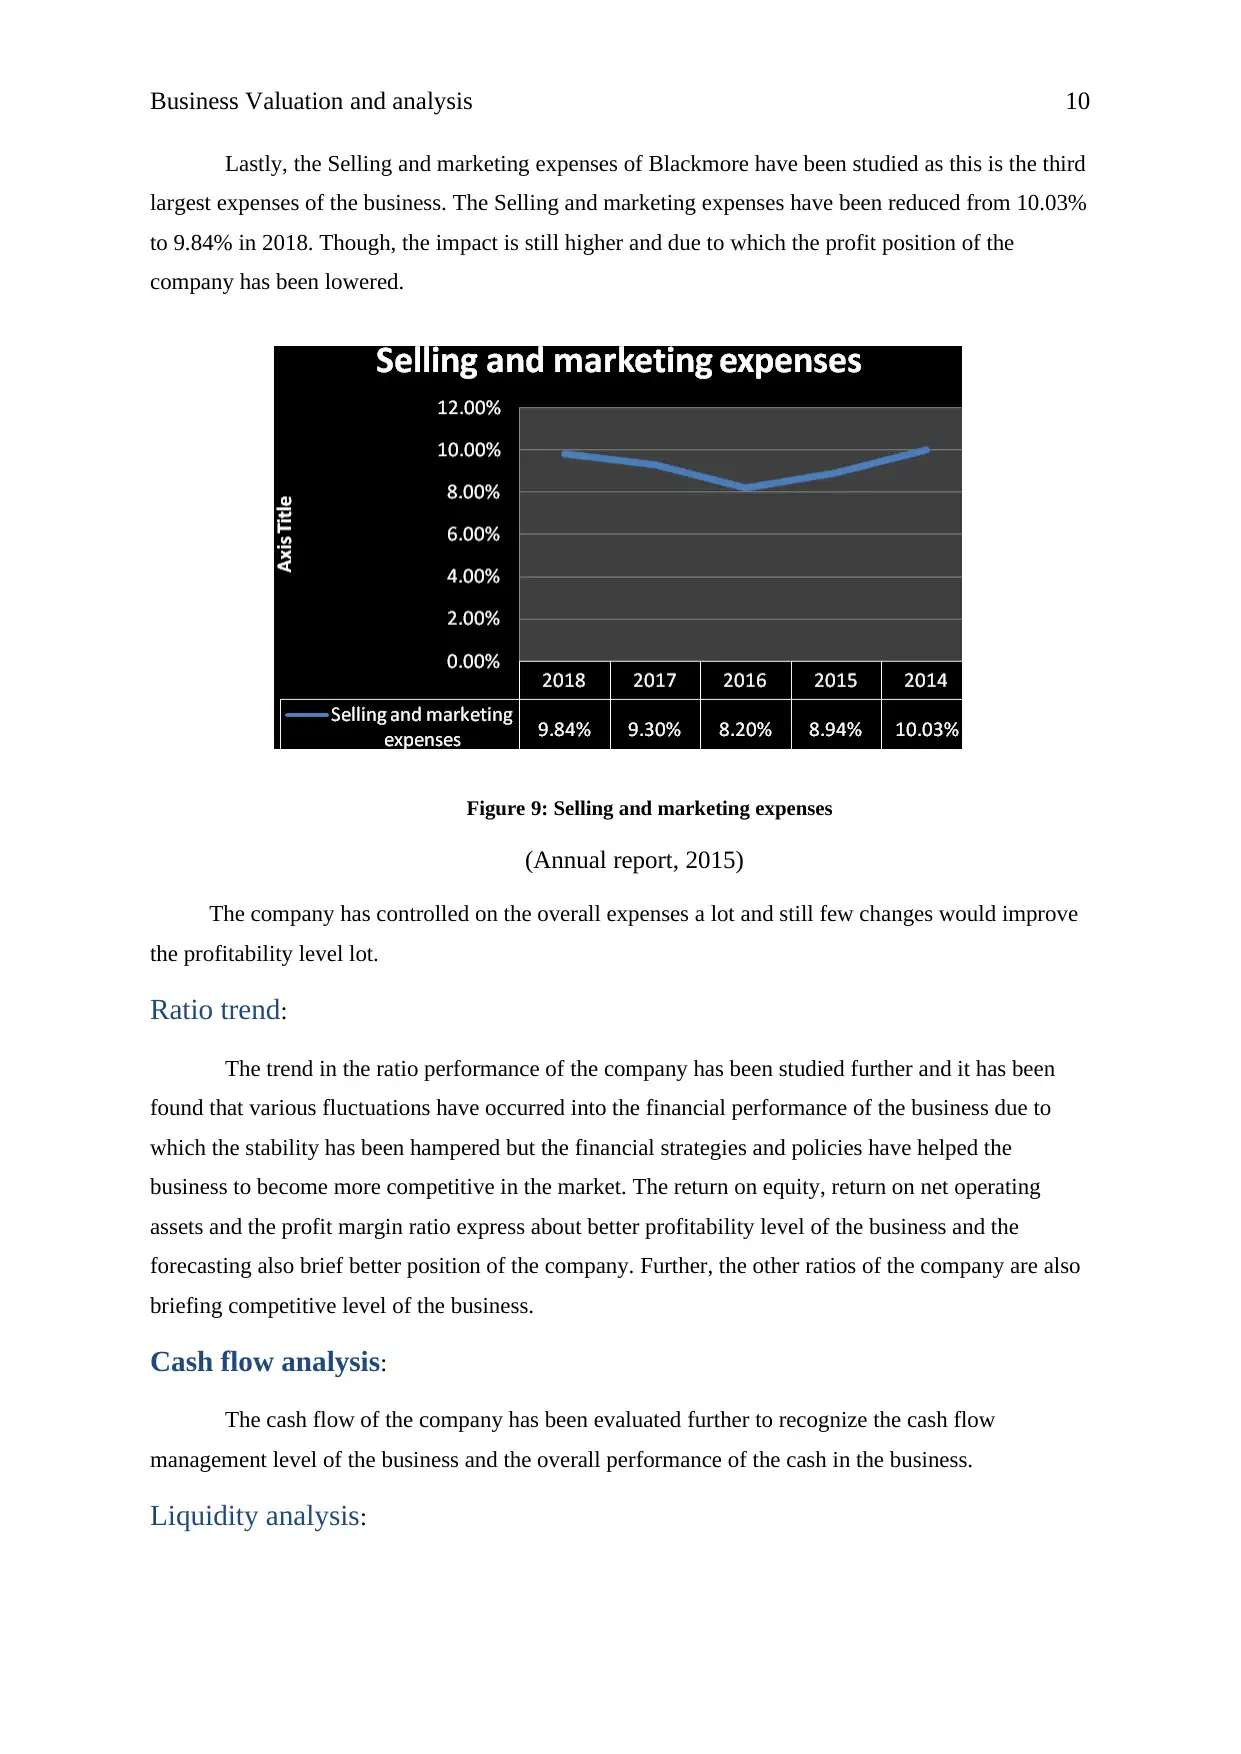
Selling and marketing expenses:
Figure 7: Raw materials and consumable used
(Annual report, 2017)
Employee benefits expenses:
Further, the employee benefit expenses of Blackmore have been studied as this is the second
largest expenses of the business. The employee benefit expenses have been reduced from 24.41% to
22.79% in 2018. Though, the impact of employee benefit expenses of the company is still higher and
due to which the profit position of the company has been lower.
Figure 8: Employee benefits expenses
(Annual report, 2018)
Selling and marketing expenses:
⊘ This is a preview!⊘
Do you want full access?
Subscribe today to unlock all pages.
Trusted by 1+ million students worldwide
Business Valuation and analysis 10
Lastly, the Selling and marketing expenses of Blackmore have been studied as this is the third
largest expenses of the business. The Selling and marketing expenses have been reduced from 10.03%
to 9.84% in 2018. Though, the impact is still higher and due to which the profit position of the
company has been lowered.
Figure 9: Selling and marketing expenses
(Annual report, 2015)
The company has controlled on the overall expenses a lot and still few changes would improve
the profitability level lot.
Ratio trend:
The trend in the ratio performance of the company has been studied further and it has been
found that various fluctuations have occurred into the financial performance of the business due to
which the stability has been hampered but the financial strategies and policies have helped the
business to become more competitive in the market. The return on equity, return on net operating
assets and the profit margin ratio express about better profitability level of the business and the
forecasting also brief better position of the company. Further, the other ratios of the company are also
briefing competitive level of the business.
Cash flow analysis:
The cash flow of the company has been evaluated further to recognize the cash flow
management level of the business and the overall performance of the cash in the business.
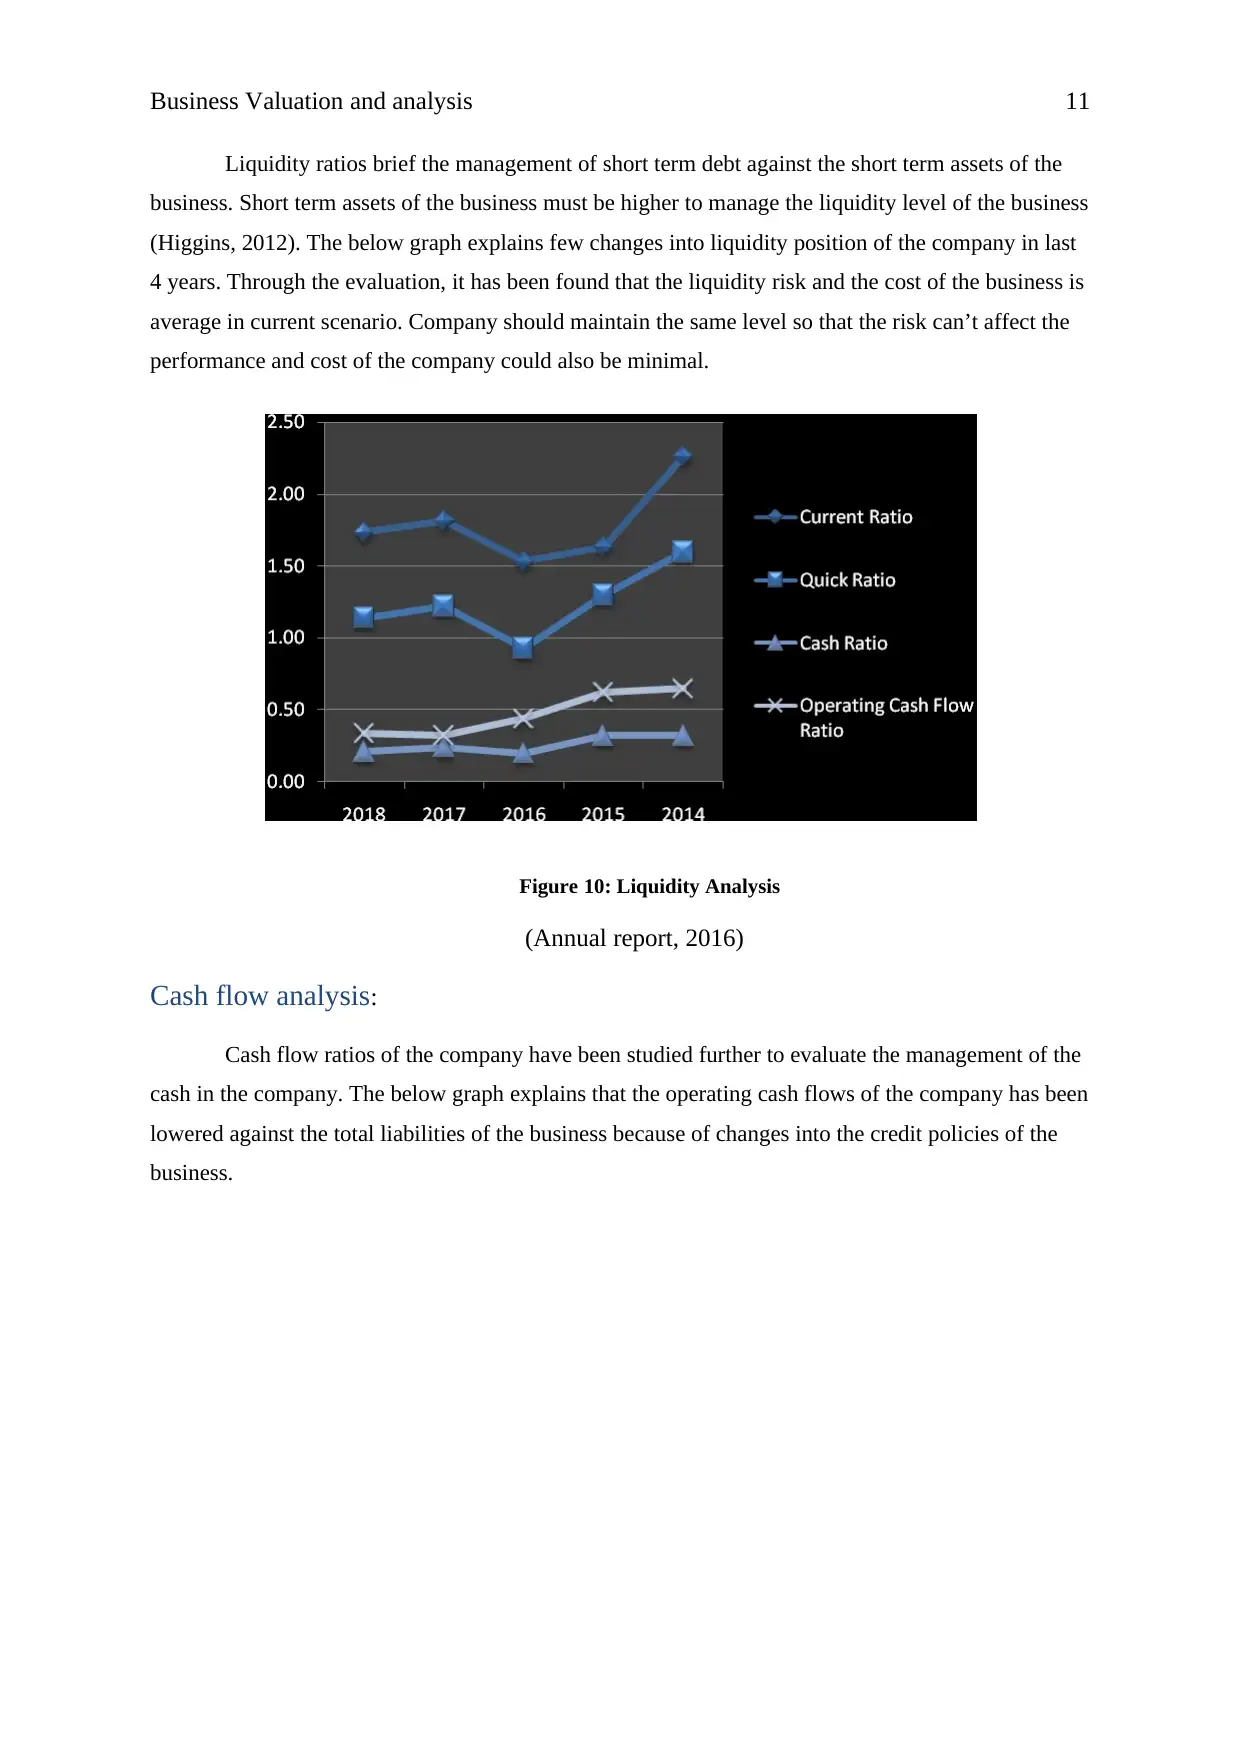
Liquidity analysis:
Lastly, the Selling and marketing expenses of Blackmore have been studied as this is the third
largest expenses of the business. The Selling and marketing expenses have been reduced from 10.03%
to 9.84% in 2018. Though, the impact is still higher and due to which the profit position of the
company has been lowered.
Figure 9: Selling and marketing expenses
(Annual report, 2015)
The company has controlled on the overall expenses a lot and still few changes would improve
the profitability level lot.
Ratio trend:
The trend in the ratio performance of the company has been studied further and it has been
found that various fluctuations have occurred into the financial performance of the business due to
which the stability has been hampered but the financial strategies and policies have helped the
business to become more competitive in the market. The return on equity, return on net operating
assets and the profit margin ratio express about better profitability level of the business and the
forecasting also brief better position of the company. Further, the other ratios of the company are also
briefing competitive level of the business.
Cash flow analysis:
The cash flow of the company has been evaluated further to recognize the cash flow
management level of the business and the overall performance of the cash in the business.
Liquidity analysis:
Paraphrase This Document
Need a fresh take? Get an instant paraphrase of this document with our AI Paraphraser
Business Valuation and analysis 11
Liquidity ratios brief the management of short term debt against the short term assets of the
business. Short term assets of the business must be higher to manage the liquidity level of the business
(Higgins, 2012). The below graph explains few changes into liquidity position of the company in last
4 years. Through the evaluation, it has been found that the liquidity risk and the cost of the business is
average in current scenario. Company should maintain the same level so that the risk can’t affect the
performance and cost of the company could also be minimal.
Figure 10: Liquidity Analysis
(Annual report, 2016)
Cash flow analysis:
Cash flow ratios of the company have been studied further to evaluate the management of the
cash in the company. The below graph explains that the operating cash flows of the company has been
lowered against the total liabilities of the business because of changes into the credit policies of the
business.
Business Valuation and analysis 12
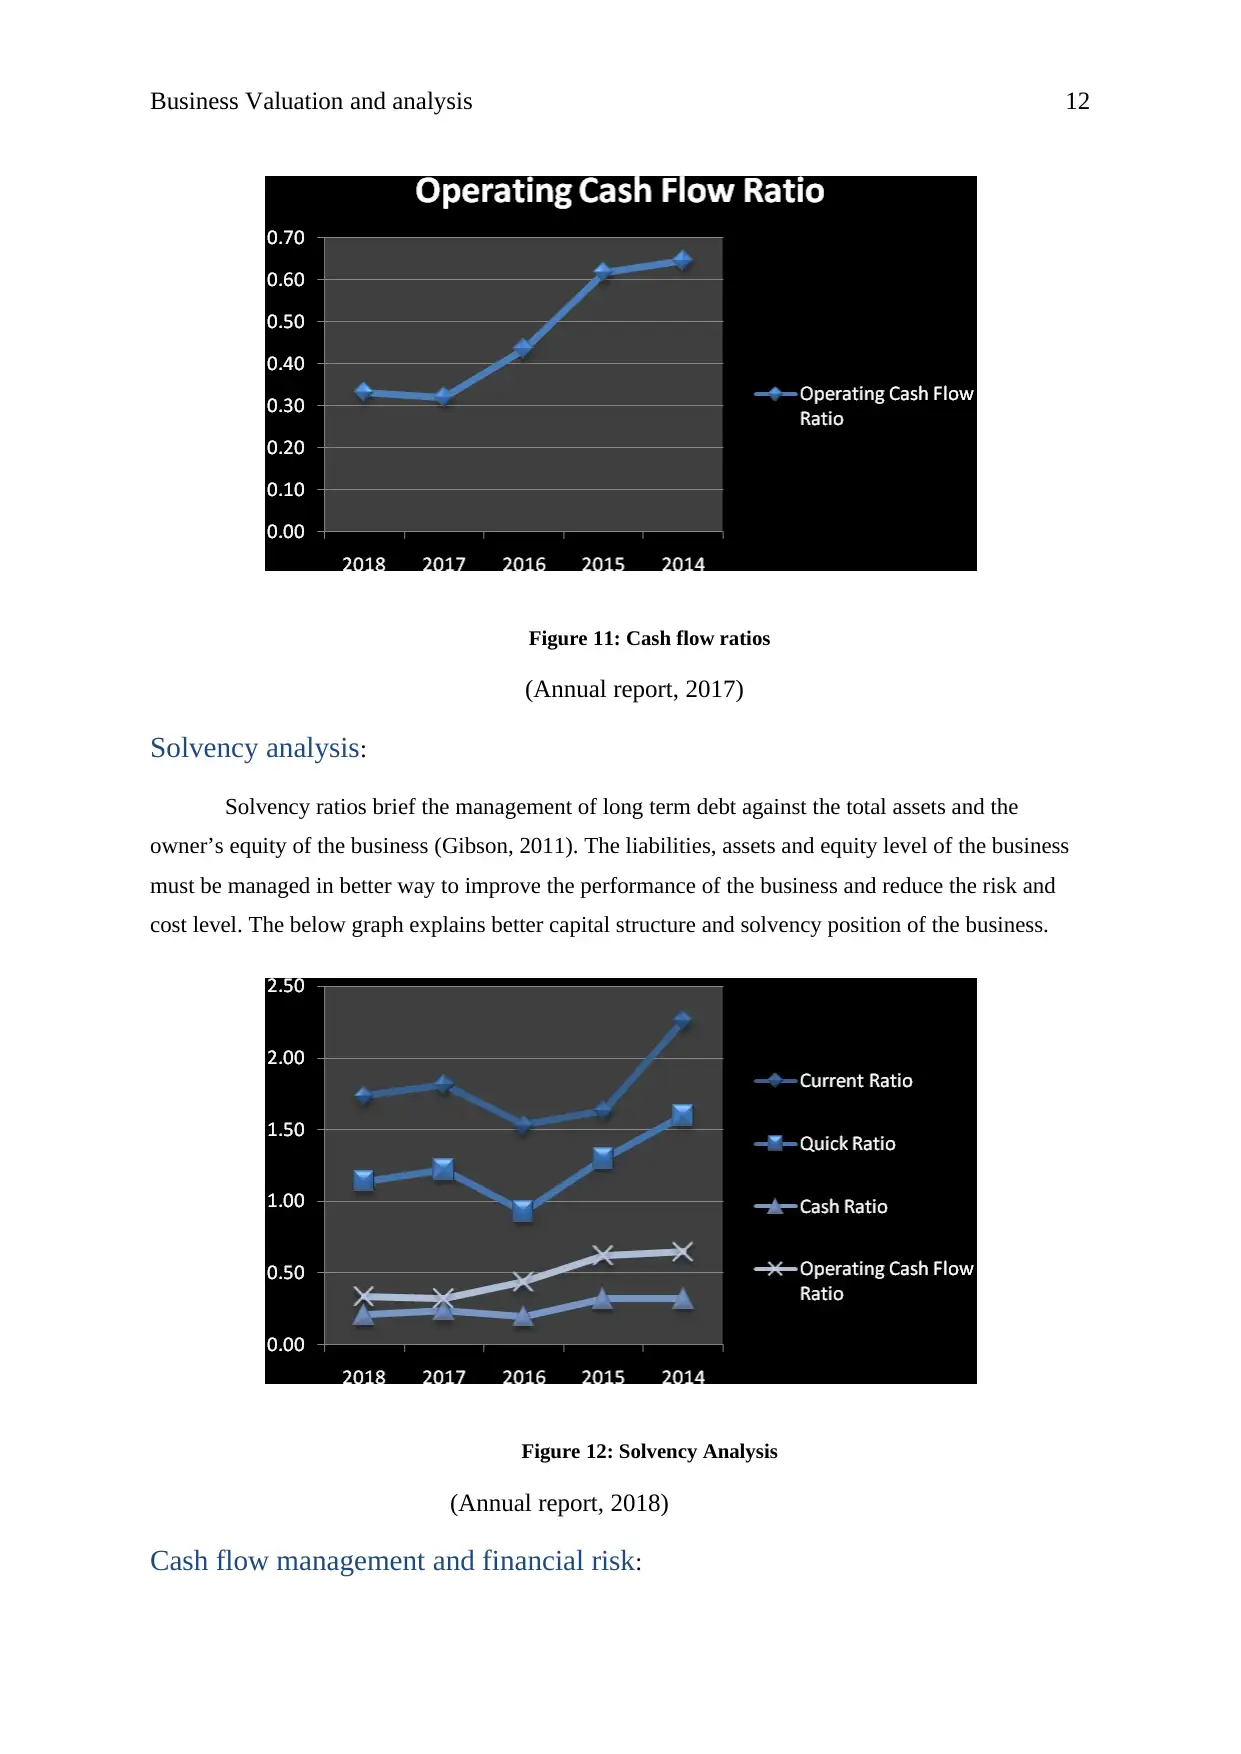
Figure 11: Cash flow ratios
(Annual report, 2017)
Solvency analysis:
Solvency ratios brief the management of long term debt against the total assets and the
owner’s equity of the business (Gibson, 2011). The liabilities, assets and equity level of the business
must be managed in better way to improve the performance of the business and reduce the risk and
cost level. The below graph explains better capital structure and solvency position of the business.
Figure 12: Solvency Analysis
(Annual report, 2018)
Cash flow management and financial risk:
⊘ This is a preview!⊘
Do you want full access?
Subscribe today to unlock all pages.
Trusted by 1+ million students worldwide
1 out of 23
Related Documents


Your All-in-One AI-Powered Toolkit for Academic Success.
+13062052269
info@desklib.com
Available 24*7 on WhatsApp / Email
![[object Object]](/_next/static/media/star-bottom.7253800d.svg)
Unlock your academic potential
Copyright © 2020–2026 A2Z Services. All Rights Reserved. Developed and managed by ZUCOL.