Project Report: Business Valuation and Analysis of JB HI FI
VerifiedAdded on 2023/01/04
|22
|5156
|57
Project
AI Summary
This project report presents a comprehensive business valuation and analysis of JB HI FI, a company operating in the Australian consumer goods market. The analysis encompasses various financial modeling techniques, including Dividend Discount Model (DDM), Residual Income Model (RIM), Residual Operating Income Model (ROIM), and Free Cash Flow Model (FCFM), to estimate the intrinsic value of JB HI FI's stock. The report incorporates forecasting methods to predict future sales growth, asset turnover, profit margins, and free cash flows, considering factors such as inflation, GDP, and industry trends. Sensitivity analysis is conducted to assess the impact of changes in key variables like sales growth and cost of capital on the valuation outcomes. The study also evaluates the cost of debt and equity, along with the Weighted Average Cost of Capital (WACC), and provides management consulting recommendations. The project concludes with an assessment of opportunities and challenges, offering insights into the company's financial performance and investment potential. The report also compares the estimated stock prices with the actual market prices to determine if the stock is undervalued or overvalued.
Running Head: Business valuation and analysis
1
Project Report: Business valuation and analysis
1
Project Report: Business valuation and analysis
Paraphrase This Document
Need a fresh take? Get an instant paraphrase of this document with our AI Paraphraser
Business valuation and analysis 2
Contents
Introduction:.....................................................................................................................3
Forecasting:.......................................................................................................................3
Sales growth:................................................................................................................4
Asset turnover ratio forecast (ATO forecast):..............................................................5
Profit Margin:...............................................................................................................6
Free cash flow and Net dividend payout ratio forecasting:..........................................7
Cost of debt:..................................................................................................................8
Cost of equity:...............................................................................................................8
Valuation:.........................................................................................................................9
Dividend discount model:...........................................................................................10
Residual income model:.............................................................................................11
Residual operating income model:.............................................................................12
Free cash flow model:.................................................................................................13
Sensitivity analysis:........................................................................................................14
Sales growth:..............................................................................................................14
ATO:...........................................................................................................................15
PM:.............................................................................................................................15
Net dividend payout ratio:..........................................................................................16
Cost of debt:................................................................................................................16
Cost of equity and WACC:.........................................................................................16
Management consulting decisions:.................................................................................17
Opportunities..............................................................................................................17

Business valuation and analysis 3
Challenges...................................................................................................................18
Conclusion:.....................................................................................................................18
References:.....................................................................................................................20
Appendix.........................................................................................................................21
⊘ This is a preview!⊘
Do you want full access?
Subscribe today to unlock all pages.
Trusted by 1+ million students worldwide
Business valuation and analysis 4
Introduction:
Evaluation over the stock and financial position of an organization is one of the
mandatory and important steps which must be taken by the investors and financial analyst to
make decision about investment into organization. The main concept of business valuation
and analysis is to gather the financial data of past few years and measure them on the basis of
various methods and ways to identify the changes faced by the company in previous few
years. This method helps the organization to evaluate the current and future performance of
the company so that the total return which could be got from the company is forecasted and a
decision could be made accordingly. Business valuation and analysis study has been
conducted over JB HI FI limited.
In order to measure and estimate the future values of stock of JB HI FI, various
financial methods have been applied over the business such as valuation model i.e. DDM
model, growth discount model etc, forecasting models such as changes in sales level,
profitability level etc, sensitivity analysis such as changes in few independent factors and
management consulting advise. All of these methods assist the shareholders and other
internal & external stakeholders of the business to measure the level of business and make a
better investment decision accordingly.
JB HI FI is running its business in Australian market. It has further expanded its
business into overseas market. Consumer goods are mainly provided by the company in its
running market. Main subsidiary company of JB HI FI is “The good guys”. Most of the
business and operations of the business are run by its subsidiary company. JB HI FI is
running its operations since 1974 in Australian market. Further, the company has diversified
its market in different industry. The changes and financial and non financial performance
study depicts that company has improved a lot in the market since last few years. The report
focuses over the overall changes and future prediction about worth of the business for the
internal and external users of the business.
Forecasting:
Forecasting is a process of identifying the future changes in an organization on the
basis of various independent and dependent factors such as changes in sales revenue, changes
in profitability level, demand fluctuations, economical changes, change in industry factors
Paraphrase This Document
Need a fresh take? Get an instant paraphrase of this document with our AI Paraphraser
Business valuation and analysis 5
etc. Forecasting process makes it easier for the management of the company to consider the
previous changes and make compatible strategy for the business accordingly (Lord, 2017).
Also, this process helps the financial analyst to evaluate about investment level in the
business. In case of JB HI FI, forecasting study has been done over the company to recognize
overall performance of the company. Below is the evaluation over JB HI FI:
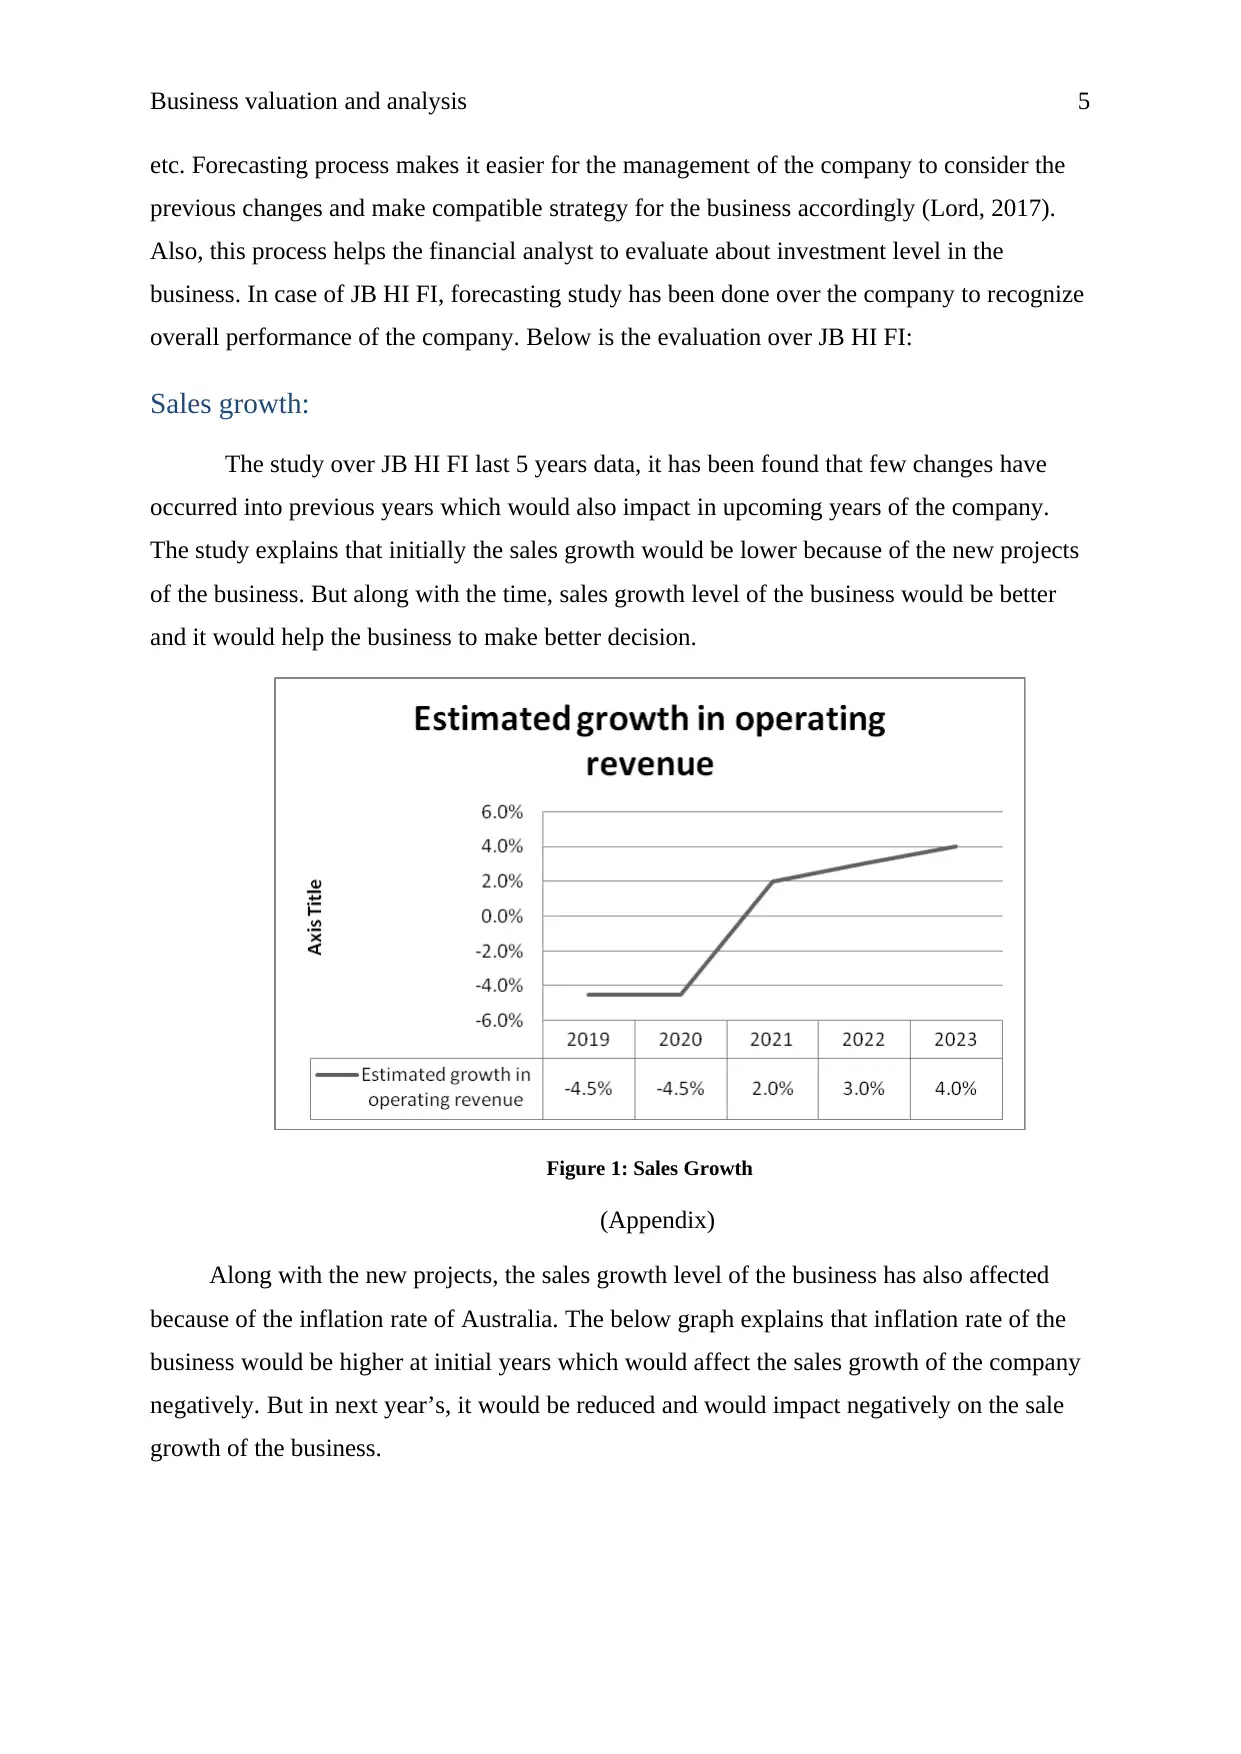
Sales growth:
The study over JB HI FI last 5 years data, it has been found that few changes have
occurred into previous years which would also impact in upcoming years of the company.
The study explains that initially the sales growth would be lower because of the new projects
of the business. But along with the time, sales growth level of the business would be better
and it would help the business to make better decision.
Figure 1: Sales Growth
(Appendix)
Along with the new projects, the sales growth level of the business has also affected
because of the inflation rate of Australia. The below graph explains that inflation rate of the
business would be higher at initial years which would affect the sales growth of the company
negatively. But in next year’s, it would be reduced and would impact negatively on the sale
growth of the business.
etc. Forecasting process makes it easier for the management of the company to consider the
previous changes and make compatible strategy for the business accordingly (Lord, 2017).
Also, this process helps the financial analyst to evaluate about investment level in the
business. In case of JB HI FI, forecasting study has been done over the company to recognize
overall performance of the company. Below is the evaluation over JB HI FI:
Sales growth:
The study over JB HI FI last 5 years data, it has been found that few changes have
occurred into previous years which would also impact in upcoming years of the company.
The study explains that initially the sales growth would be lower because of the new projects
of the business. But along with the time, sales growth level of the business would be better
and it would help the business to make better decision.
Figure 1: Sales Growth
(Appendix)
Along with the new projects, the sales growth level of the business has also affected
because of the inflation rate of Australia. The below graph explains that inflation rate of the
business would be higher at initial years which would affect the sales growth of the company
negatively. But in next year’s, it would be reduced and would impact negatively on the sale
growth of the business.
Business valuation and analysis 6
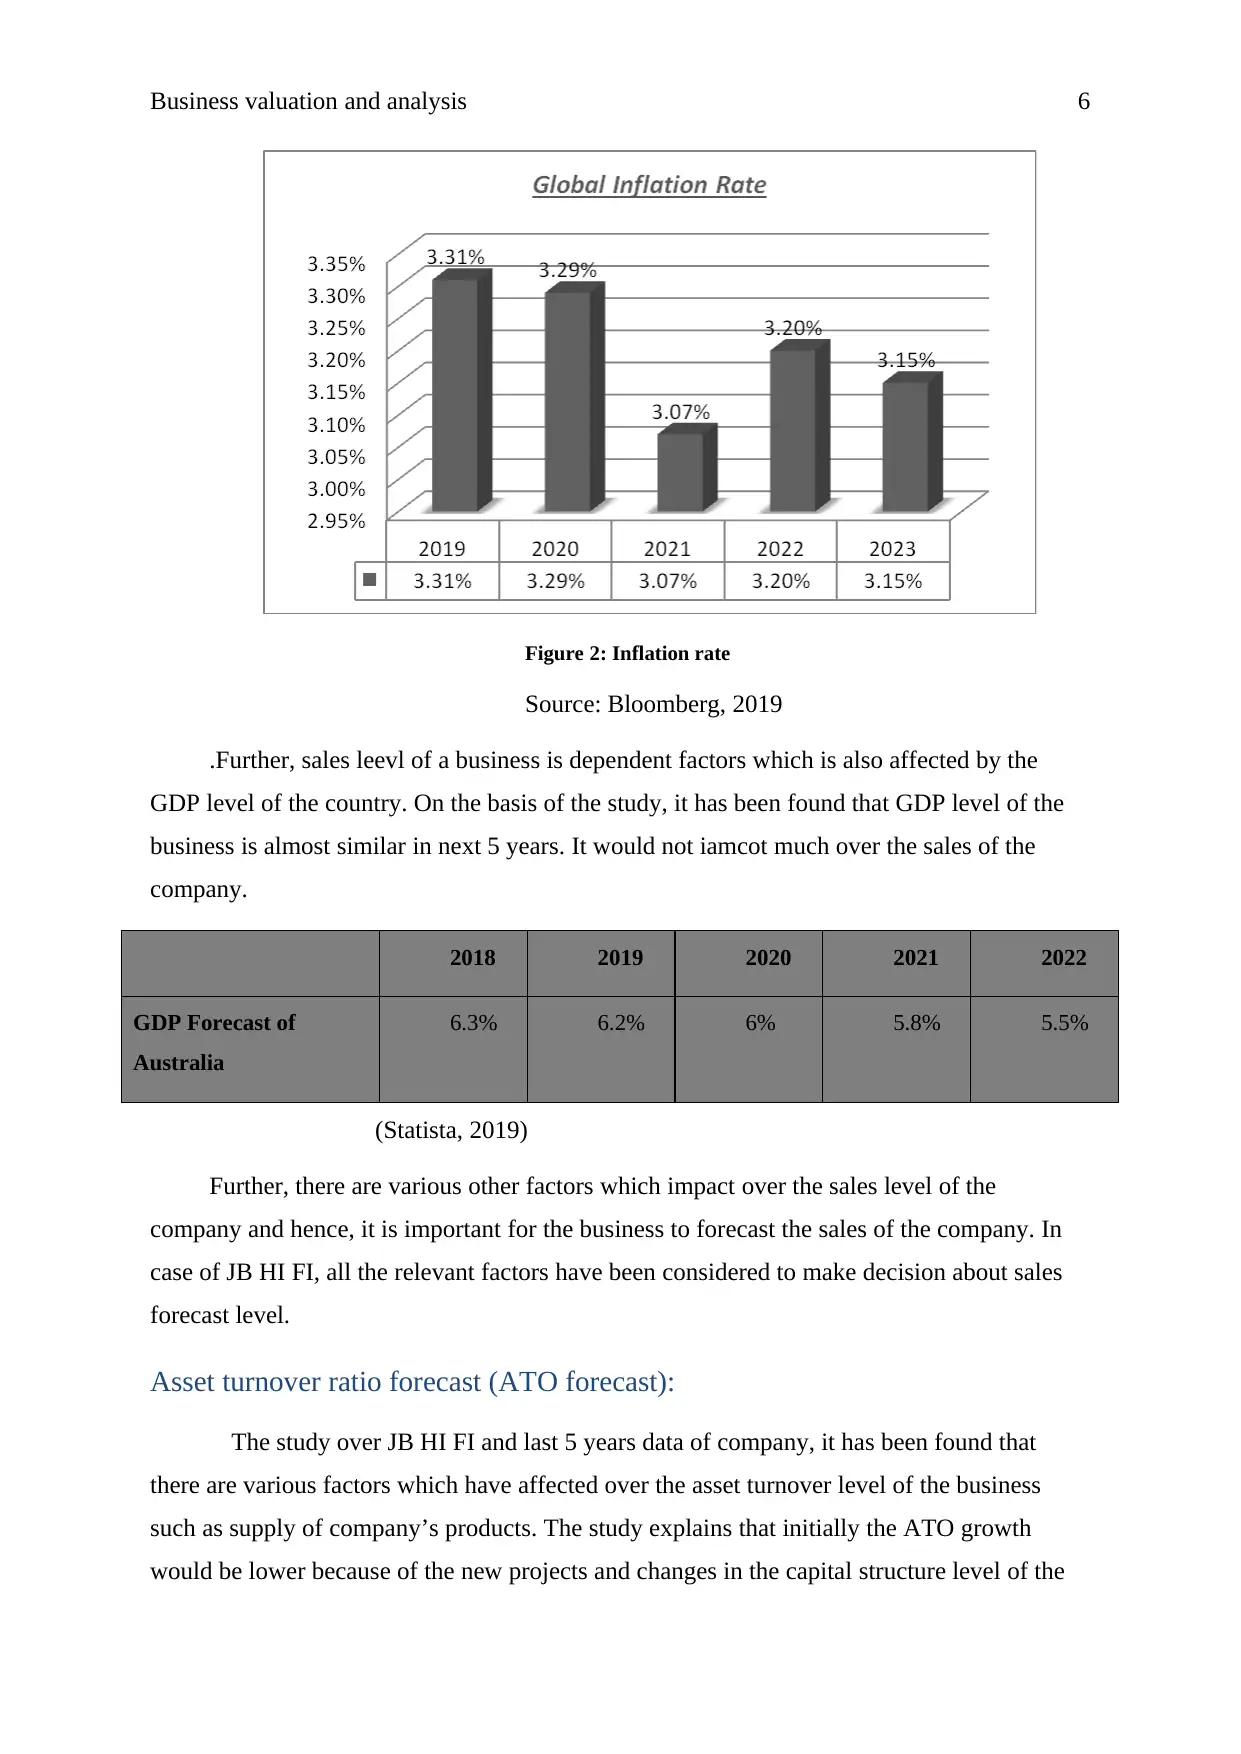
Figure 2: Inflation rate
Source: Bloomberg, 2019
.Further, sales leevl of a business is dependent factors which is also affected by the
GDP level of the country. On the basis of the study, it has been found that GDP level of the
business is almost similar in next 5 years. It would not iamcot much over the sales of the
company.
2018 2019 2020 2021 2022
GDP Forecast of
Australia
6.3% 6.2% 6% 5.8% 5.5%
(Statista, 2019)
Further, there are various other factors which impact over the sales level of the
company and hence, it is important for the business to forecast the sales of the company. In
case of JB HI FI, all the relevant factors have been considered to make decision about sales
forecast level.
Asset turnover ratio forecast (ATO forecast):
The study over JB HI FI and last 5 years data of company, it has been found that
there are various factors which have affected over the asset turnover level of the business
such as supply of company’s products. The study explains that initially the ATO growth
would be lower because of the new projects and changes in the capital structure level of the
⊘ This is a preview!⊘
Do you want full access?
Subscribe today to unlock all pages.
Trusted by 1+ million students worldwide
Business valuation and analysis 7
business. But along with the time, ATO growth level of the business would be better and it
would help the business to make better decision
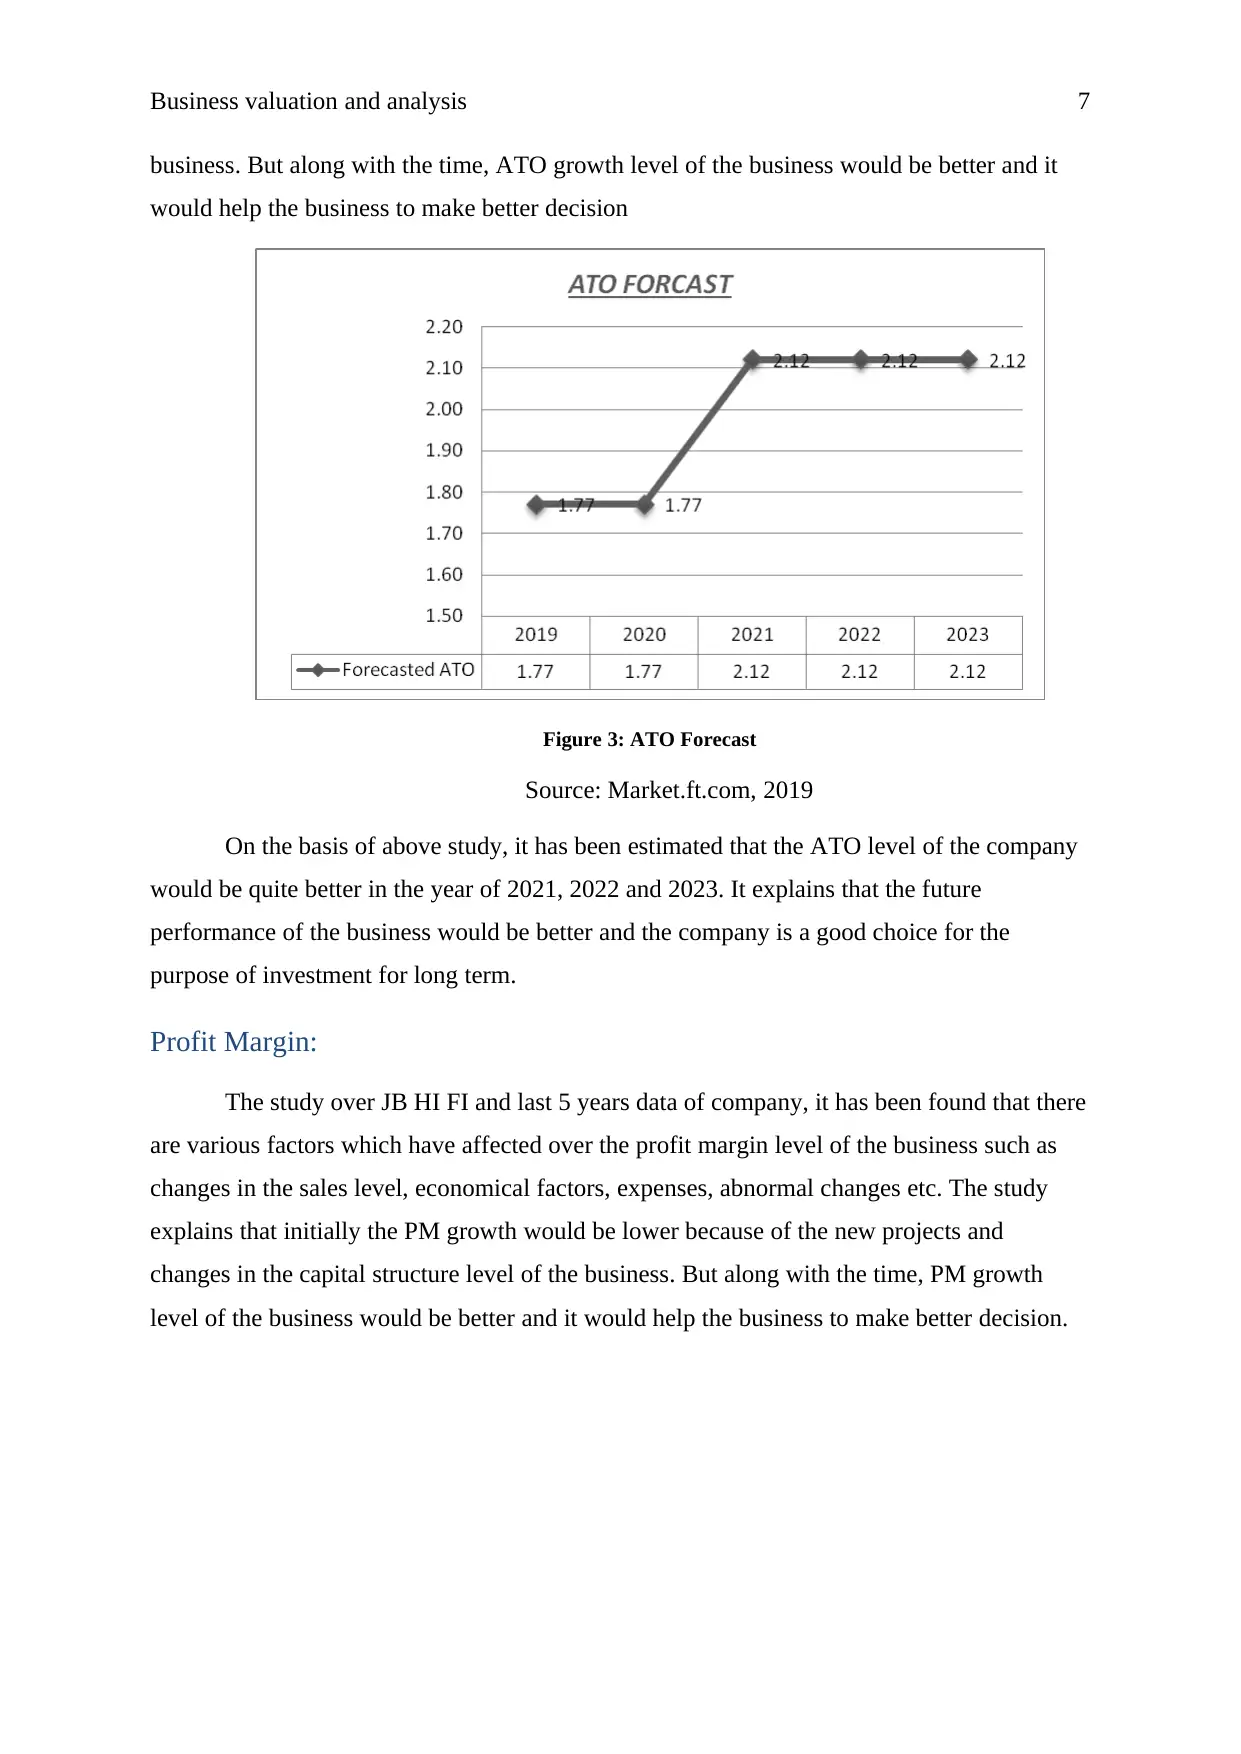
Figure 3: ATO Forecast
Source: Market.ft.com, 2019
On the basis of above study, it has been estimated that the ATO level of the company
would be quite better in the year of 2021, 2022 and 2023. It explains that the future
performance of the business would be better and the company is a good choice for the
purpose of investment for long term.
Profit Margin:
The study over JB HI FI and last 5 years data of company, it has been found that there
are various factors which have affected over the profit margin level of the business such as
changes in the sales level, economical factors, expenses, abnormal changes etc. The study
explains that initially the PM growth would be lower because of the new projects and
changes in the capital structure level of the business. But along with the time, PM growth
level of the business would be better and it would help the business to make better decision.
business. But along with the time, ATO growth level of the business would be better and it
would help the business to make better decision
Figure 3: ATO Forecast
Source: Market.ft.com, 2019
On the basis of above study, it has been estimated that the ATO level of the company
would be quite better in the year of 2021, 2022 and 2023. It explains that the future
performance of the business would be better and the company is a good choice for the
purpose of investment for long term.
Profit Margin:
The study over JB HI FI and last 5 years data of company, it has been found that there
are various factors which have affected over the profit margin level of the business such as
changes in the sales level, economical factors, expenses, abnormal changes etc. The study
explains that initially the PM growth would be lower because of the new projects and
changes in the capital structure level of the business. But along with the time, PM growth
level of the business would be better and it would help the business to make better decision.
Paraphrase This Document
Need a fresh take? Get an instant paraphrase of this document with our AI Paraphraser
Business valuation and analysis 8
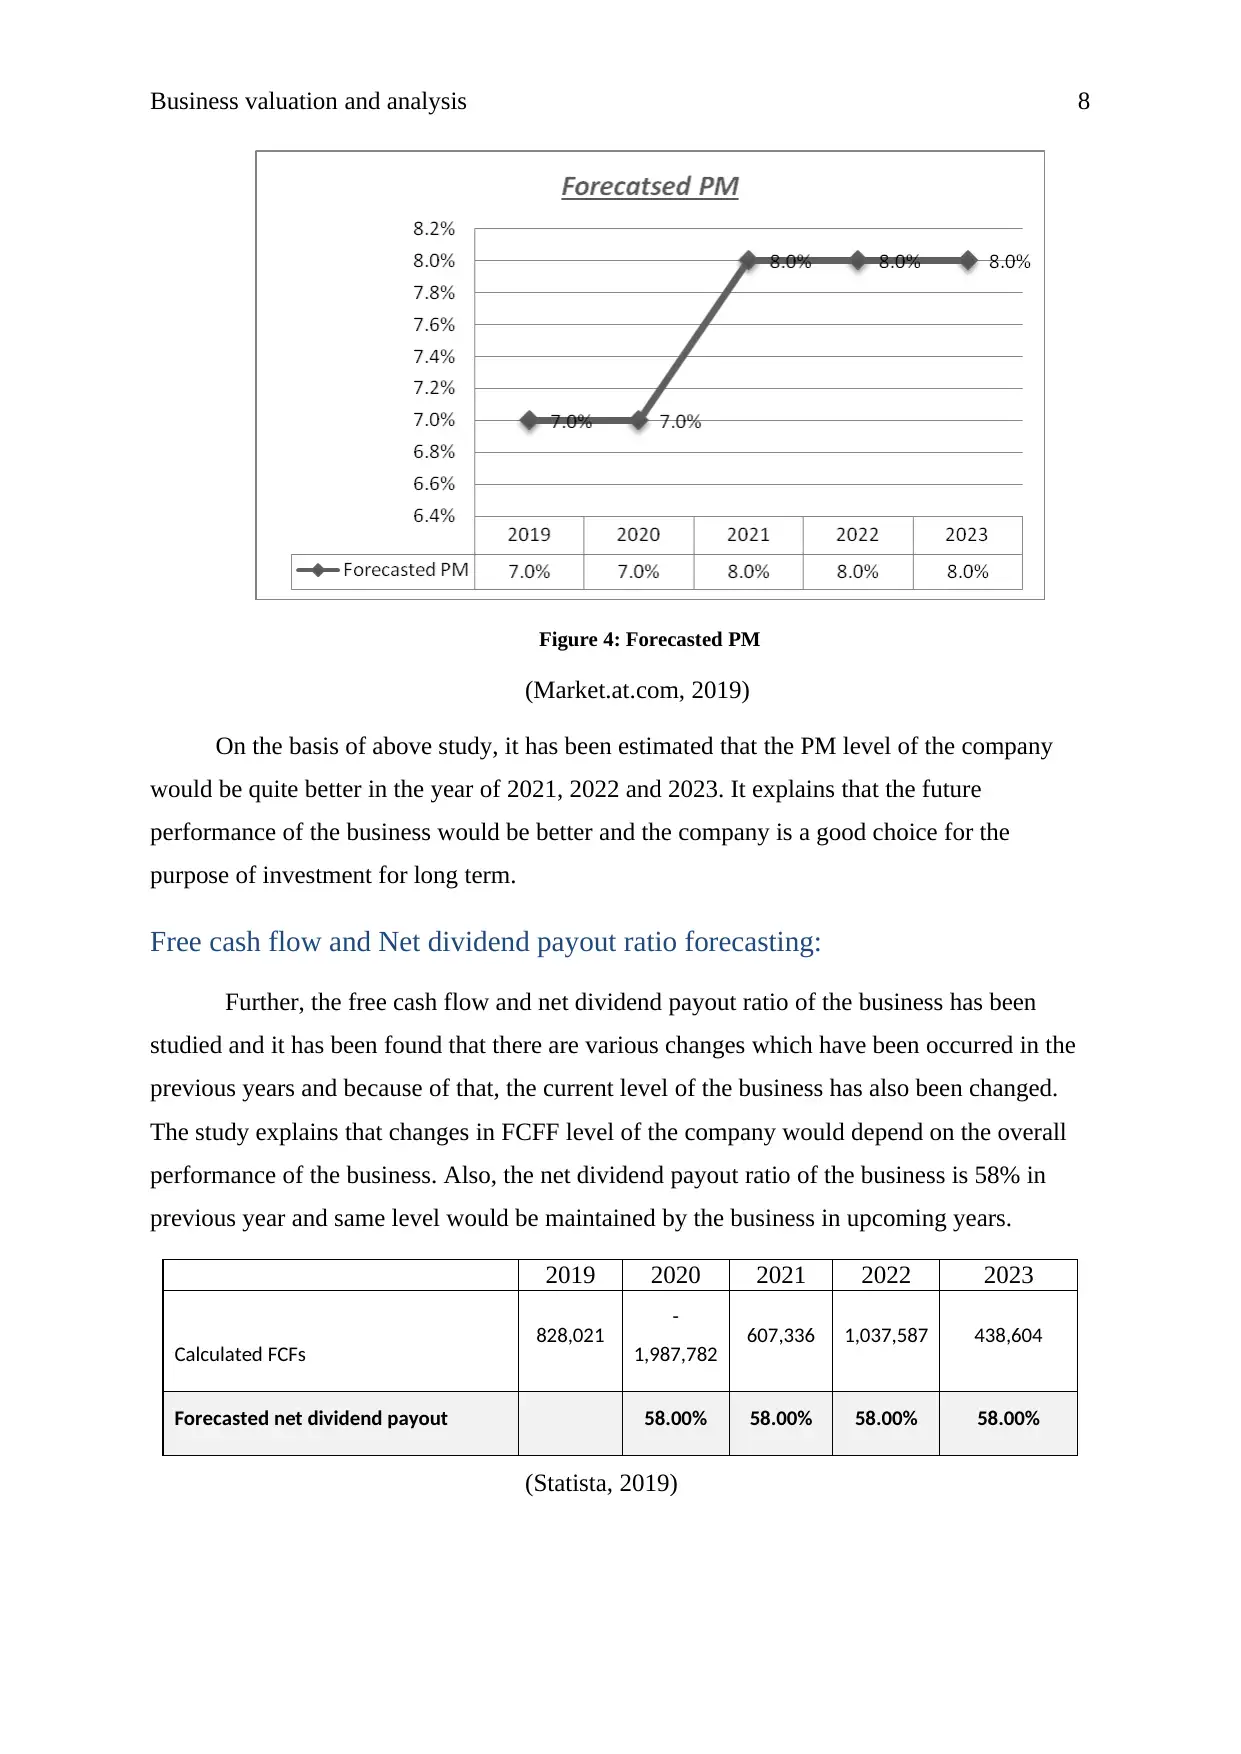
Figure 4: Forecasted PM
(Market.at.com, 2019)
On the basis of above study, it has been estimated that the PM level of the company
would be quite better in the year of 2021, 2022 and 2023. It explains that the future
performance of the business would be better and the company is a good choice for the
purpose of investment for long term.
Free cash flow and Net dividend payout ratio forecasting:
Further, the free cash flow and net dividend payout ratio of the business has been
studied and it has been found that there are various changes which have been occurred in the
previous years and because of that, the current level of the business has also been changed.
The study explains that changes in FCFF level of the company would depend on the overall
performance of the business. Also, the net dividend payout ratio of the business is 58% in
previous year and same level would be maintained by the business in upcoming years.
2019 2020 2021 2022 2023
Calculated FCFs 828,021 -
1,987,782 607,336 1,037,587 438,604
Forecasted net dividend payout 58.00% 58.00% 58.00% 58.00%
(Statista, 2019)
Business valuation and analysis 9
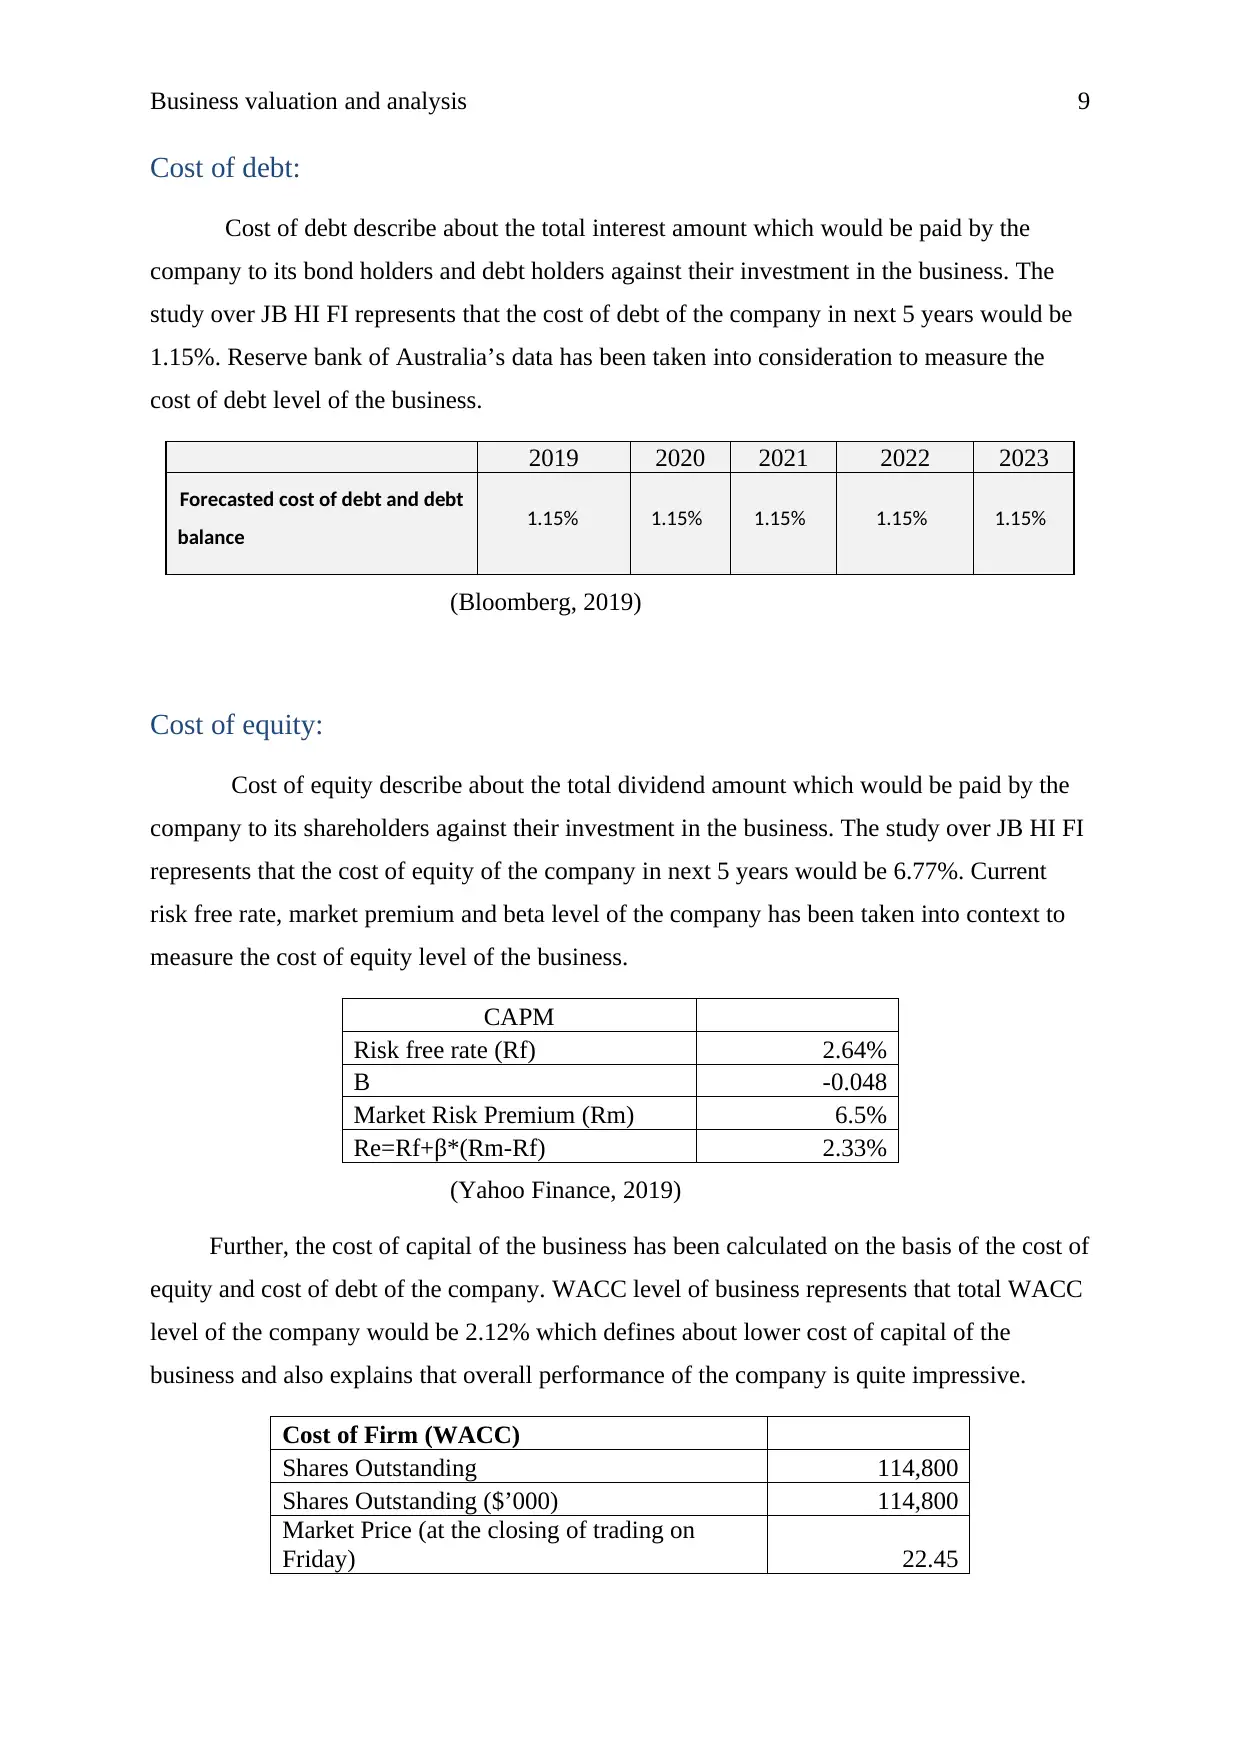
Cost of debt:
Cost of debt describe about the total interest amount which would be paid by the
company to its bond holders and debt holders against their investment in the business. The
study over JB HI FI represents that the cost of debt of the company in next 5 years would be
1.15%. Reserve bank of Australia’s data has been taken into consideration to measure the
cost of debt level of the business.
2019 2020 2021 2022 2023
Forecasted cost of debt and debt
balance 1.15% 1.15% 1.15% 1.15% 1.15%
(Bloomberg, 2019)
Cost of equity:
Cost of equity describe about the total dividend amount which would be paid by the
company to its shareholders against their investment in the business. The study over JB HI FI
represents that the cost of equity of the company in next 5 years would be 6.77%. Current
risk free rate, market premium and beta level of the company has been taken into context to
measure the cost of equity level of the business.
CAPM
Risk free rate (Rf) 2.64%
Β -0.048
Market Risk Premium (Rm) 6.5%
Re=Rf+β*(Rm-Rf) 2.33%
(Yahoo Finance, 2019)
Further, the cost of capital of the business has been calculated on the basis of the cost of
equity and cost of debt of the company. WACC level of business represents that total WACC
level of the company would be 2.12% which defines about lower cost of capital of the
business and also explains that overall performance of the company is quite impressive.
Cost of Firm (WACC)
Shares Outstanding 114,800
Shares Outstanding ($’000) 114,800
Market Price (at the closing of trading on
Friday) 22.45
⊘ This is a preview!⊘
Do you want full access?
Subscribe today to unlock all pages.
Trusted by 1+ million students worldwide
Business valuation and analysis 10
Market Value of Equity 2,577,260
Market Value of Equity ($’000) 2,577,260
NFO 566,100
Rd 1.15%
MV 2,577,260
Re 2.33%
NFO+MV 3,143,360
WACC 2.12%
(Bloomberg, 2019)
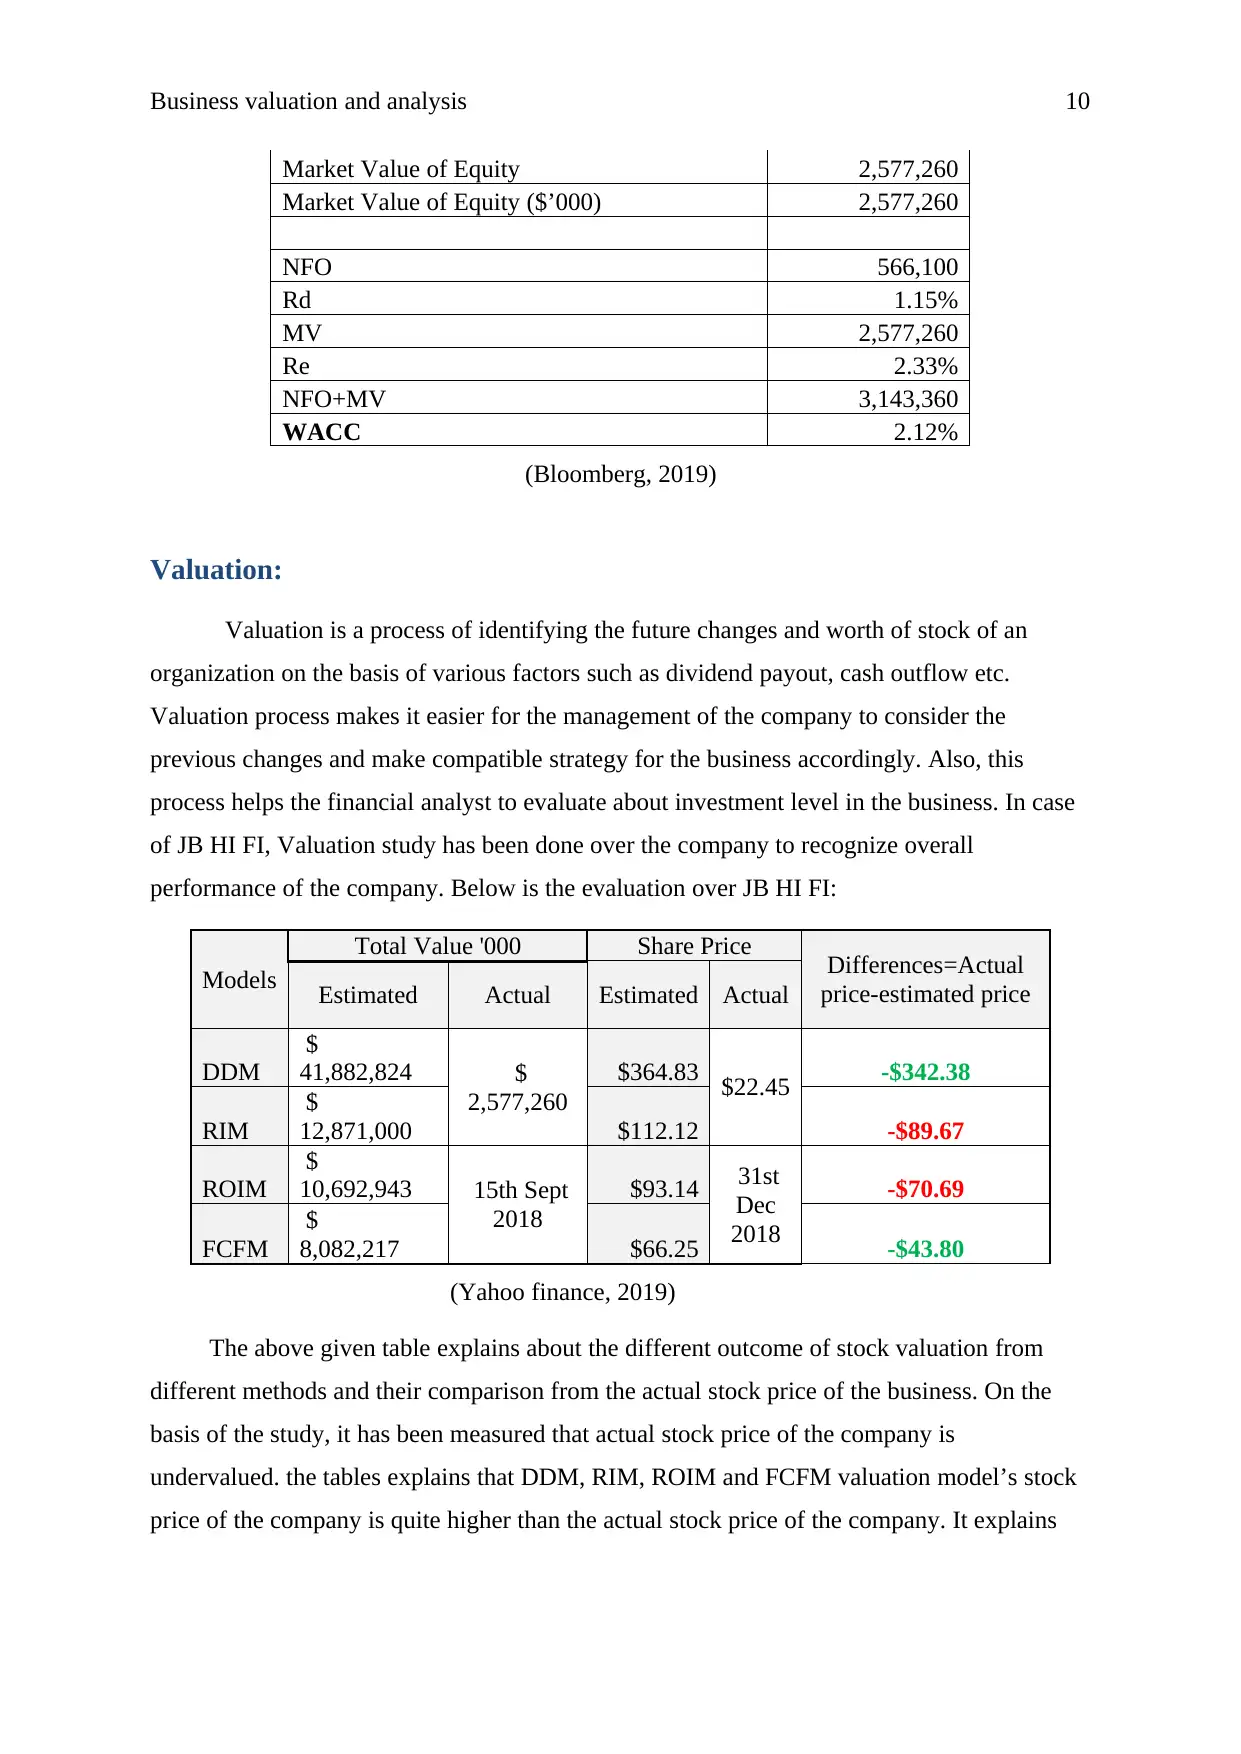
Valuation:
Valuation is a process of identifying the future changes and worth of stock of an
organization on the basis of various factors such as dividend payout, cash outflow etc.
Valuation process makes it easier for the management of the company to consider the
previous changes and make compatible strategy for the business accordingly. Also, this
process helps the financial analyst to evaluate about investment level in the business. In case
of JB HI FI, Valuation study has been done over the company to recognize overall
performance of the company. Below is the evaluation over JB HI FI:
Models
Total Value '000 Share Price Differences=Actual
price-estimated priceEstimated Actual Estimated Actual
DDM
$
41,882,824 $
2,577,260
$364.83 $22.45 -$342.38
RIM
$
12,871,000 $112.12 -$89.67
ROIM
$
10,692,943 15th Sept
2018
$93.14 31st
Dec
2018
-$70.69
FCFM
$
8,082,217 $66.25 -$43.80
(Yahoo finance, 2019)
The above given table explains about the different outcome of stock valuation from
different methods and their comparison from the actual stock price of the business. On the
basis of the study, it has been measured that actual stock price of the company is
undervalued. the tables explains that DDM, RIM, ROIM and FCFM valuation model’s stock
price of the company is quite higher than the actual stock price of the company. It explains
Market Value of Equity 2,577,260
Market Value of Equity ($’000) 2,577,260
NFO 566,100
Rd 1.15%
MV 2,577,260
Re 2.33%
NFO+MV 3,143,360
WACC 2.12%
(Bloomberg, 2019)
Valuation:
Valuation is a process of identifying the future changes and worth of stock of an
organization on the basis of various factors such as dividend payout, cash outflow etc.
Valuation process makes it easier for the management of the company to consider the
previous changes and make compatible strategy for the business accordingly. Also, this
process helps the financial analyst to evaluate about investment level in the business. In case
of JB HI FI, Valuation study has been done over the company to recognize overall
performance of the company. Below is the evaluation over JB HI FI:
Models
Total Value '000 Share Price Differences=Actual
price-estimated priceEstimated Actual Estimated Actual
DDM
$
41,882,824 $
2,577,260
$364.83 $22.45 -$342.38
RIM
$
12,871,000 $112.12 -$89.67
ROIM
$
10,692,943 15th Sept
2018
$93.14 31st
Dec
2018
-$70.69
FCFM
$
8,082,217 $66.25 -$43.80
(Yahoo finance, 2019)
The above given table explains about the different outcome of stock valuation from
different methods and their comparison from the actual stock price of the business. On the
basis of the study, it has been measured that actual stock price of the company is
undervalued. the tables explains that DDM, RIM, ROIM and FCFM valuation model’s stock
price of the company is quite higher than the actual stock price of the company. It explains
Paraphrase This Document
Need a fresh take? Get an instant paraphrase of this document with our AI Paraphraser
Business valuation and analysis 11
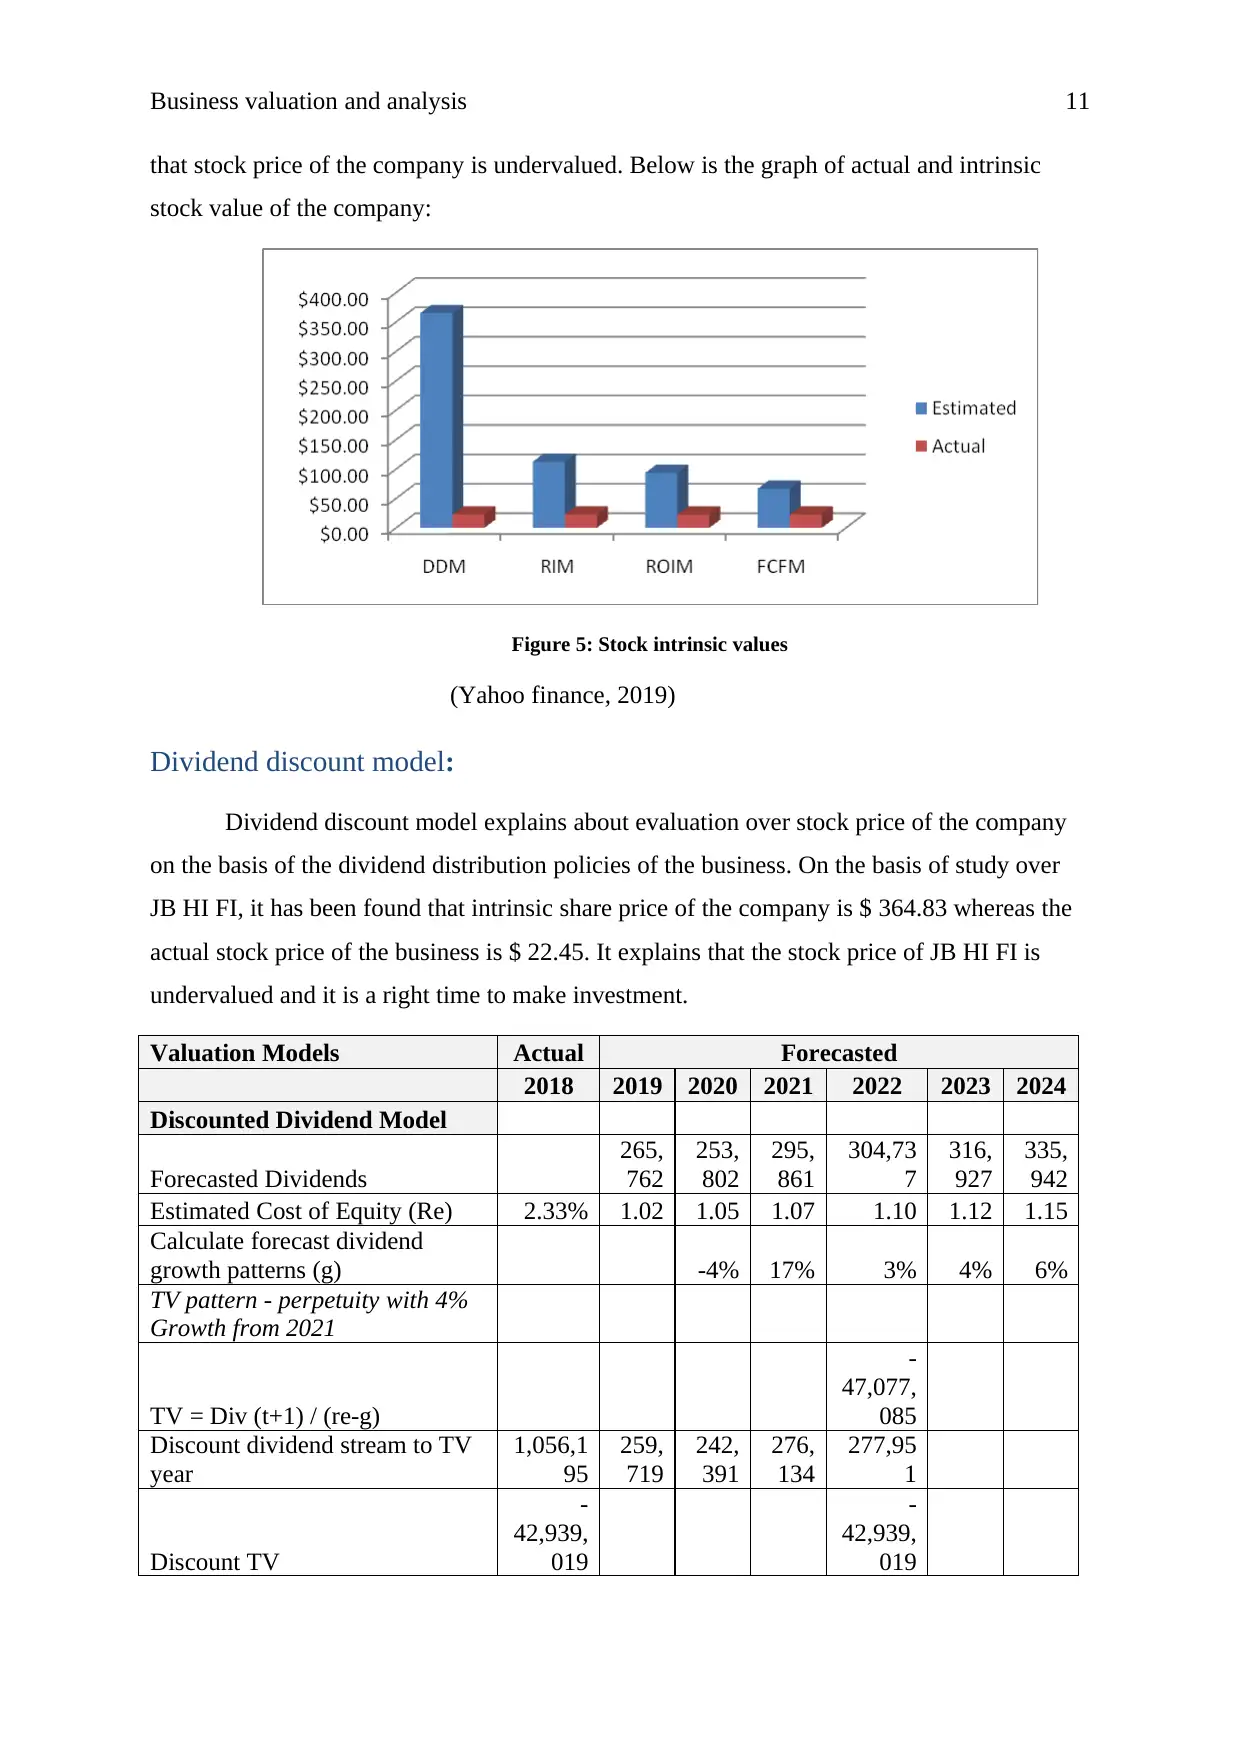
that stock price of the company is undervalued. Below is the graph of actual and intrinsic
stock value of the company:
Figure 5: Stock intrinsic values
(Yahoo finance, 2019)
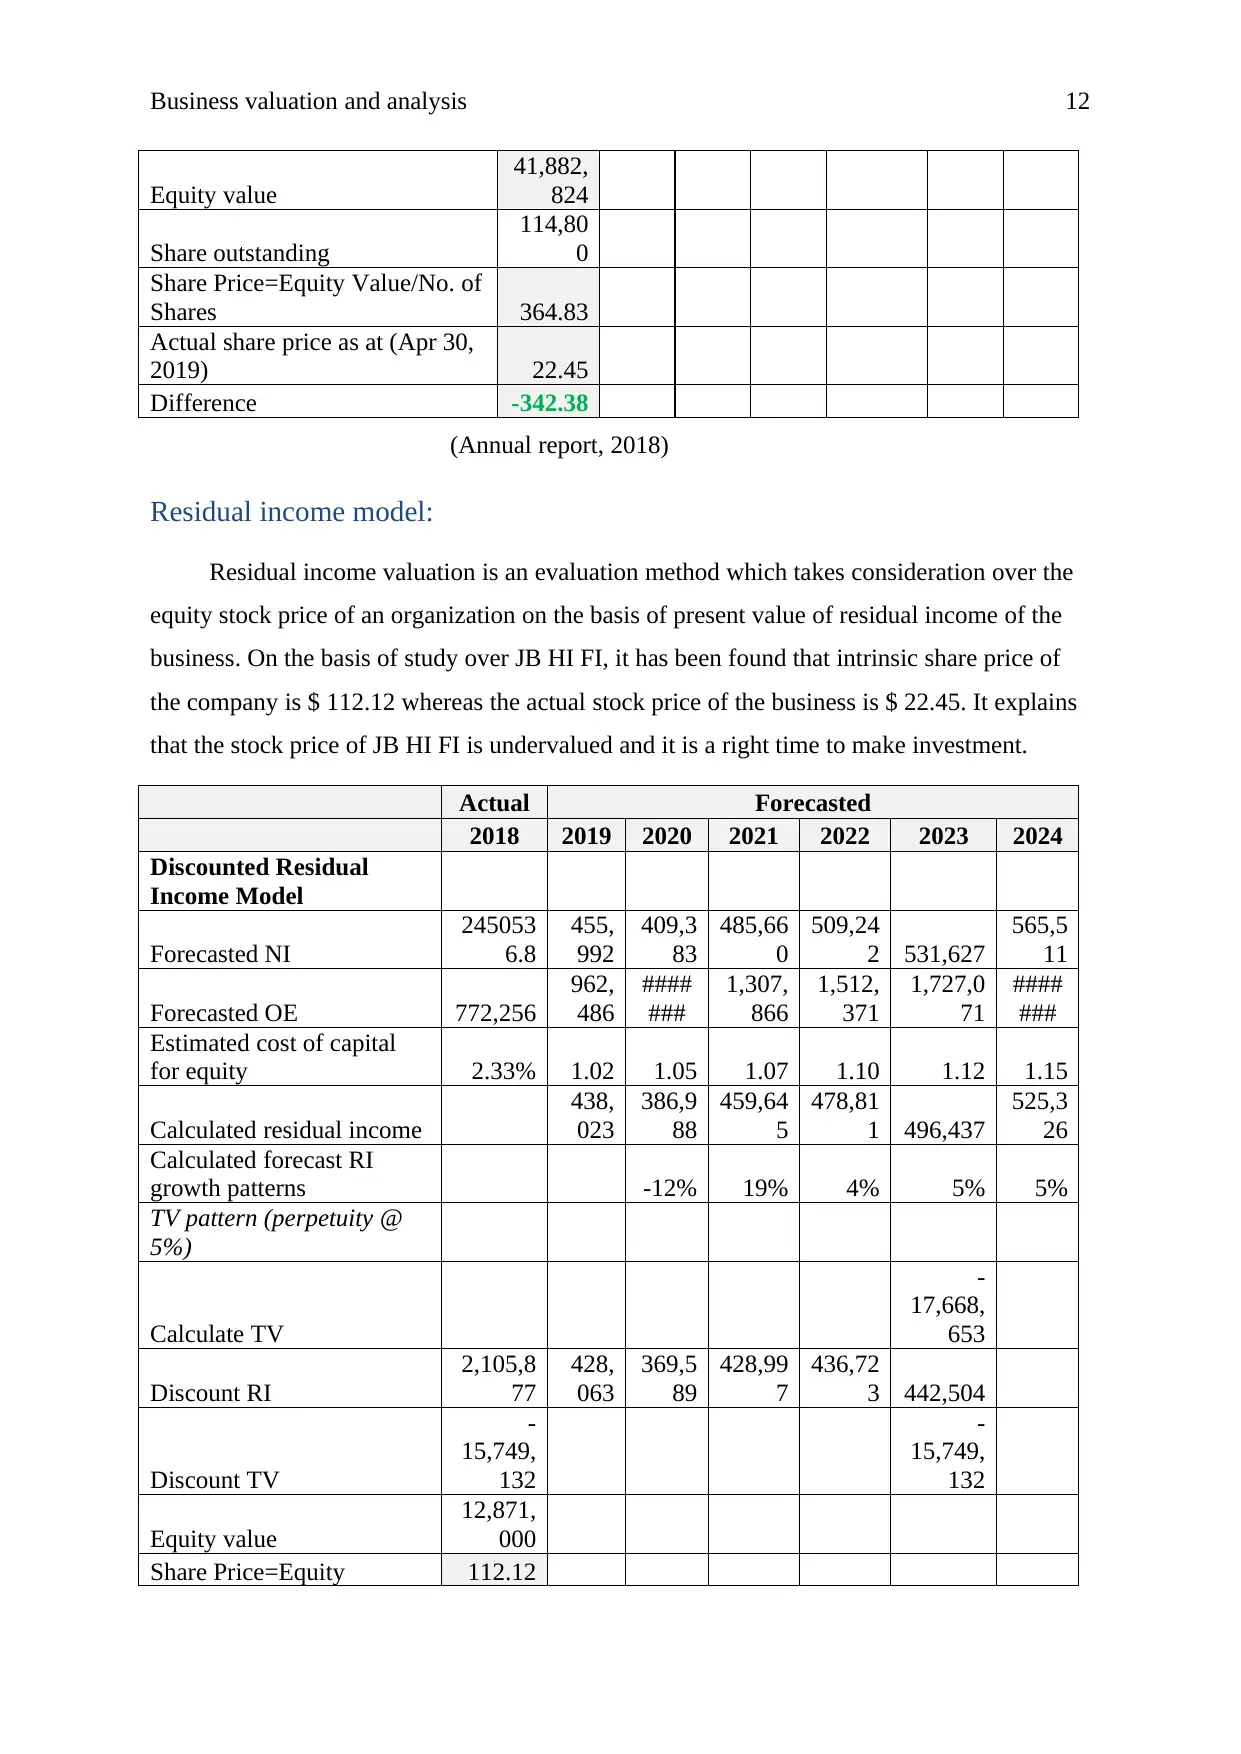
Dividend discount model:
Dividend discount model explains about evaluation over stock price of the company
on the basis of the dividend distribution policies of the business. On the basis of study over
JB HI FI, it has been found that intrinsic share price of the company is $ 364.83 whereas the
actual stock price of the business is $ 22.45. It explains that the stock price of JB HI FI is
undervalued and it is a right time to make investment.
Valuation Models Actual Forecasted
2018 2019 2020 2021 2022 2023 2024
Discounted Dividend Model
Forecasted Dividends
265,
762
253,
802
295,
861
304,73
7
316,
927
335,
942
Estimated Cost of Equity (Re) 2.33% 1.02 1.05 1.07 1.10 1.12 1.15
Calculate forecast dividend
growth patterns (g) -4% 17% 3% 4% 6%
TV pattern - perpetuity with 4%
Growth from 2021
TV = Div (t+1) / (re-g)
-
47,077,
085
Discount dividend stream to TV
year
1,056,1
95
259,
719
242,
391
276,
134
277,95
1
Discount TV
-
42,939,
019
-
42,939,
019
that stock price of the company is undervalued. Below is the graph of actual and intrinsic
stock value of the company:
Figure 5: Stock intrinsic values
(Yahoo finance, 2019)
Dividend discount model:
Dividend discount model explains about evaluation over stock price of the company
on the basis of the dividend distribution policies of the business. On the basis of study over
JB HI FI, it has been found that intrinsic share price of the company is $ 364.83 whereas the
actual stock price of the business is $ 22.45. It explains that the stock price of JB HI FI is
undervalued and it is a right time to make investment.
Valuation Models Actual Forecasted
2018 2019 2020 2021 2022 2023 2024
Discounted Dividend Model
Forecasted Dividends
265,
762
253,
802
295,
861
304,73
7
316,
927
335,
942
Estimated Cost of Equity (Re) 2.33% 1.02 1.05 1.07 1.10 1.12 1.15
Calculate forecast dividend
growth patterns (g) -4% 17% 3% 4% 6%
TV pattern - perpetuity with 4%
Growth from 2021
TV = Div (t+1) / (re-g)
-
47,077,
085
Discount dividend stream to TV
year
1,056,1
95
259,
719
242,
391
276,
134
277,95
1
Discount TV
-
42,939,
019
-
42,939,
019
Business valuation and analysis 12
Equity value
41,882,
824
Share outstanding
114,80
0
Share Price=Equity Value/No. of
Shares 364.83
Actual share price as at (Apr 30,
2019) 22.45
Difference -342.38
(Annual report, 2018)
Residual income model:
Residual income valuation is an evaluation method which takes consideration over the
equity stock price of an organization on the basis of present value of residual income of the
business. On the basis of study over JB HI FI, it has been found that intrinsic share price of
the company is $ 112.12 whereas the actual stock price of the business is $ 22.45. It explains
that the stock price of JB HI FI is undervalued and it is a right time to make investment.
Actual Forecasted
2018 2019 2020 2021 2022 2023 2024
Discounted Residual
Income Model
Forecasted NI
245053
6.8
455,
992
409,3
83
485,66
0
509,24
2 531,627
565,5
11
Forecasted OE 772,256
962,
486
####
###
1,307,
866
1,512,
371
1,727,0
71
####
###
Estimated cost of capital
for equity 2.33% 1.02 1.05 1.07 1.10 1.12 1.15
Calculated residual income
438,
023
386,9
88
459,64
5
478,81
1 496,437
525,3
26
Calculated forecast RI
growth patterns -12% 19% 4% 5% 5%
TV pattern (perpetuity @
5%)
Calculate TV
-
17,668,
653
Discount RI
2,105,8
77
428,
063
369,5
89
428,99
7
436,72
3 442,504
Discount TV
-
15,749,
132
-
15,749,
132
Equity value
12,871,
000
Share Price=Equity 112.12
Equity value
41,882,
824
Share outstanding
114,80
0
Share Price=Equity Value/No. of
Shares 364.83
Actual share price as at (Apr 30,
2019) 22.45
Difference -342.38
(Annual report, 2018)
Residual income model:
Residual income valuation is an evaluation method which takes consideration over the
equity stock price of an organization on the basis of present value of residual income of the
business. On the basis of study over JB HI FI, it has been found that intrinsic share price of
the company is $ 112.12 whereas the actual stock price of the business is $ 22.45. It explains
that the stock price of JB HI FI is undervalued and it is a right time to make investment.
Actual Forecasted
2018 2019 2020 2021 2022 2023 2024
Discounted Residual
Income Model
Forecasted NI
245053
6.8
455,
992
409,3
83
485,66
0
509,24
2 531,627
565,5
11
Forecasted OE 772,256
962,
486
####
###
1,307,
866
1,512,
371
1,727,0
71
####
###
Estimated cost of capital
for equity 2.33% 1.02 1.05 1.07 1.10 1.12 1.15
Calculated residual income
438,
023
386,9
88
459,64
5
478,81
1 496,437
525,3
26
Calculated forecast RI
growth patterns -12% 19% 4% 5% 5%
TV pattern (perpetuity @
5%)
Calculate TV
-
17,668,
653
Discount RI
2,105,8
77
428,
063
369,5
89
428,99
7
436,72
3 442,504
Discount TV
-
15,749,
132
-
15,749,
132
Equity value
12,871,
000
Share Price=Equity 112.12
⊘ This is a preview!⊘
Do you want full access?
Subscribe today to unlock all pages.
Trusted by 1+ million students worldwide
1 out of 22
Related Documents


Your All-in-One AI-Powered Toolkit for Academic Success.
+13062052269
info@desklib.com
Available 24*7 on WhatsApp / Email
![[object Object]](/_next/static/media/star-bottom.7253800d.svg)
Unlock your academic potential
Copyright © 2020–2025 A2Z Services. All Rights Reserved. Developed and managed by ZUCOL.