Business Valuation Report: Analysis of Free Cash Flow and Valuation
VerifiedAdded on 2020/05/04
|6
|458
|312
Report
AI Summary
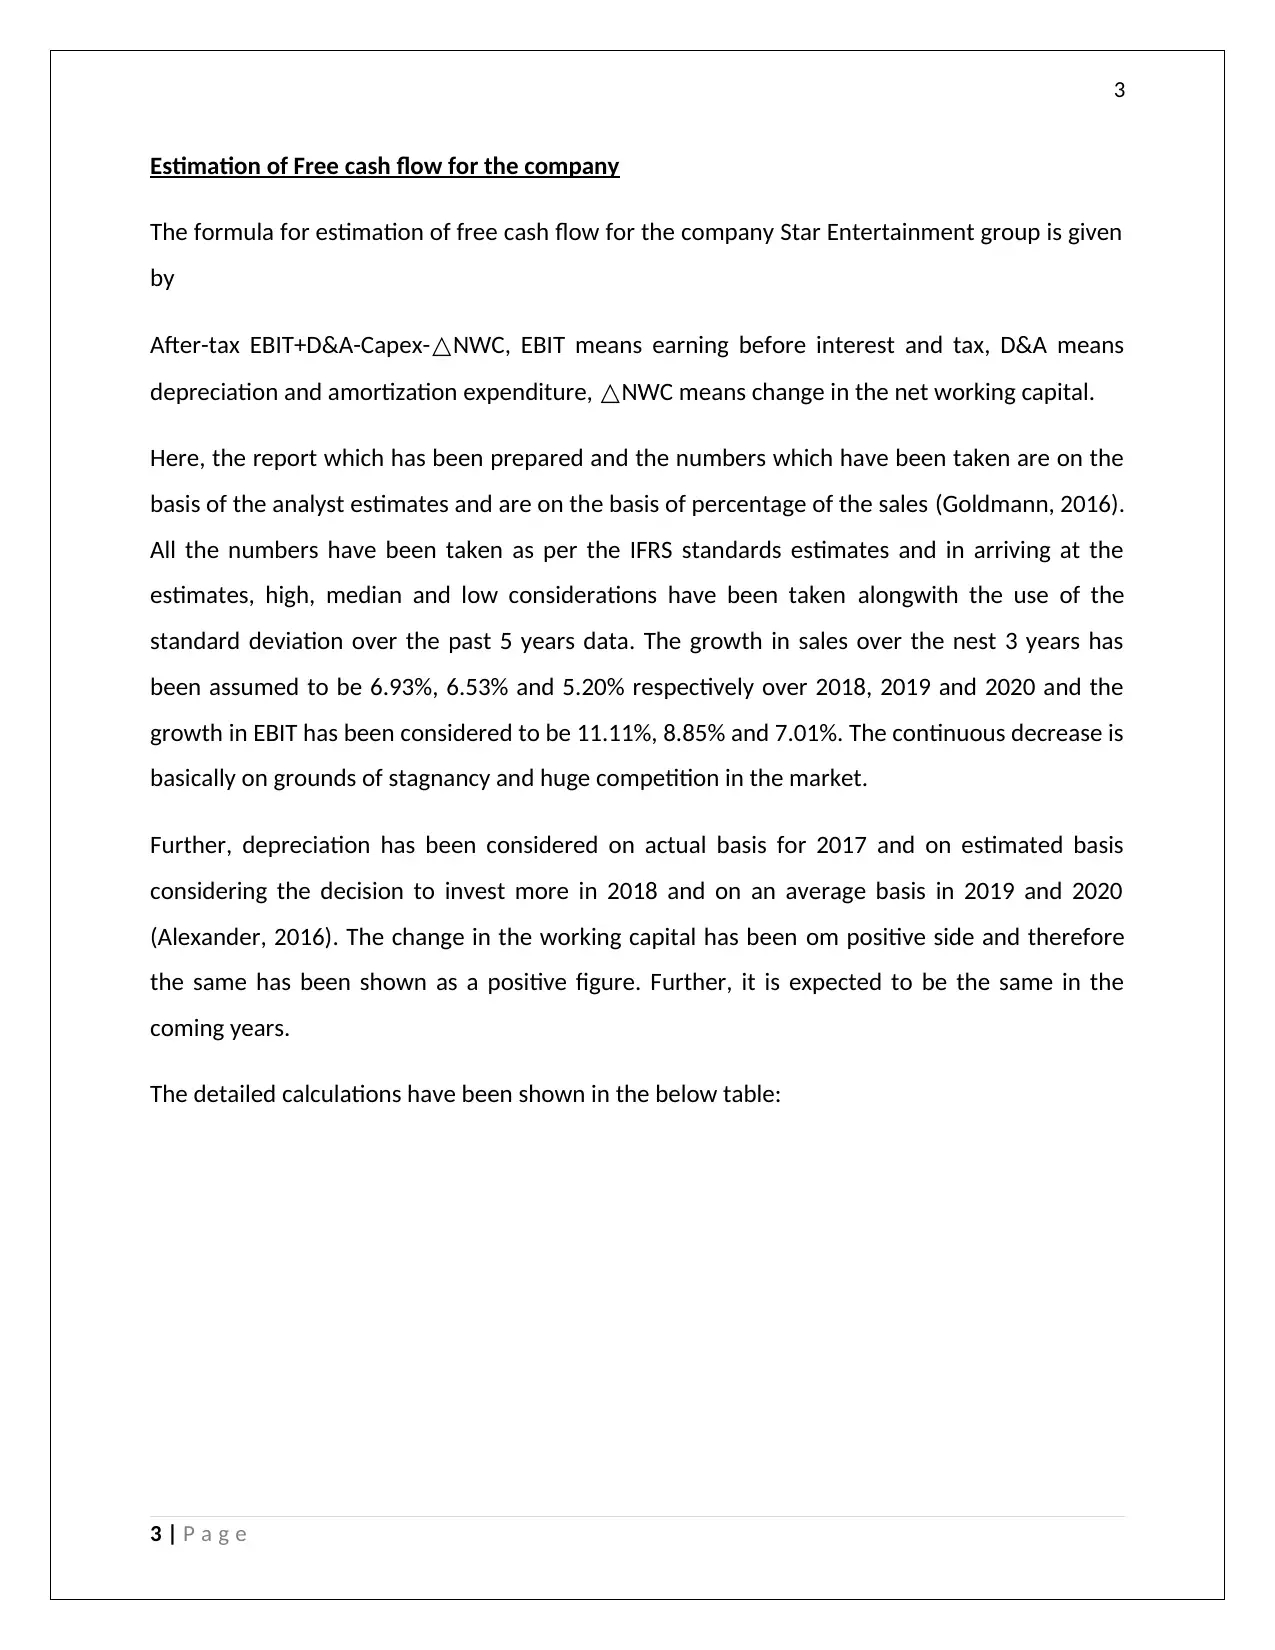
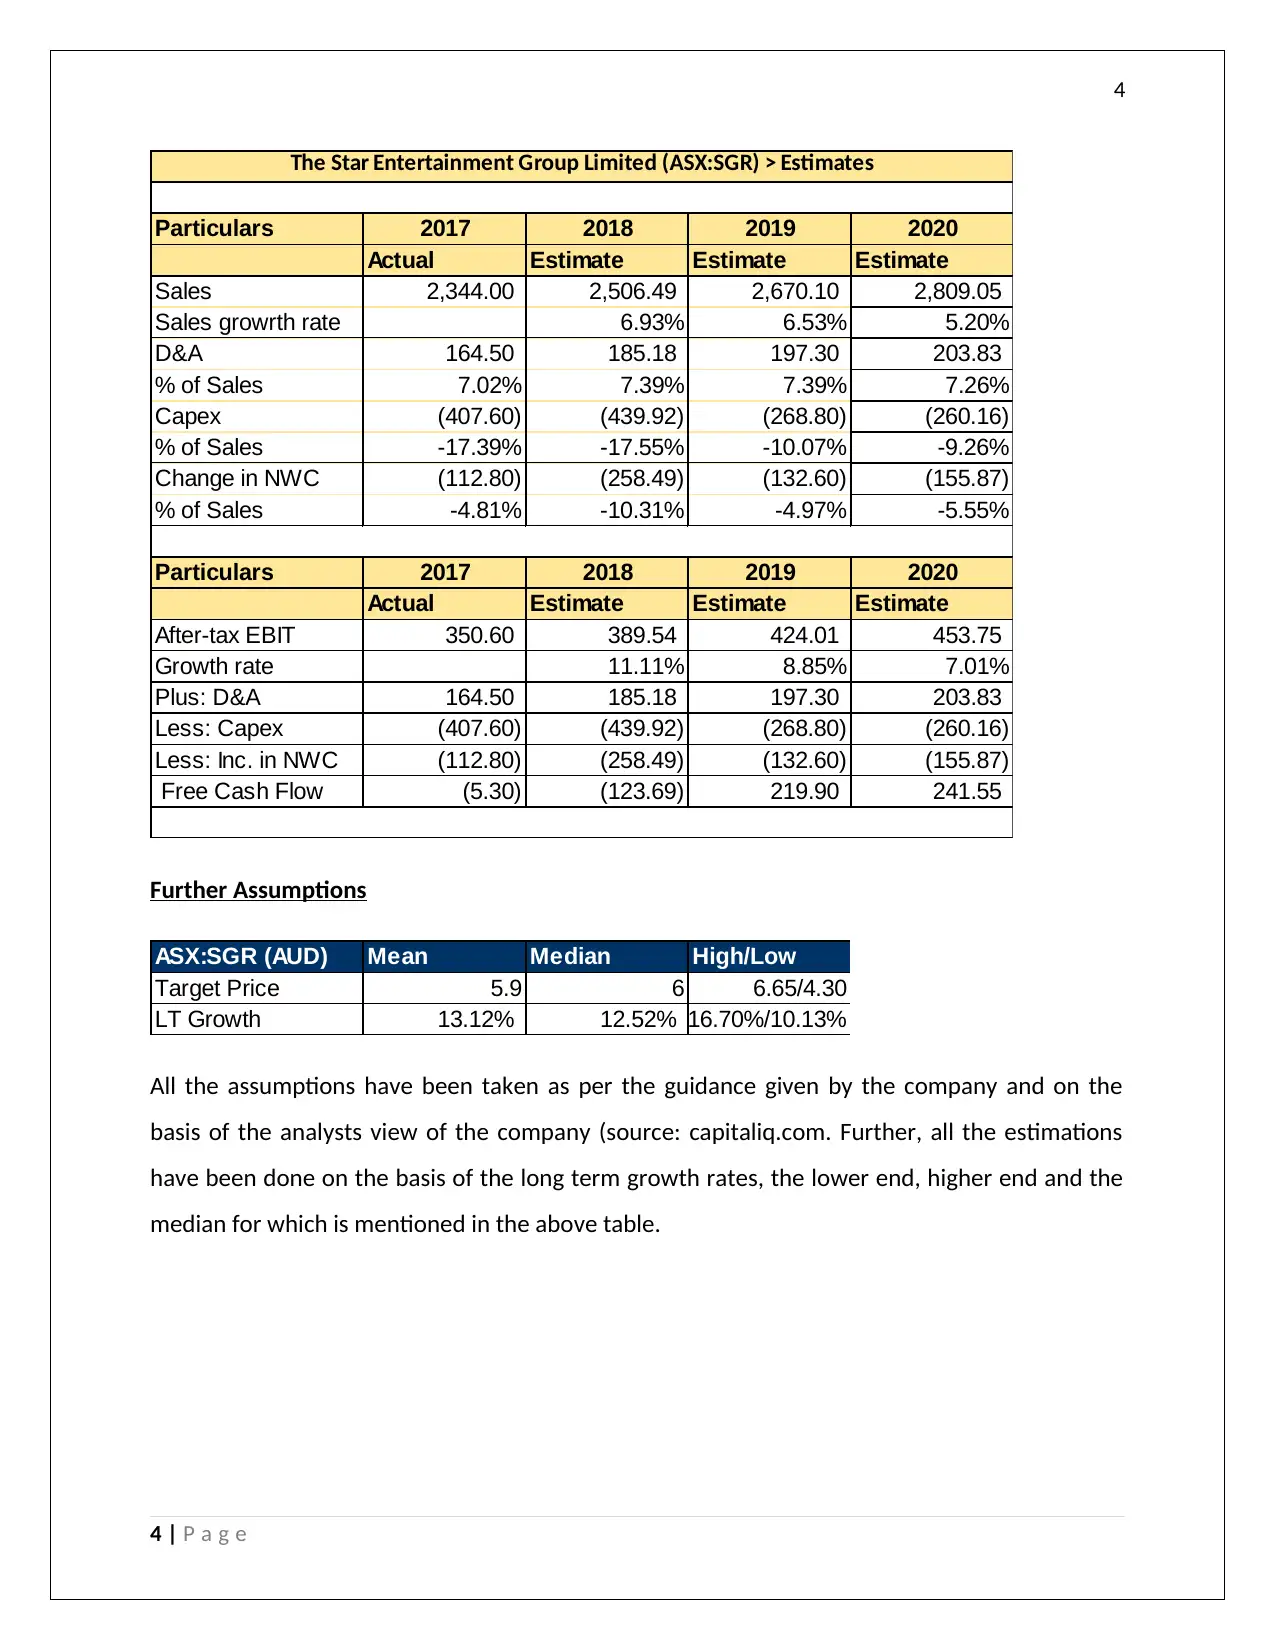
This report presents a business valuation analysis of the Star Entertainment Group, focusing on the estimation of free cash flow. The analysis utilizes EBIT, D&A, CAPEX, and changes in net working capital to project future cash flows. The report incorporates analyst estimates for sales and EBIT growth over a three-year period, considering market competition and depreciation. Assumptions are based on company guidance and analyst views, with estimations using long-term growth rates. The report includes detailed calculations and references, providing a comprehensive financial assessment of the company's valuation. This report provides insights into financial modeling and valuation techniques, offering a practical application of financial analysis principles. The data has been taken from the analyst estimates and all the estimations have been done on the basis of the long term growth rates, the lower end, higher end and the median for which is mentioned in the above table.

1 out of 6
Related Documents


Your All-in-One AI-Powered Toolkit for Academic Success.
+13062052269
info@desklib.com
Available 24*7 on WhatsApp / Email
![[object Object]](/_next/static/media/star-bottom.7253800d.svg)
Copyright © 2020–2026 A2Z Services. All Rights Reserved. Developed and managed by ZUCOL.