Comprehensive Data Analysis Project: Excel and Statistical Techniques
VerifiedAdded on 2020/01/07
|13
|2091
|229
Project
AI Summary
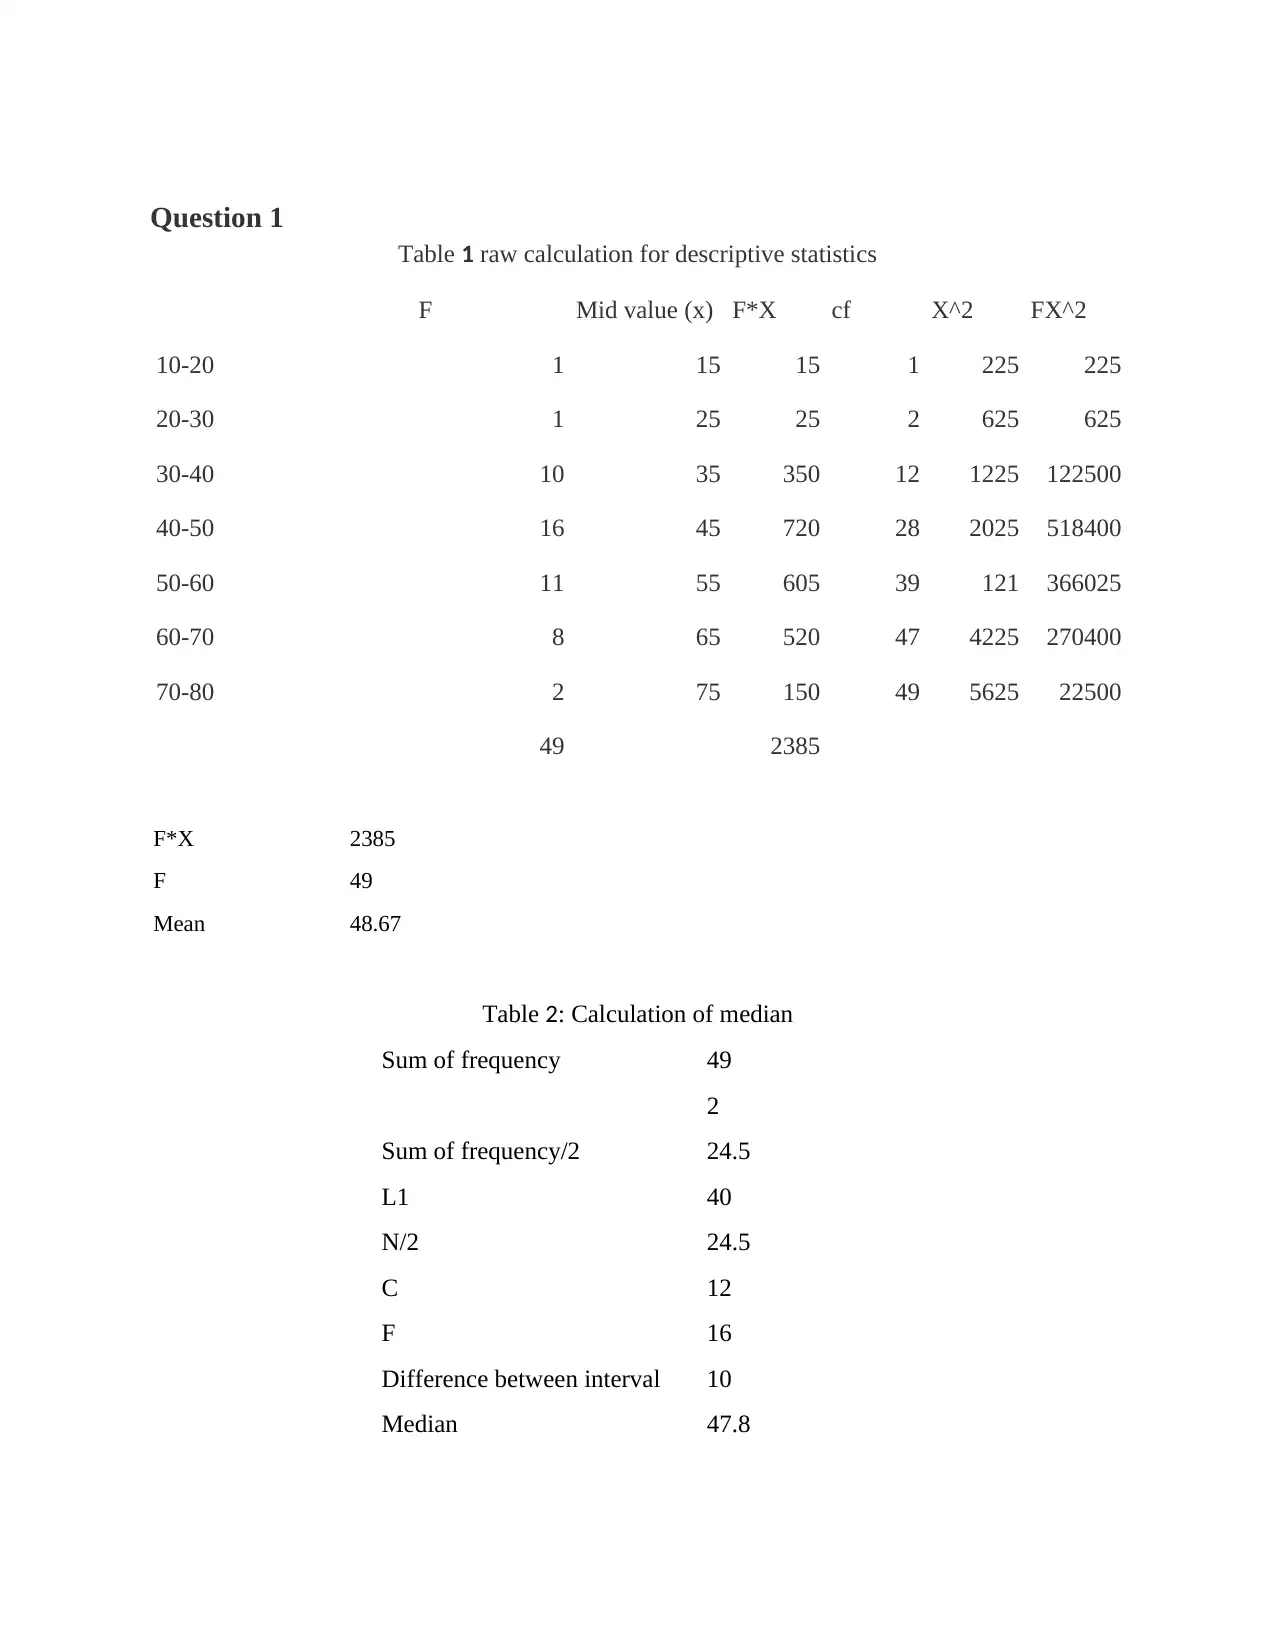
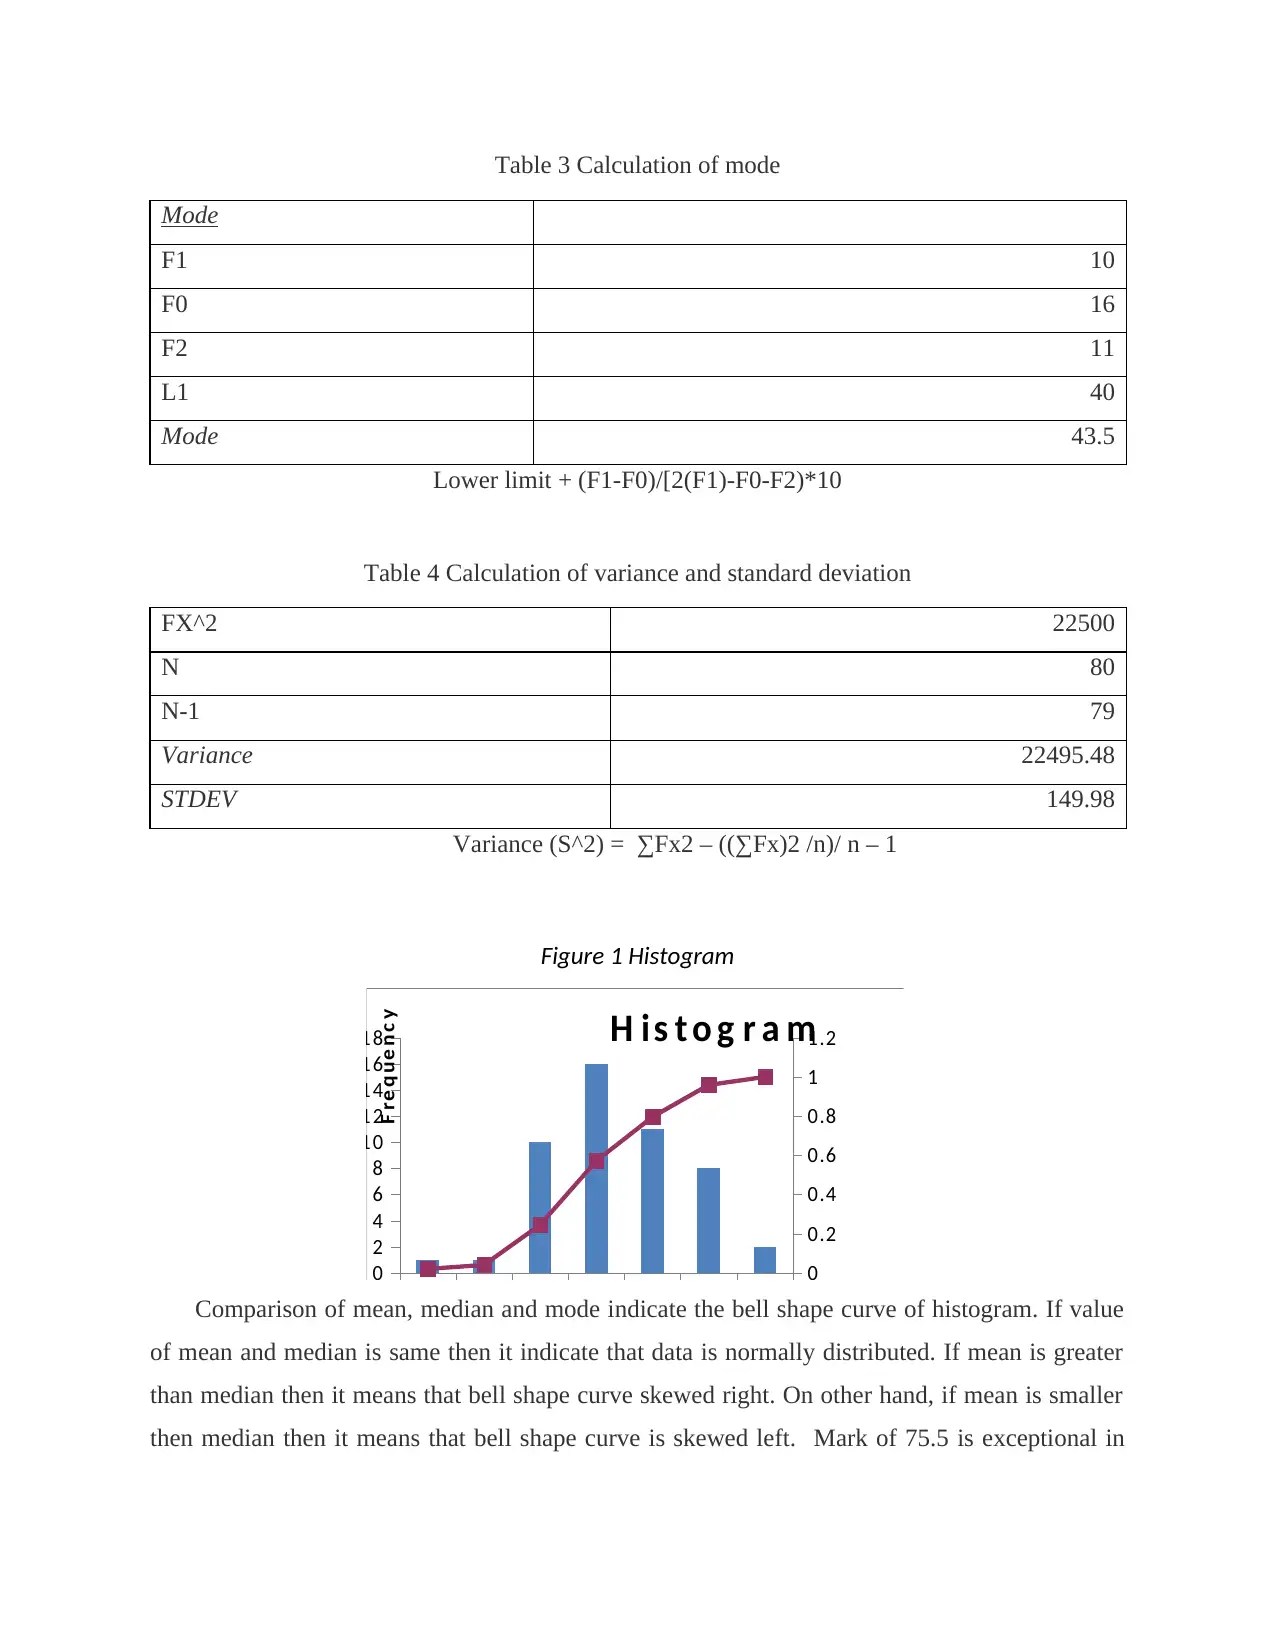
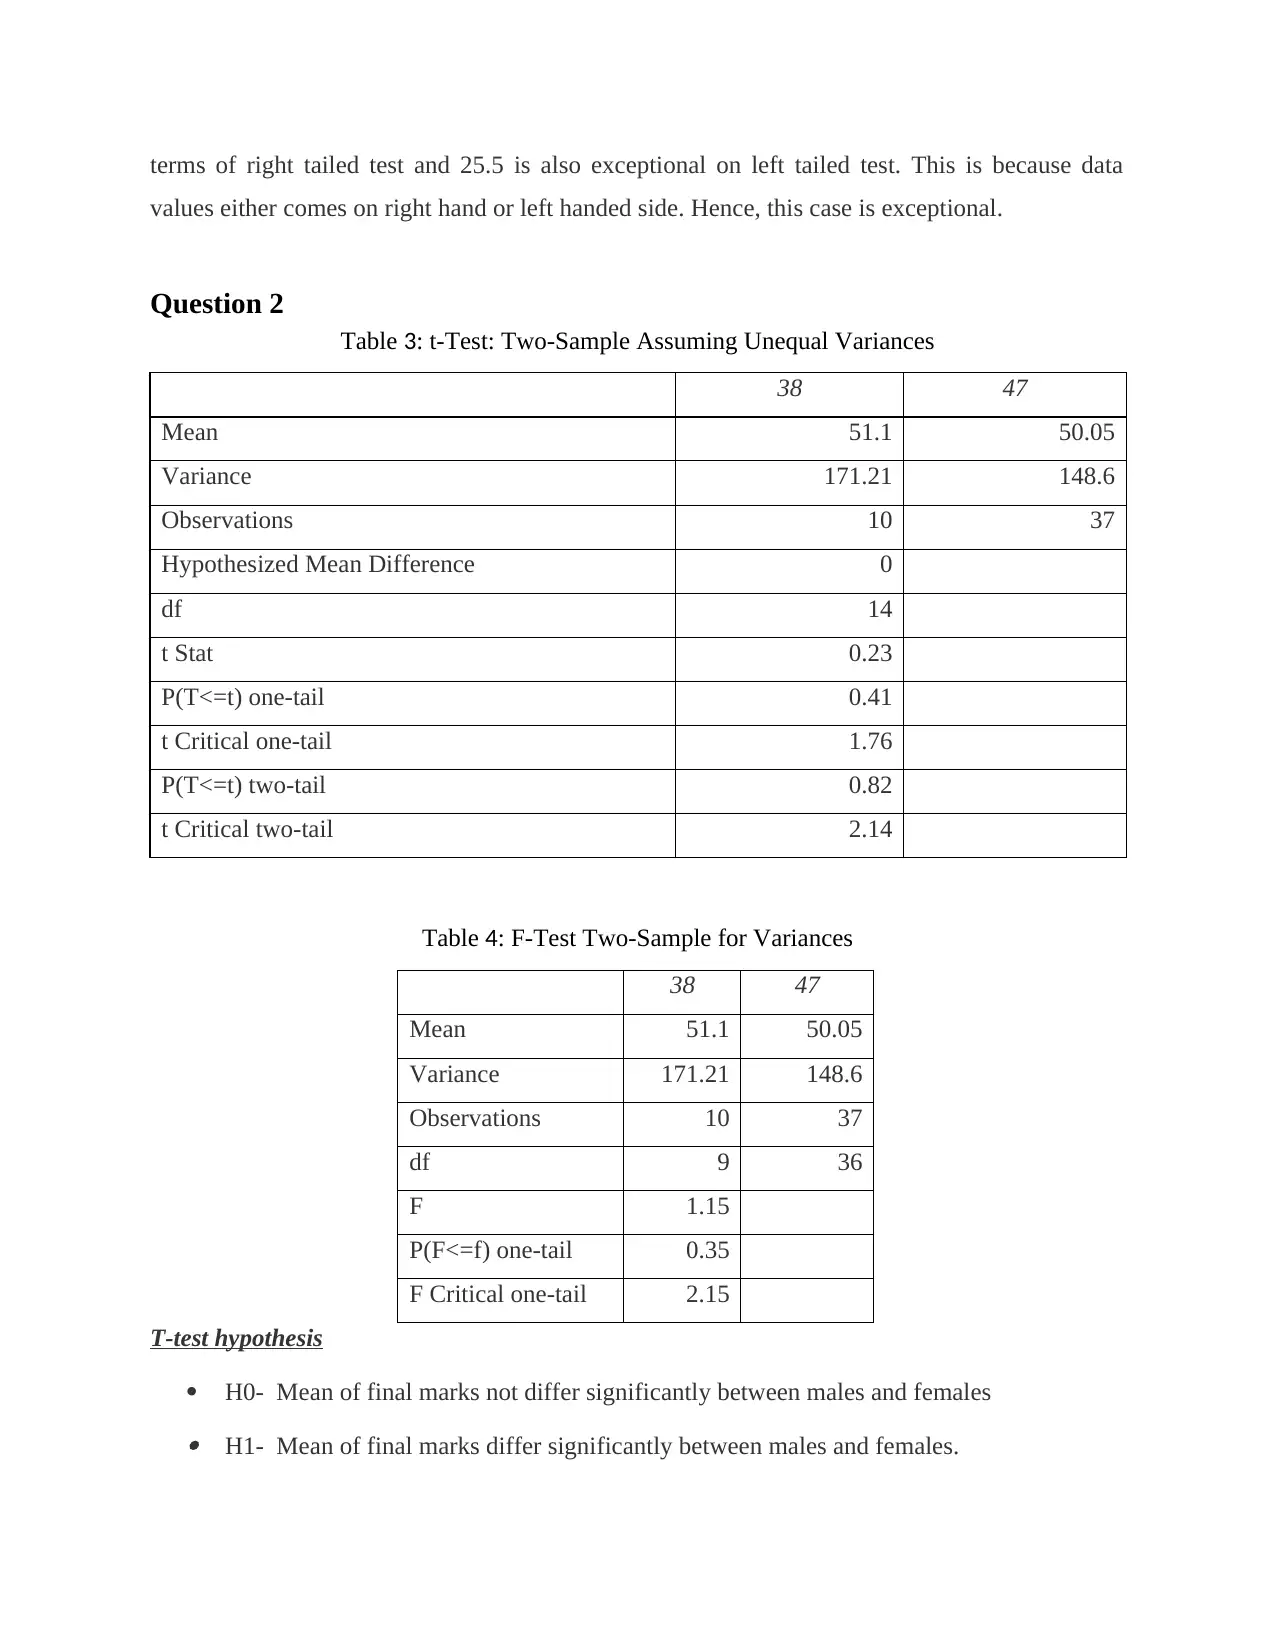
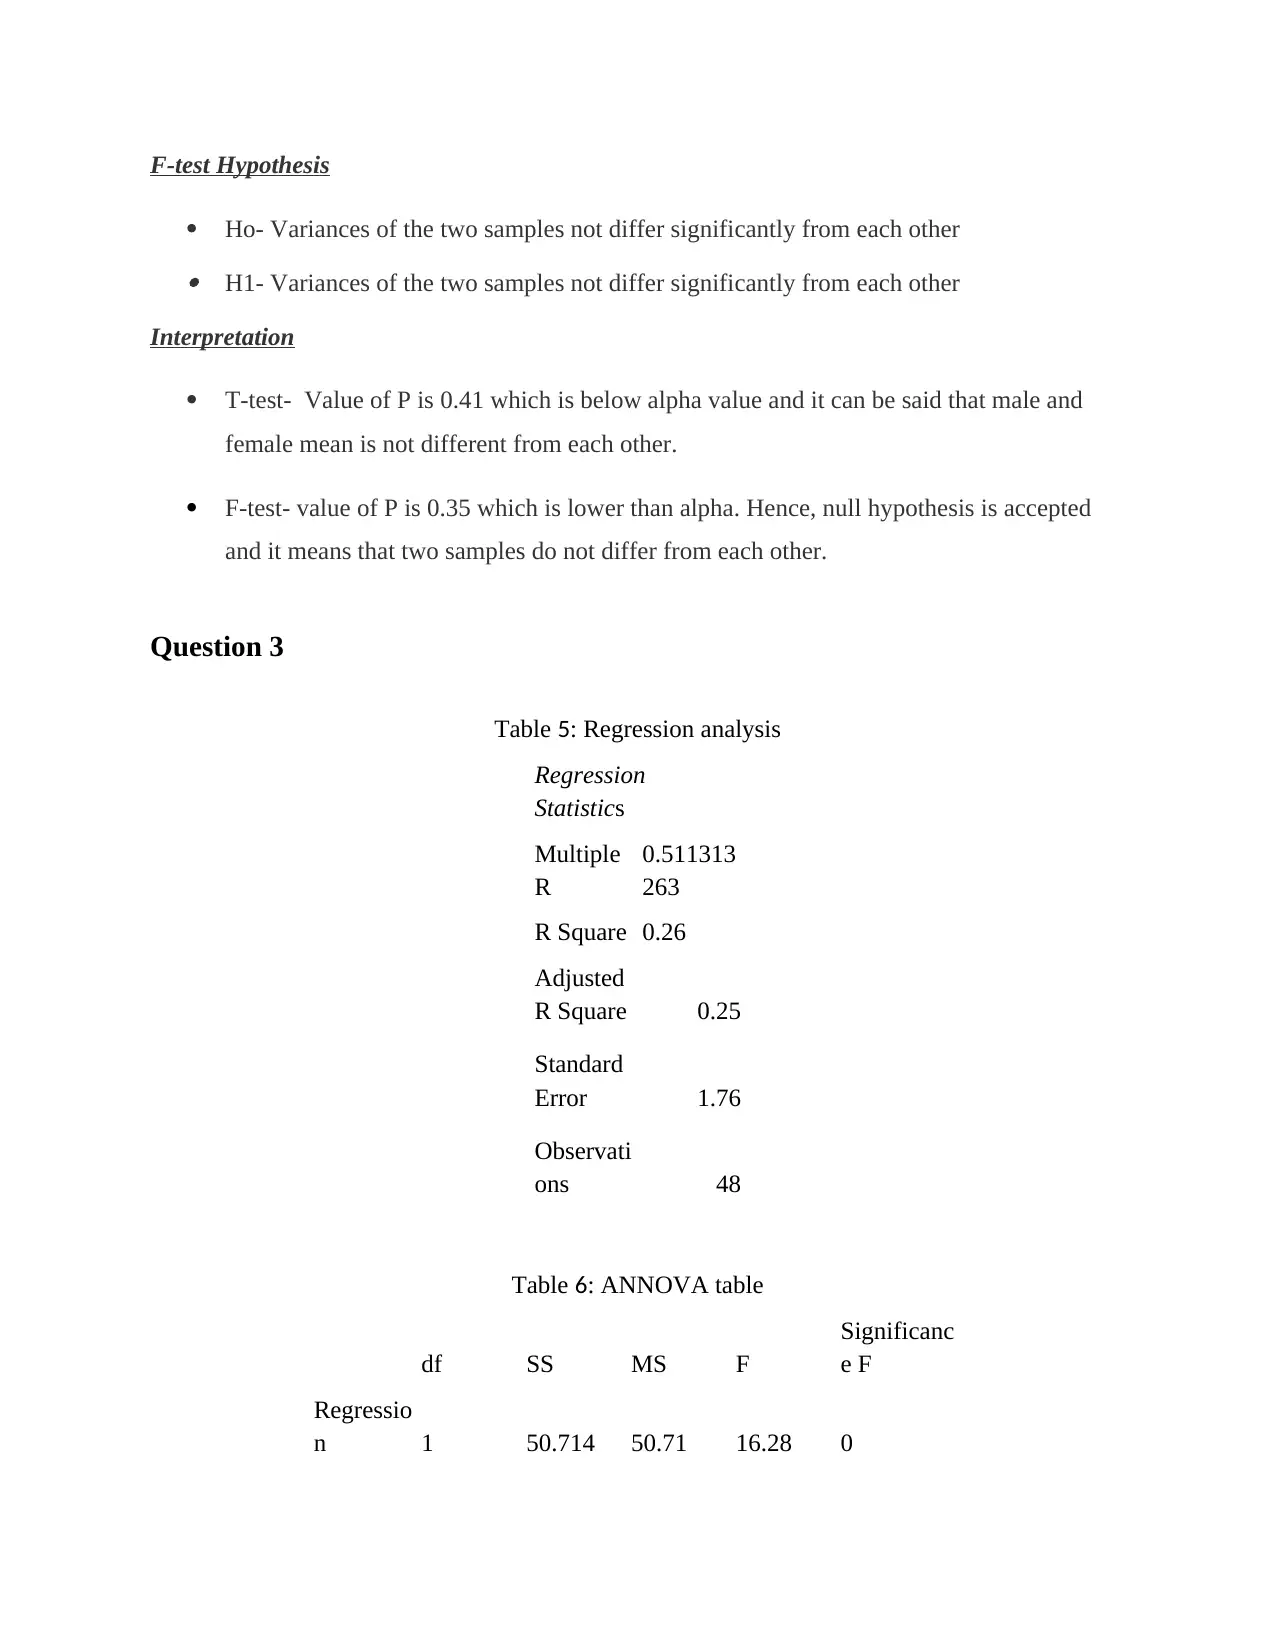
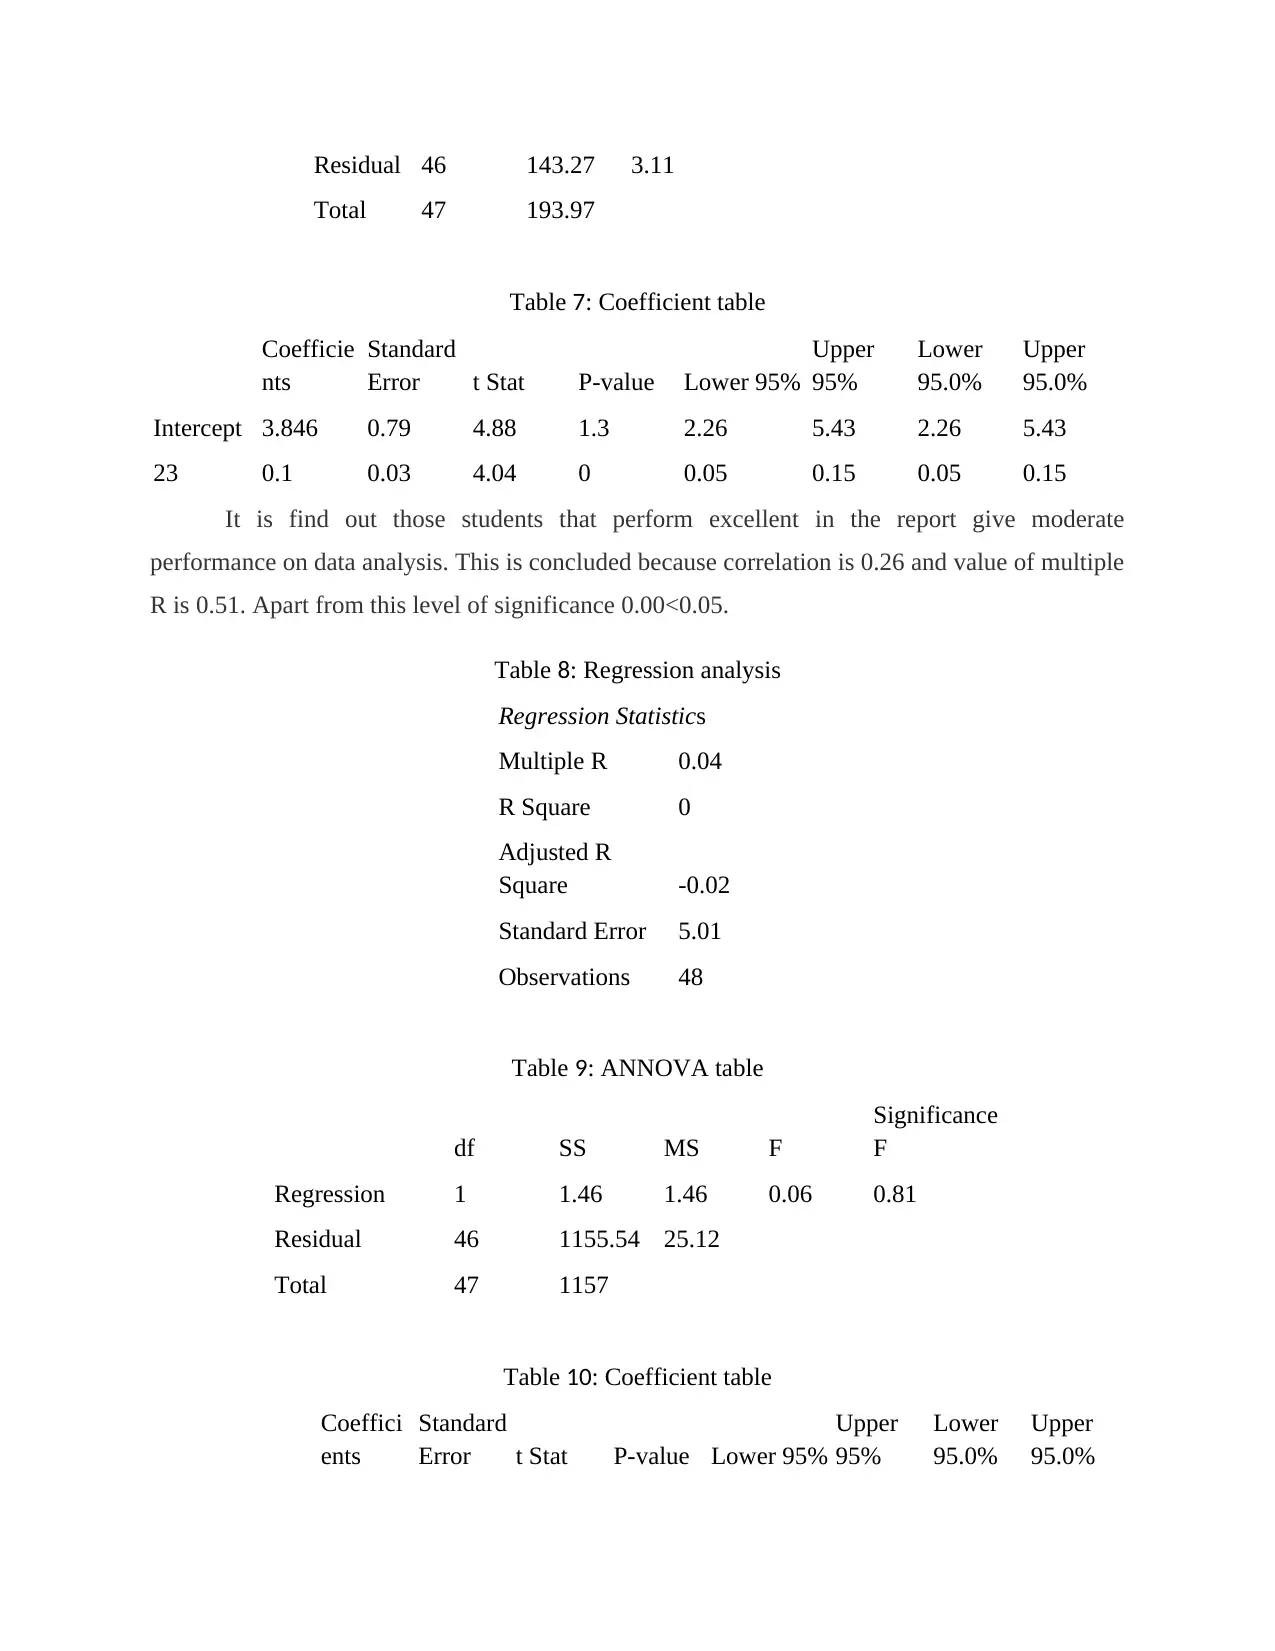
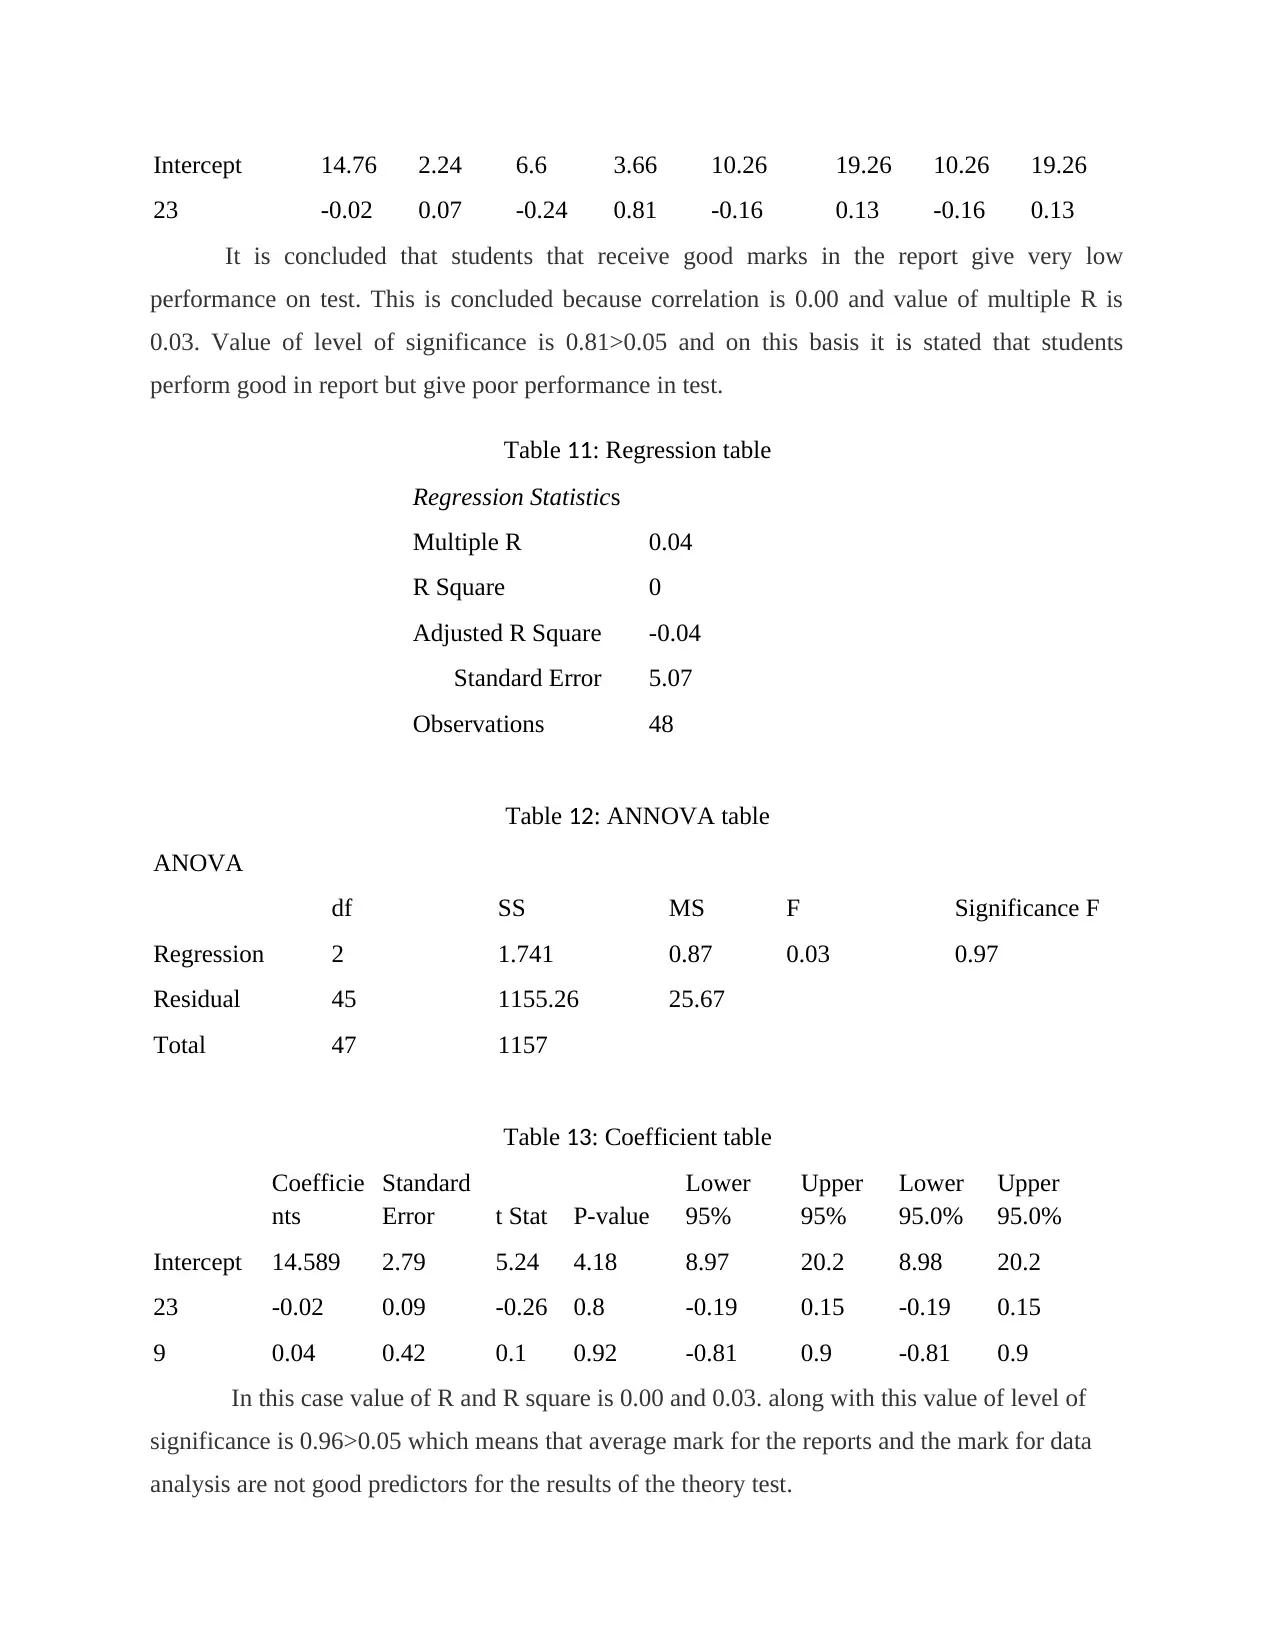
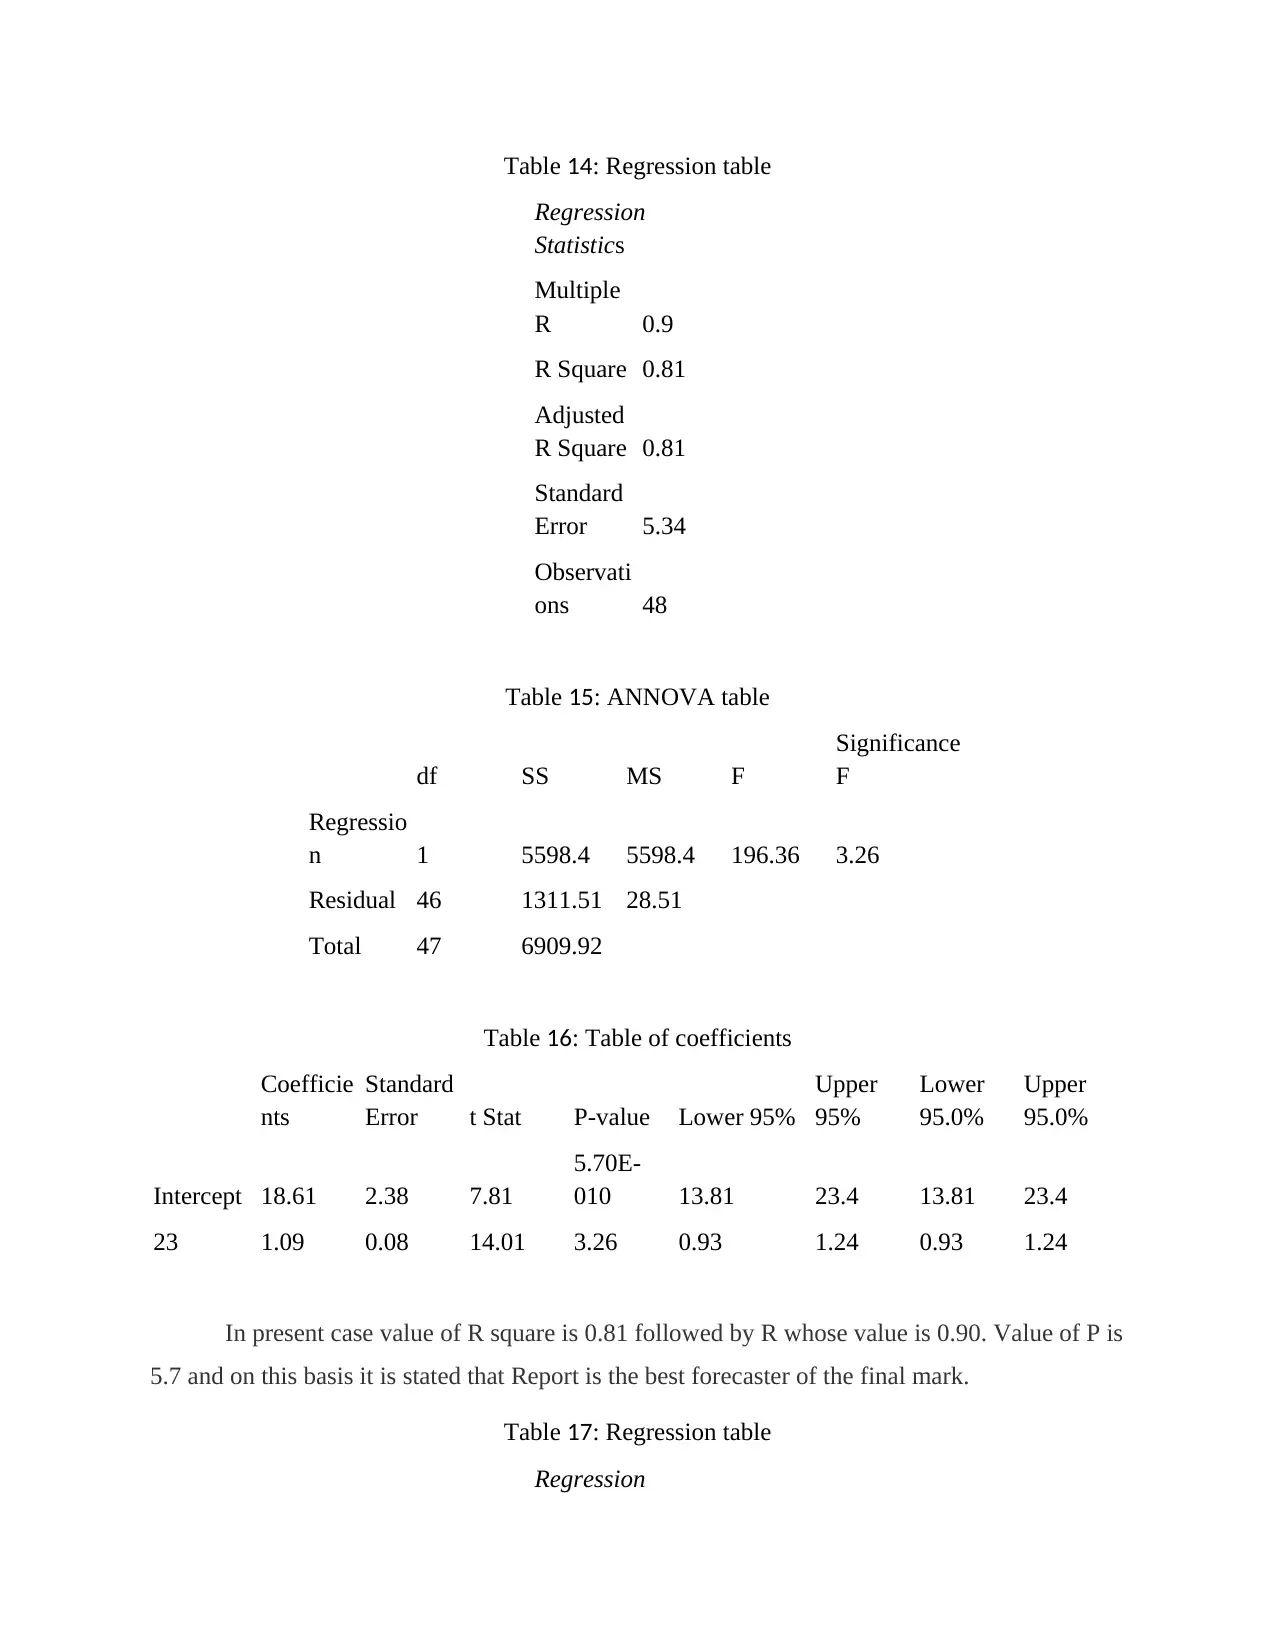
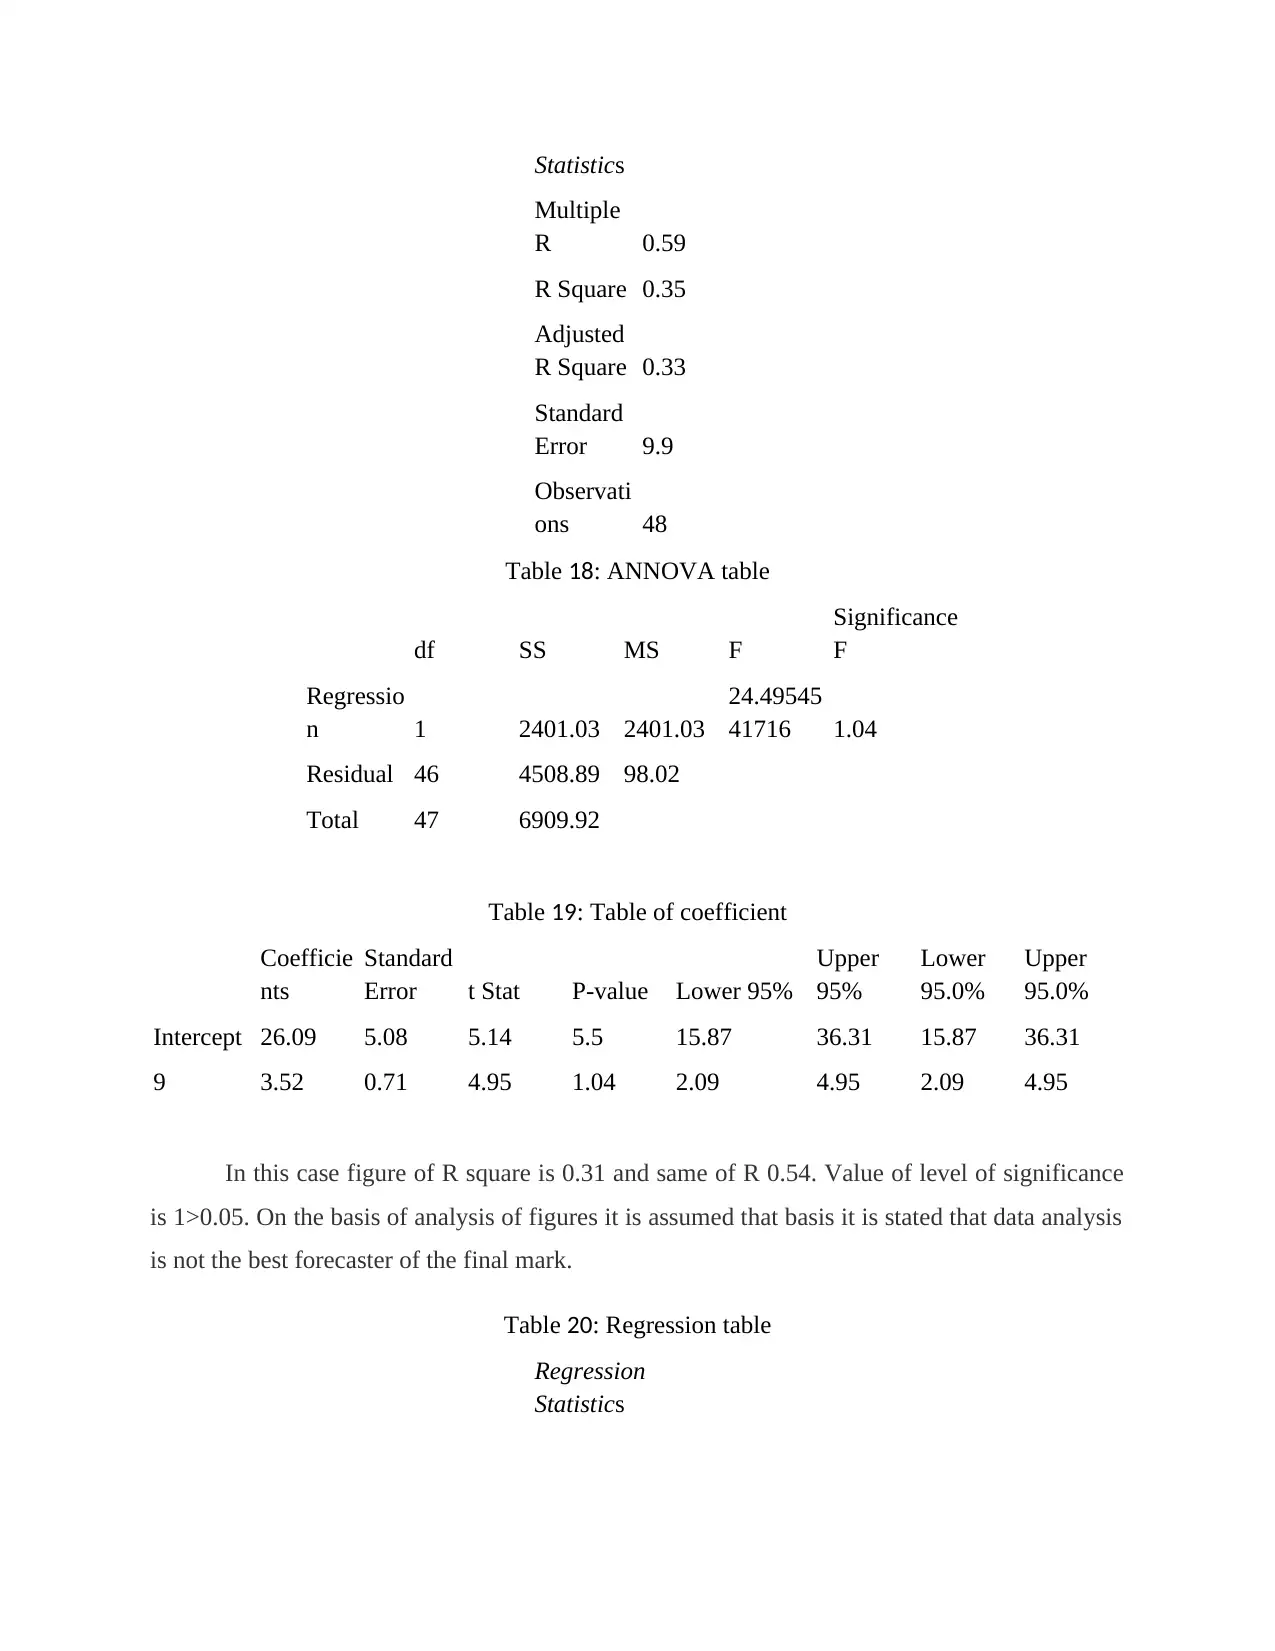
This Excel project presents a comprehensive data analysis, encompassing descriptive statistics, t-tests, F-tests, and regression analysis. The project begins with calculating descriptive statistics such as mean, median, and mode, along with variance and standard deviation. It then delves into t-tests and F-tests to compare the means and variances of two samples, respectively. The project utilizes regression analysis to determine the relationships between different variables, including the correlation between report performance, data analysis results, and theory test scores. ANOVA tables are used to analyze the variance between different groups. The project concludes with an analysis of variance (ANOVA) to assess the significance of differences in marks obtained from different reports. The project provides detailed tables and interpretations of the statistical results, offering insights into the relationships between various data points. This project offers a practical application of statistical techniques using Excel, making it a valuable resource for students.


1 out of 13
Related Documents


Your All-in-One AI-Powered Toolkit for Academic Success.
+13062052269
info@desklib.com
Available 24*7 on WhatsApp / Email
![[object Object]](/_next/static/media/star-bottom.7253800d.svg)
Copyright © 2020–2026 A2Z Services. All Rights Reserved. Developed and managed by ZUCOL.