Capital Budgeting and Replacement Analysis for Saturn Petcare Report
VerifiedAdded on 2023/06/04
|7
|1308
|310
Report
AI Summary
This report provides a detailed financial analysis of Saturn Petcare's proposed new manufacturing unit, focusing on capital budgeting techniques. The analysis includes a comprehensive assessment of the initial investment, operational cash flows, and various financial metrics such as Net Present Value (NPV), payback period, and Profitability Index. The report evaluates the project's financial viability under normal production conditions and considers sensitivity analyses by examining scenarios with 5% higher and lower sales volumes. Additionally, the report assesses a replacement option, comparing two alternatives using a risk-adjusted rate and calculating the Net Present Value for each option to determine the most profitable choice for the business. The conclusion emphasizes the importance of cost control for the project's success and recommends the best replacement option based on NPV.

Running head: ACCOUNTING AND FINANCE
Accounting and Finance
Name of the Student:
Name of the University:
Author’s Note:
Accounting and Finance
Name of the Student:
Name of the University:
Author’s Note:
Paraphrase This Document
Need a fresh take? Get an instant paraphrase of this document with our AI Paraphraser

ACCOUNTING AND FINANCE
ACCOUNTING AND FINANCE
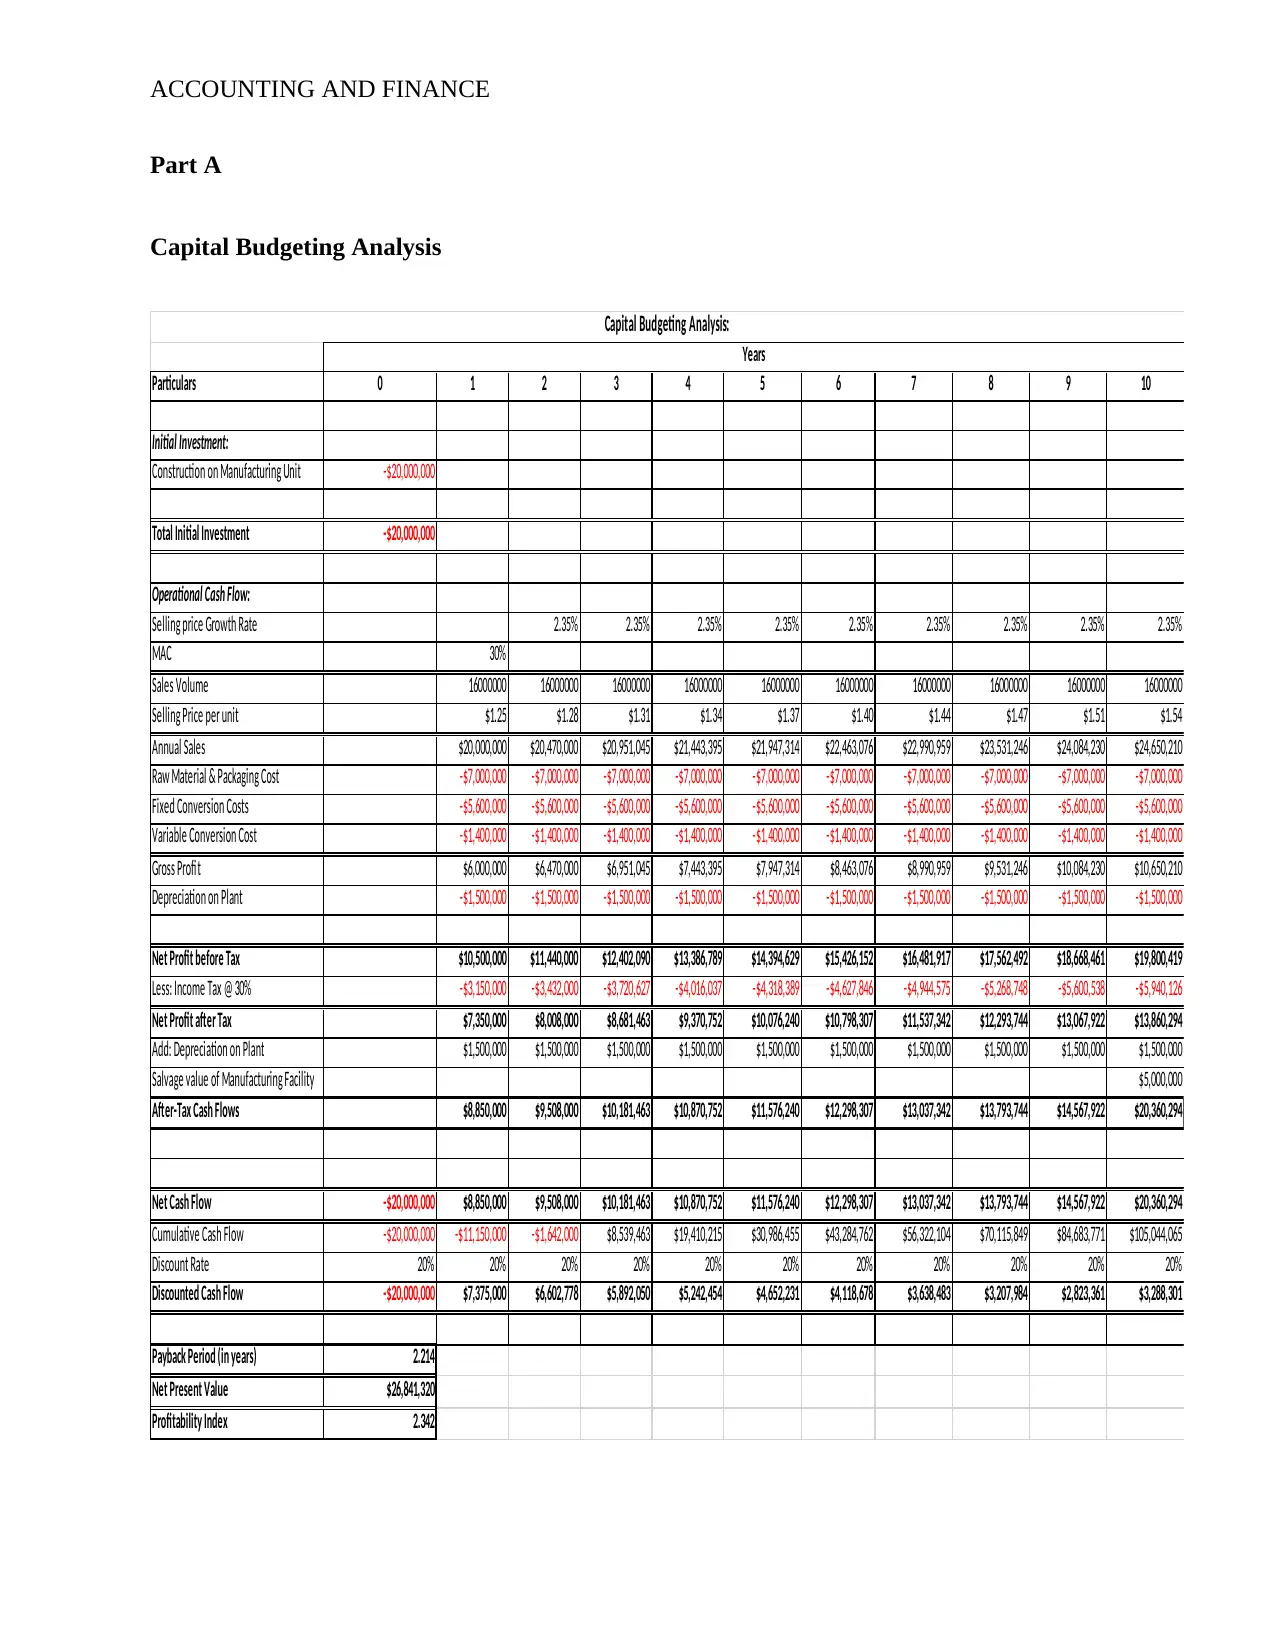
Part A
Capital Budgeting Analysis
Particulars 0 1 2 3 4 5 6 7 8 9 10
Initial Investment:
Construction on Manufacturing Unit -$20,000,000
Total Initial Investment -$20,000,000
Operational Cash Flow:
Selling price Growth Rate 2.35% 2.35% 2.35% 2.35% 2.35% 2.35% 2.35% 2.35% 2.35%
MAC 30%
Sales Volume 16000000 16000000 16000000 16000000 16000000 16000000 16000000 16000000 16000000 16000000
Selling Price per unit $1.25 $1.28 $1.31 $1.34 $1.37 $1.40 $1.44 $1.47 $1.51 $1.54
Annual Sales $20,000,000 $20,470,000 $20,951,045 $21,443,395 $21,947,314 $22,463,076 $22,990,959 $23,531,246 $24,084,230 $24,650,210
Raw Material & Packaging Cost -$7,000,000 -$7,000,000 -$7,000,000 -$7,000,000 -$7,000,000 -$7,000,000 -$7,000,000 -$7,000,000 -$7,000,000 -$7,000,000
Fixed Conversion Costs -$5,600,000 -$5,600,000 -$5,600,000 -$5,600,000 -$5,600,000 -$5,600,000 -$5,600,000 -$5,600,000 -$5,600,000 -$5,600,000
Variable Conversion Cost -$1,400,000 -$1,400,000 -$1,400,000 -$1,400,000 -$1,400,000 -$1,400,000 -$1,400,000 -$1,400,000 -$1,400,000 -$1,400,000
Gross Profit $6,000,000 $6,470,000 $6,951,045 $7,443,395 $7,947,314 $8,463,076 $8,990,959 $9,531,246 $10,084,230 $10,650,210
Depreciation on Plant -$1,500,000 -$1,500,000 -$1,500,000 -$1,500,000 -$1,500,000 -$1,500,000 -$1,500,000 -$1,500,000 -$1,500,000 -$1,500,000
Net Profit before Tax $10,500,000 $11,440,000 $12,402,090 $13,386,789 $14,394,629 $15,426,152 $16,481,917 $17,562,492 $18,668,461 $19,800,419
Less: Income Tax @ 30% -$3,150,000 -$3,432,000 -$3,720,627 -$4,016,037 -$4,318,389 -$4,627,846 -$4,944,575 -$5,268,748 -$5,600,538 -$5,940,126
Net Profit after Tax $7,350,000 $8,008,000 $8,681,463 $9,370,752 $10,076,240 $10,798,307 $11,537,342 $12,293,744 $13,067,922 $13,860,294
Add: Depreciation on Plant $1,500,000 $1,500,000 $1,500,000 $1,500,000 $1,500,000 $1,500,000 $1,500,000 $1,500,000 $1,500,000 $1,500,000
Salvage value of Manufacturing Facility $5,000,000
After-Tax Cash Flows $8,850,000 $9,508,000 $10,181,463 $10,870,752 $11,576,240 $12,298,307 $13,037,342 $13,793,744 $14,567,922 $20,360,294
Net Cash Flow -$20,000,000 $8,850,000 $9,508,000 $10,181,463 $10,870,752 $11,576,240 $12,298,307 $13,037,342 $13,793,744 $14,567,922 $20,360,294
Cumulative Cash Flow -$20,000,000 -$11,150,000 -$1,642,000 $8,539,463 $19,410,215 $30,986,455 $43,284,762 $56,322,104 $70,115,849 $84,683,771 $105,044,065
Discount Rate 20% 20% 20% 20% 20% 20% 20% 20% 20% 20% 20%
Discounted Cash Flow -$20,000,000 $7,375,000 $6,602,778 $5,892,050 $5,242,454 $4,652,231 $4,118,678 $3,638,483 $3,207,984 $2,823,361 $3,288,301
Payback Period (in years) 2.214
Net Present Value $26,841,320
Profitability Index 2.342
Years
Capital Budgeting Analysis:
⊘ This is a preview!⊘
Do you want full access?
Subscribe today to unlock all pages.
Trusted by 1+ million students worldwide

ACCOUNTING AND FINANCE
Scenario Summary
Current Values: 5% Higher Sales 5% Lower Sales
Changing Cells:
Sales Volume 16000000 16800000 15200000
Fixed Conversion Cost -5600000 -5600000 -5600000
Result Cells:
Payback Period 2.214 2.131 2.306
Net Present Value $26,841,320 $29,048,679 $24,633,961
Profitability Index 2.342 2.452 2.232
The management of Saturn Petcare ltd plans to implement a policy whereby the
management can improve the sales of the business and thereby increase the revenue of the
business. The management wants to introduce a new manufacturing unit which will be producing
new dog wet food products.
The sales volume which the management anticipates to produce on a yearly basis is
around 16,000,000 cans for which the NPV, Payback period and Profitability Index of the
project. The decision of the management is to be analyzed considering the investment appraisal
techniques which are used by the business (Bianchini et al., 2016). The management will also be
considering the what if situation wherein if the product is over produced by 5% or where the
product is under produced by 5%. The total investment of the project is shown to be $
20,000,000 and the net present value of the project under normal production conditions is $
26,841,320 which is favorable and so is the profitability index and payback period analysis
(Brewer & Stout, 2014). The NPV of the project under 5% less production capacity is shown to
be $ 23,317,179 which is also shown to be favorable for the business during the period. The
surplus production of the business in case of 5% more production is shown to be $ 30,365,462.
Paraphrase This Document
Need a fresh take? Get an instant paraphrase of this document with our AI Paraphraser

ACCOUNTING AND FINANCE
The only concern for the business is the costs factor which is to be considered for the
project and the same needs to be controlled by the management of the business during the period.
Replacement Option
Year Option A Option B
0 -$475,000 -$475,000
1 $100,000 $80,000
2 $100,000 $80,000
3 $100,000 $80,000
4 $100,000 $80,000
5 $100,000 $80,000
6 $100,000 $80,000
7 $80,000
8 $80,000
9 $80,000
Risk Adjusted Rate 6% 6%
Net Present Value $ 15,785.31 $ 65,222.06

ACCOUNTING AND FINANCE
Year Cash Outflow Cash Inflow Net Cash Flow Cash Outflow Cash Inflow Net Cash Flow
0 -$475,000 -$475,000 -$475,000 -$475,000
1 $100,000 $100,000 $80,000 $80,000
2 $100,000 $100,000 $80,000 $80,000
3 $100,000 $100,000 $80,000 $80,000
4 $100,000 $100,000 $80,000 $80,000
5 $100,000 $100,000 $80,000 $80,000
6 -$475,000 $100,000 -$375,000 $80,000 $80,000
7 $100,000 $100,000 $80,000 $80,000
8 $100,000 $100,000 $80,000 $80,000
9 $100,000 $100,000 -$475,000 $80,000 -$395,000
10 $100,000 $100,000 $80,000 $80,000
11 $100,000 $100,000 $80,000 $80,000
12 -$475,000 $100,000 -$375,000 $80,000 $80,000
13 $100,000 $100,000 $80,000 $80,000
14 $100,000 $100,000 $80,000 $80,000
15 $100,000 $100,000 $80,000 $80,000
16 $100,000 $100,000 $80,000 $80,000
17 $100,000 $100,000 $80,000 $80,000
18 $100,000 $100,000 $80,000 $80,000
Risk Adjusted Rate 6% 6%
Adjusted Net Present Value $ 34,758.15 $ 103,826.89
Option A Option A
The management of the business needs to select Option B for the purpose of replacement
as the same option provides the business with maximum NPV which also signifies that Option B
will be more profitable for the business.
⊘ This is a preview!⊘
Do you want full access?
Subscribe today to unlock all pages.
Trusted by 1+ million students worldwide

ACCOUNTING AND FINANCE
Reference
Bianchini, A., Gambuti, M., Pellegrini, M., & Saccani, C. (2016). Performance analysis and
economic assessment of different photovoltaic technologies based on experimental
measurements. Renewable Energy, 85, 1-11.
Brewer, P. C., & Stout, D. E. (2014). The future of accounting education: Addressing the
competency crisis. Strategic Finance, 96(2), 29.
1 out of 7