ACC701 - Capital Budgeting Techniques for Investment Appraisal
VerifiedAdded on 2023/06/15
|11
|2353
|295
Homework Assignment
AI Summary
This assignment provides a detailed appraisal of capital investments using various techniques such as Net Present Value (NPV), Internal Rate of Return (IRR), Payback Period, and Annual Rate of Return (ARR). It analyzes two investment options for Noothercompany Limited, evaluating their financial viability and recommending the most suitable choice based on the calculated metrics. The assignment also discusses the importance of sensitivity analysis in capital budgeting, highlighting key variables that should be sensitized due to the fluctuating cash flows. Furthermore, it examines the Return on Investment (ROI) and Residual Income (RI) of two divisions, Queensland (QLD) and New South Wales (NSW), providing a comparative analysis of their performance and discussing the strengths and weaknesses of each measure. Finally, the assignment includes a profit and loss budget for Last Chance Group Limited over five years, applying discounted cash flow techniques to determine the project's NPV and IRR, and concludes with a discussion of the advantages and disadvantages of budgeting.

Running Head: Appraisal of Capital Investments
Capital Budgeting Techniques
Capital Budgeting Techniques
Paraphrase This Document
Need a fresh take? Get an instant paraphrase of this document with our AI Paraphraser
Appraisal of Capital Investments 1
Question 1:
Part a)
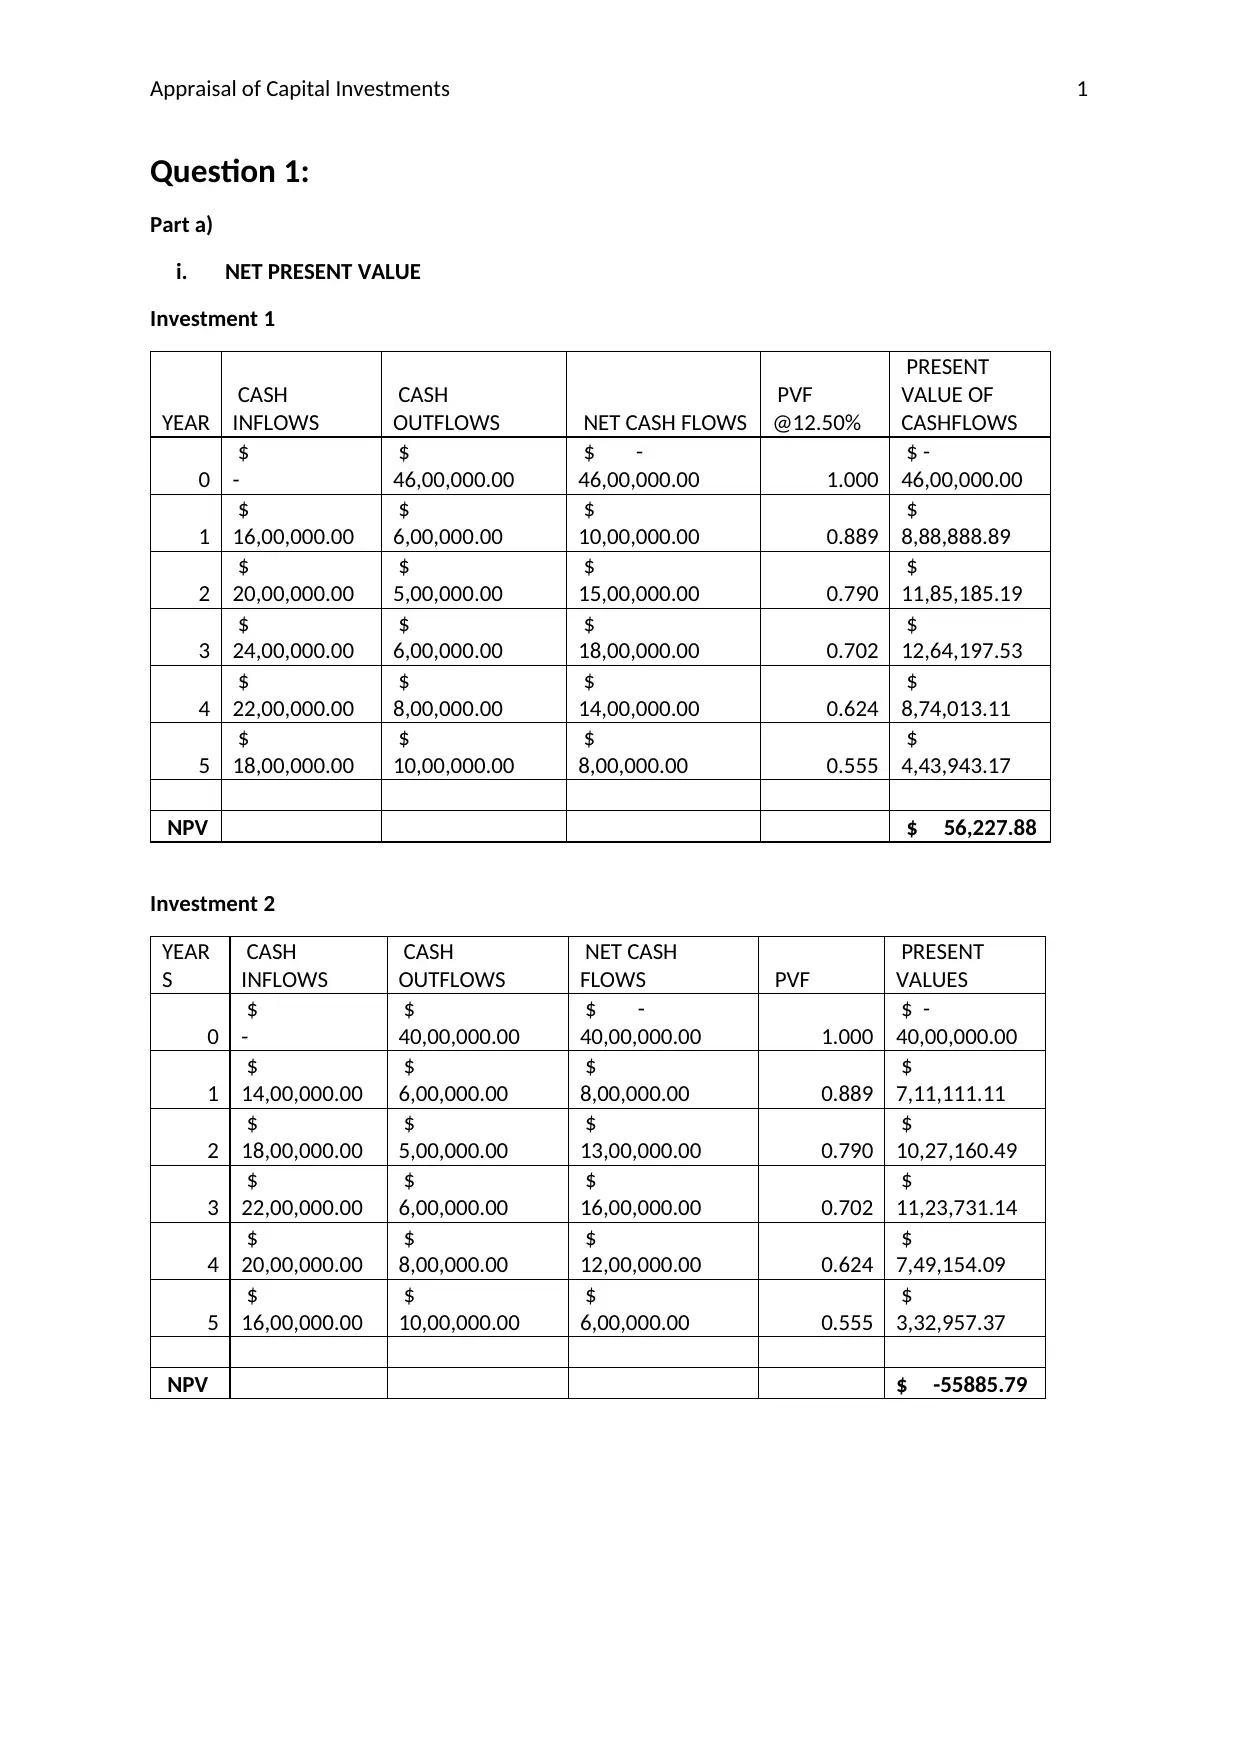
i. NET PRESENT VALUE
Investment 1
YEAR
CASH
INFLOWS
CASH
OUTFLOWS NET CASH FLOWS
PVF
@12.50%
PRESENT
VALUE OF
CASHFLOWS
0
$
-
$
46,00,000.00
$ -
46,00,000.00 1.000
$ -
46,00,000.00
1
$
16,00,000.00
$
6,00,000.00
$
10,00,000.00 0.889
$
8,88,888.89
2
$
20,00,000.00
$
5,00,000.00
$
15,00,000.00 0.790
$
11,85,185.19
3
$
24,00,000.00
$
6,00,000.00
$
18,00,000.00 0.702
$
12,64,197.53
4
$
22,00,000.00
$
8,00,000.00
$
14,00,000.00 0.624
$
8,74,013.11
5
$
18,00,000.00
$
10,00,000.00
$
8,00,000.00 0.555
$
4,43,943.17
NPV $ 56,227.88
Investment 2
YEAR
S
CASH
INFLOWS
CASH
OUTFLOWS
NET CASH
FLOWS PVF
PRESENT
VALUES
0
$
-
$
40,00,000.00
$ -
40,00,000.00 1.000
$ -
40,00,000.00
1
$
14,00,000.00
$
6,00,000.00
$
8,00,000.00 0.889
$
7,11,111.11
2
$
18,00,000.00
$
5,00,000.00
$
13,00,000.00 0.790
$
10,27,160.49
3
$
22,00,000.00
$
6,00,000.00
$
16,00,000.00 0.702
$
11,23,731.14
4
$
20,00,000.00
$
8,00,000.00
$
12,00,000.00 0.624
$
7,49,154.09
5
$
16,00,000.00
$
10,00,000.00
$
6,00,000.00 0.555
$
3,32,957.37
NPV $ -55885.79
Question 1:
Part a)
i. NET PRESENT VALUE
Investment 1
YEAR
CASH
INFLOWS
CASH
OUTFLOWS NET CASH FLOWS
PVF
@12.50%
PRESENT
VALUE OF
CASHFLOWS
0
$
-
$
46,00,000.00
$ -
46,00,000.00 1.000
$ -
46,00,000.00
1
$
16,00,000.00
$
6,00,000.00
$
10,00,000.00 0.889
$
8,88,888.89
2
$
20,00,000.00
$
5,00,000.00
$
15,00,000.00 0.790
$
11,85,185.19
3
$
24,00,000.00
$
6,00,000.00
$
18,00,000.00 0.702
$
12,64,197.53
4
$
22,00,000.00
$
8,00,000.00
$
14,00,000.00 0.624
$
8,74,013.11
5
$
18,00,000.00
$
10,00,000.00
$
8,00,000.00 0.555
$
4,43,943.17
NPV $ 56,227.88
Investment 2
YEAR
S
CASH
INFLOWS
CASH
OUTFLOWS
NET CASH
FLOWS PVF
PRESENT
VALUES
0
$
-
$
40,00,000.00
$ -
40,00,000.00 1.000
$ -
40,00,000.00
1
$
14,00,000.00
$
6,00,000.00
$
8,00,000.00 0.889
$
7,11,111.11
2
$
18,00,000.00
$
5,00,000.00
$
13,00,000.00 0.790
$
10,27,160.49
3
$
22,00,000.00
$
6,00,000.00
$
16,00,000.00 0.702
$
11,23,731.14
4
$
20,00,000.00
$
8,00,000.00
$
12,00,000.00 0.624
$
7,49,154.09
5
$
16,00,000.00
$
10,00,000.00
$
6,00,000.00 0.555
$
3,32,957.37
NPV $ -55885.79
Appraisal of Capital Investments 2
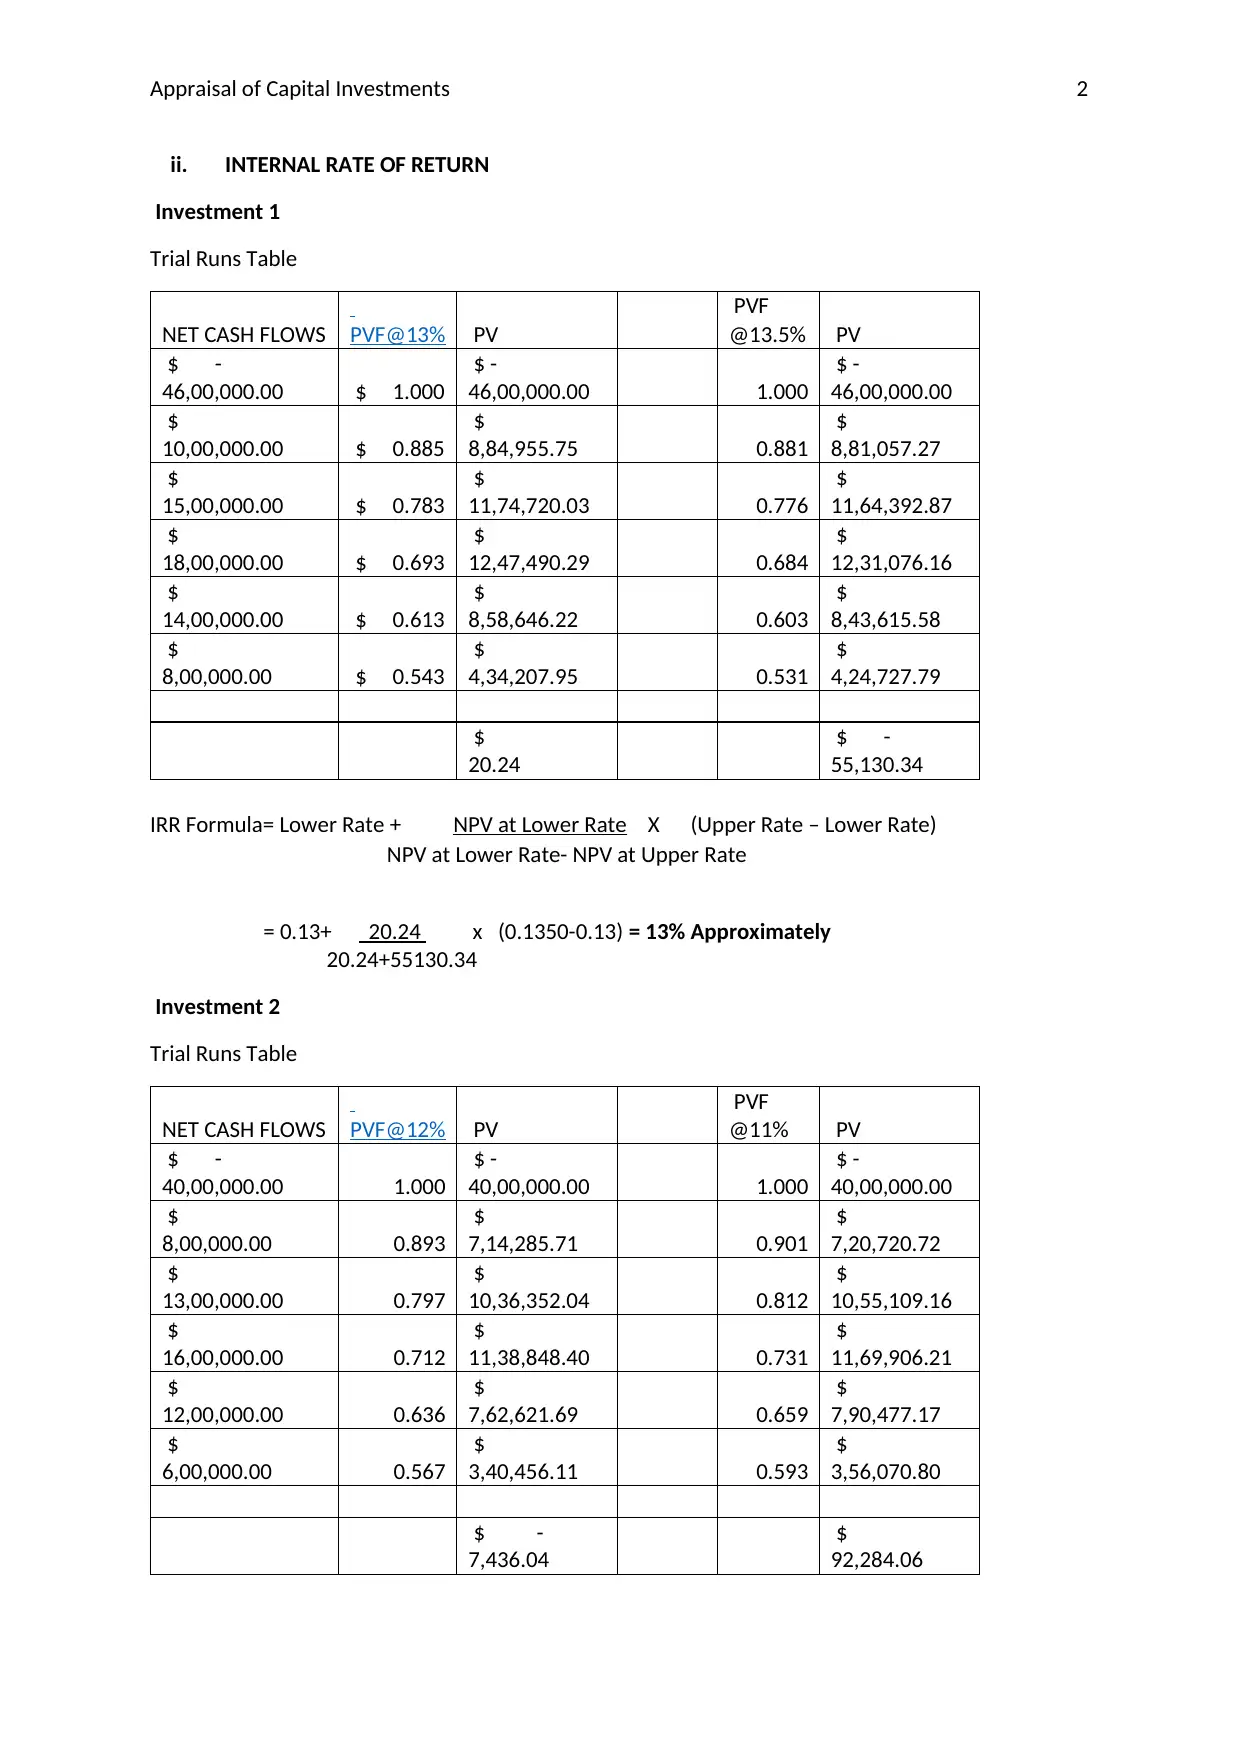
ii. INTERNAL RATE OF RETURN
Investment 1
Trial Runs Table
NET CASH FLOWS PVF@13% PV
PVF
@13.5% PV
$ -
46,00,000.00 $ 1.000
$ -
46,00,000.00 1.000
$ -
46,00,000.00
$
10,00,000.00 $ 0.885
$
8,84,955.75 0.881
$
8,81,057.27
$
15,00,000.00 $ 0.783
$
11,74,720.03 0.776
$
11,64,392.87
$
18,00,000.00 $ 0.693
$
12,47,490.29 0.684
$
12,31,076.16
$
14,00,000.00 $ 0.613
$
8,58,646.22 0.603
$
8,43,615.58
$
8,00,000.00 $ 0.543
$
4,34,207.95 0.531
$
4,24,727.79
$
20.24
$ -
55,130.34
IRR Formula= Lower Rate + NPV at Lower Rate X (Upper Rate – Lower Rate)
NPV at Lower Rate- NPV at Upper Rate
= 0.13+ 20.24 x (0.1350-0.13) = 13% Approximately
20.24+55130.34
Investment 2
Trial Runs Table
NET CASH FLOWS PVF@12% PV
PVF
@11% PV
$ -
40,00,000.00 1.000
$ -
40,00,000.00 1.000
$ -
40,00,000.00
$
8,00,000.00 0.893
$
7,14,285.71 0.901
$
7,20,720.72
$
13,00,000.00 0.797
$
10,36,352.04 0.812
$
10,55,109.16
$
16,00,000.00 0.712
$
11,38,848.40 0.731
$
11,69,906.21
$
12,00,000.00 0.636
$
7,62,621.69 0.659
$
7,90,477.17
$
6,00,000.00 0.567
$
3,40,456.11 0.593
$
3,56,070.80
$ -
7,436.04
$
92,284.06
⊘ This is a preview!⊘
Do you want full access?
Subscribe today to unlock all pages.
Trusted by 1+ million students worldwide
Appraisal of Capital Investments 3
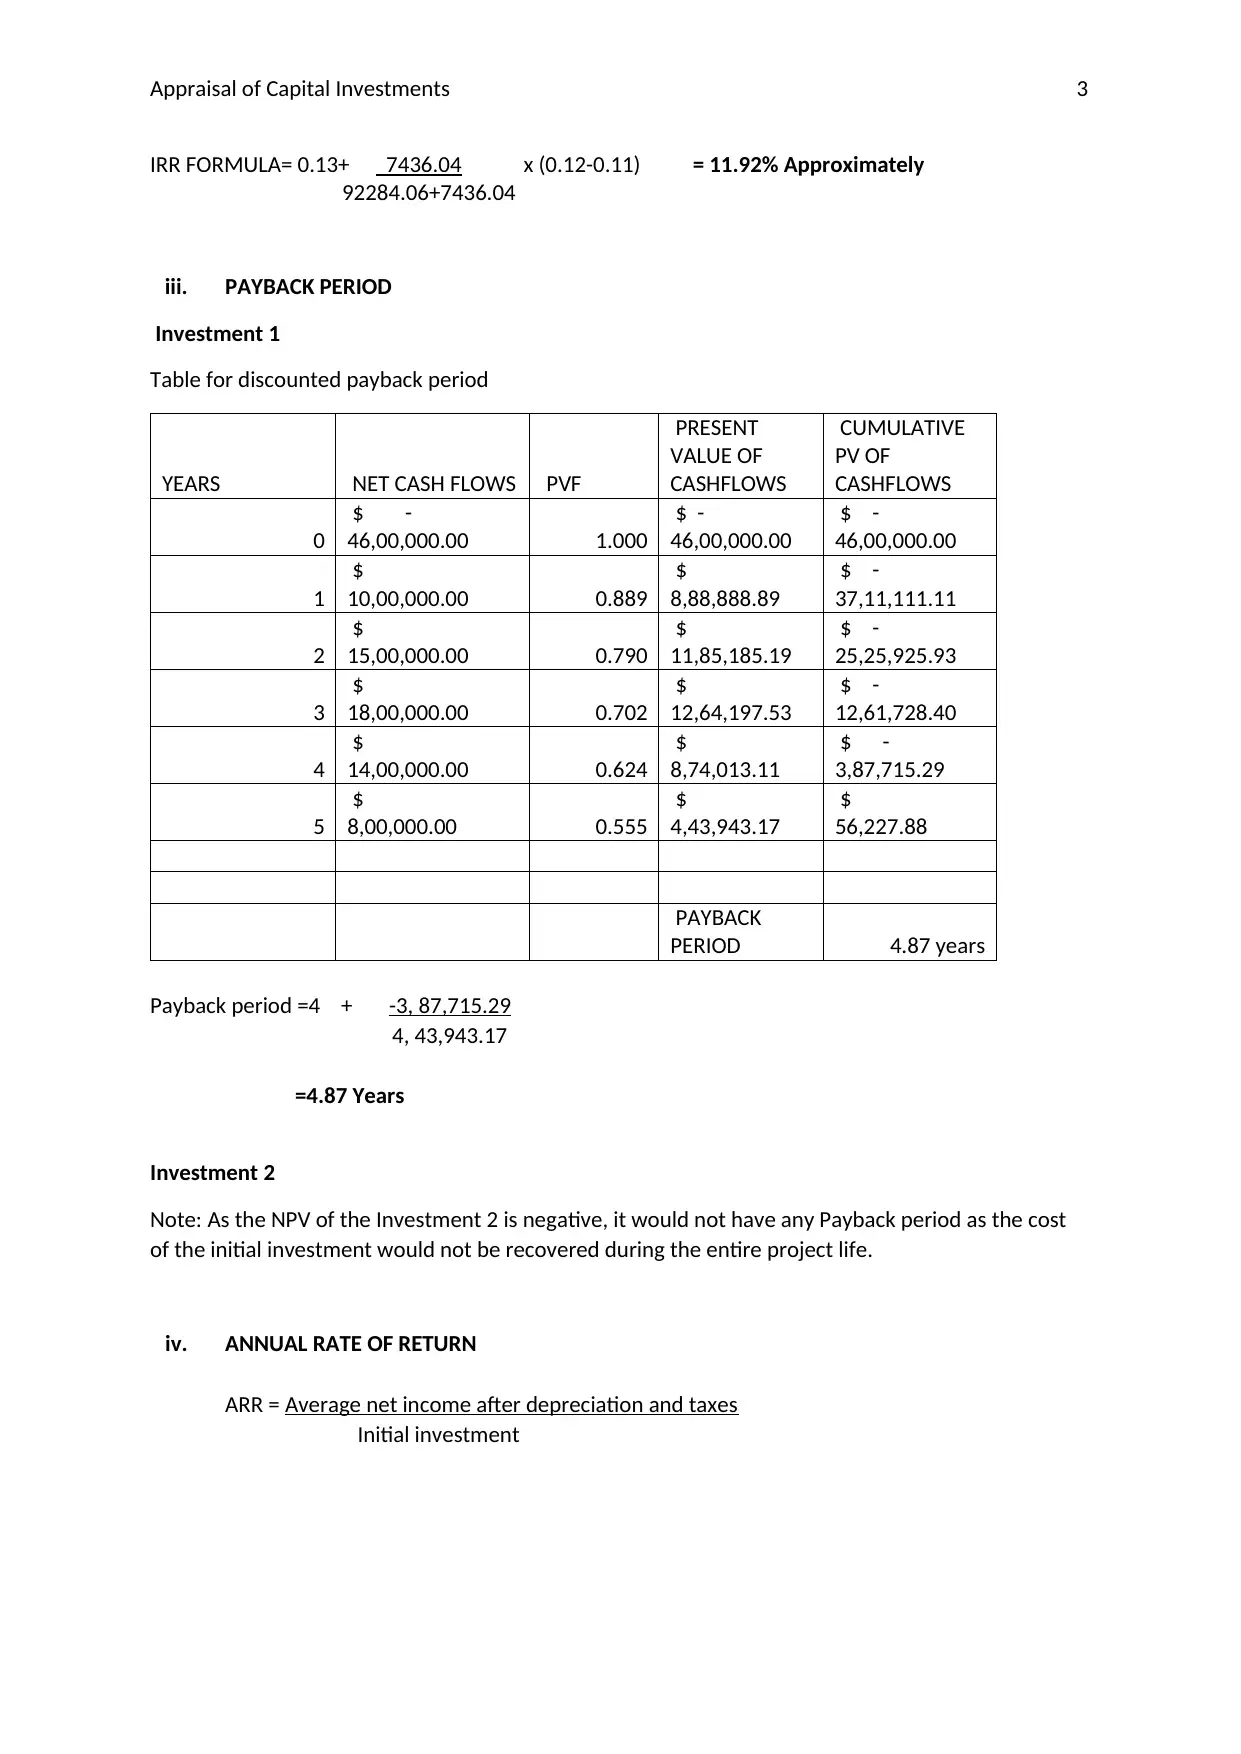
IRR FORMULA= 0.13+ 7436.04 x (0.12-0.11) = 11.92% Approximately
92284.06+7436.04
iii. PAYBACK PERIOD
Investment 1
Table for discounted payback period
YEARS NET CASH FLOWS PVF
PRESENT
VALUE OF
CASHFLOWS
CUMULATIVE
PV OF
CASHFLOWS
0
$ -
46,00,000.00 1.000
$ -
46,00,000.00
$ -
46,00,000.00
1
$
10,00,000.00 0.889
$
8,88,888.89
$ -
37,11,111.11
2
$
15,00,000.00 0.790
$
11,85,185.19
$ -
25,25,925.93
3
$
18,00,000.00 0.702
$
12,64,197.53
$ -
12,61,728.40
4
$
14,00,000.00 0.624
$
8,74,013.11
$ -
3,87,715.29
5
$
8,00,000.00 0.555
$
4,43,943.17
$
56,227.88
PAYBACK
PERIOD 4.87 years
Payback period =4 + -3, 87,715.29
4, 43,943.17
=4.87 Years
Investment 2
Note: As the NPV of the Investment 2 is negative, it would not have any Payback period as the cost
of the initial investment would not be recovered during the entire project life.
iv. ANNUAL RATE OF RETURN
ARR = Average net income after depreciation and taxes
Initial investment
Paraphrase This Document
Need a fresh take? Get an instant paraphrase of this document with our AI Paraphraser
Appraisal of Capital Investments 4
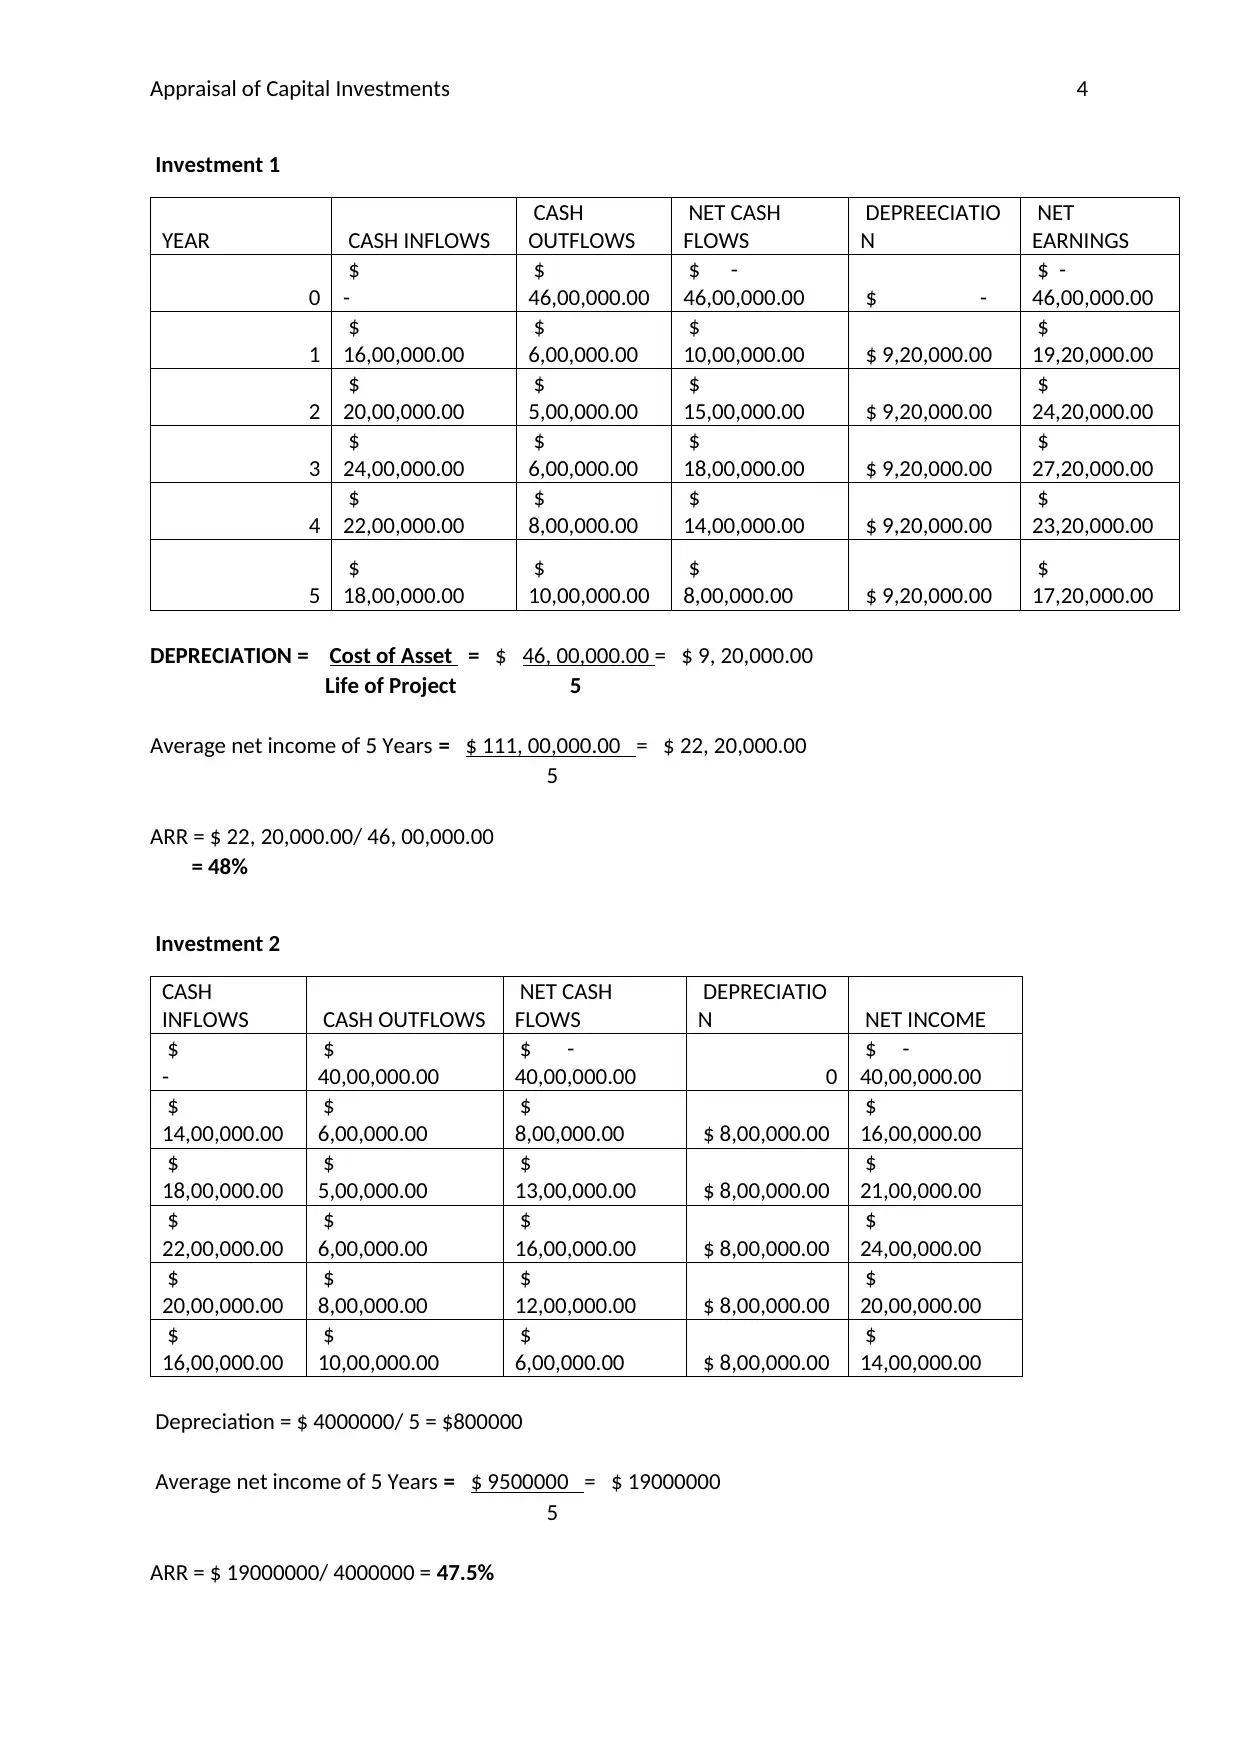
Investment 1
YEAR CASH INFLOWS
CASH
OUTFLOWS
NET CASH
FLOWS
DEPREECIATIO
N
NET
EARNINGS
0
$
-
$
46,00,000.00
$ -
46,00,000.00 $ -
$ -
46,00,000.00
1
$
16,00,000.00
$
6,00,000.00
$
10,00,000.00 $ 9,20,000.00
$
19,20,000.00
2
$
20,00,000.00
$
5,00,000.00
$
15,00,000.00 $ 9,20,000.00
$
24,20,000.00
3
$
24,00,000.00
$
6,00,000.00
$
18,00,000.00 $ 9,20,000.00
$
27,20,000.00
4
$
22,00,000.00
$
8,00,000.00
$
14,00,000.00 $ 9,20,000.00
$
23,20,000.00
5
$
18,00,000.00
$
10,00,000.00
$
8,00,000.00 $ 9,20,000.00
$
17,20,000.00
DEPRECIATION = Cost of Asset = $ 46, 00,000.00 = $ 9, 20,000.00
Life of Project 5
Average net income of 5 Years = $ 111, 00,000.00 = $ 22, 20,000.00
5
ARR = $ 22, 20,000.00/ 46, 00,000.00
= 48%
Investment 2
CASH
INFLOWS CASH OUTFLOWS
NET CASH
FLOWS
DEPRECIATIO
N NET INCOME
$
-
$
40,00,000.00
$ -
40,00,000.00 0
$ -
40,00,000.00
$
14,00,000.00
$
6,00,000.00
$
8,00,000.00 $ 8,00,000.00
$
16,00,000.00
$
18,00,000.00
$
5,00,000.00
$
13,00,000.00 $ 8,00,000.00
$
21,00,000.00
$
22,00,000.00
$
6,00,000.00
$
16,00,000.00 $ 8,00,000.00
$
24,00,000.00
$
20,00,000.00
$
8,00,000.00
$
12,00,000.00 $ 8,00,000.00
$
20,00,000.00
$
16,00,000.00
$
10,00,000.00
$
6,00,000.00 $ 8,00,000.00
$
14,00,000.00
Depreciation = $ 4000000/ 5 = $800000
Average net income of 5 Years = $ 9500000 = $ 19000000
5
ARR = $ 19000000/ 4000000 = 47.5%
Appraisal of Capital Investments 5
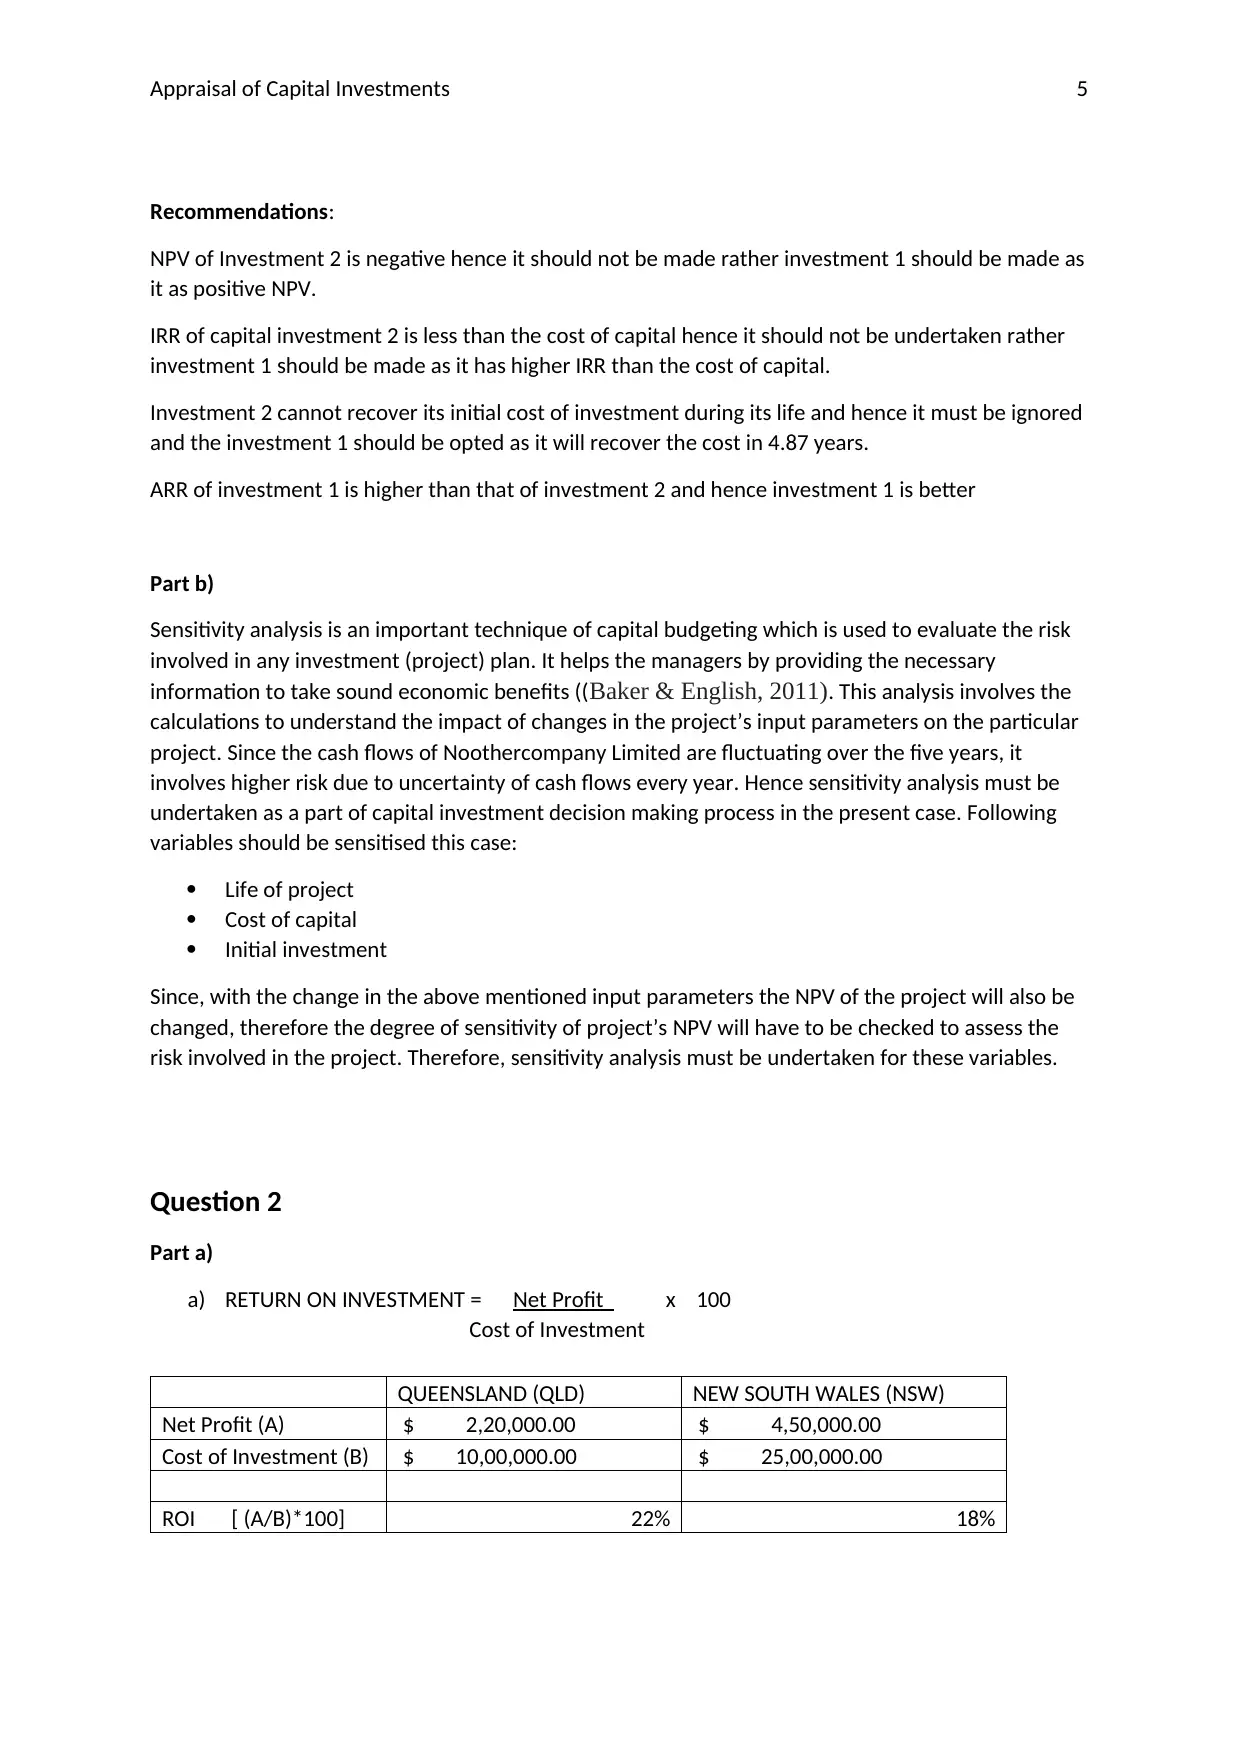
Recommendations:
NPV of Investment 2 is negative hence it should not be made rather investment 1 should be made as
it as positive NPV.
IRR of capital investment 2 is less than the cost of capital hence it should not be undertaken rather
investment 1 should be made as it has higher IRR than the cost of capital.
Investment 2 cannot recover its initial cost of investment during its life and hence it must be ignored
and the investment 1 should be opted as it will recover the cost in 4.87 years.
ARR of investment 1 is higher than that of investment 2 and hence investment 1 is better
Part b)
Sensitivity analysis is an important technique of capital budgeting which is used to evaluate the risk
involved in any investment (project) plan. It helps the managers by providing the necessary
information to take sound economic benefits ((Baker & English, 2011). This analysis involves the
calculations to understand the impact of changes in the project’s input parameters on the particular
project. Since the cash flows of Noothercompany Limited are fluctuating over the five years, it
involves higher risk due to uncertainty of cash flows every year. Hence sensitivity analysis must be
undertaken as a part of capital investment decision making process in the present case. Following
variables should be sensitised this case:
Life of project
Cost of capital
Initial investment
Since, with the change in the above mentioned input parameters the NPV of the project will also be
changed, therefore the degree of sensitivity of project’s NPV will have to be checked to assess the
risk involved in the project. Therefore, sensitivity analysis must be undertaken for these variables.
Question 2
Part a)
a) RETURN ON INVESTMENT = Net Profit x 100
Cost of Investment
QUEENSLAND (QLD) NEW SOUTH WALES (NSW)
Net Profit (A) $ 2,20,000.00 $ 4,50,000.00
Cost of Investment (B) $ 10,00,000.00 $ 25,00,000.00
ROI [ (A/B)*100] 22% 18%
⊘ This is a preview!⊘
Do you want full access?
Subscribe today to unlock all pages.
Trusted by 1+ million students worldwide
Appraisal of Capital Investments 6
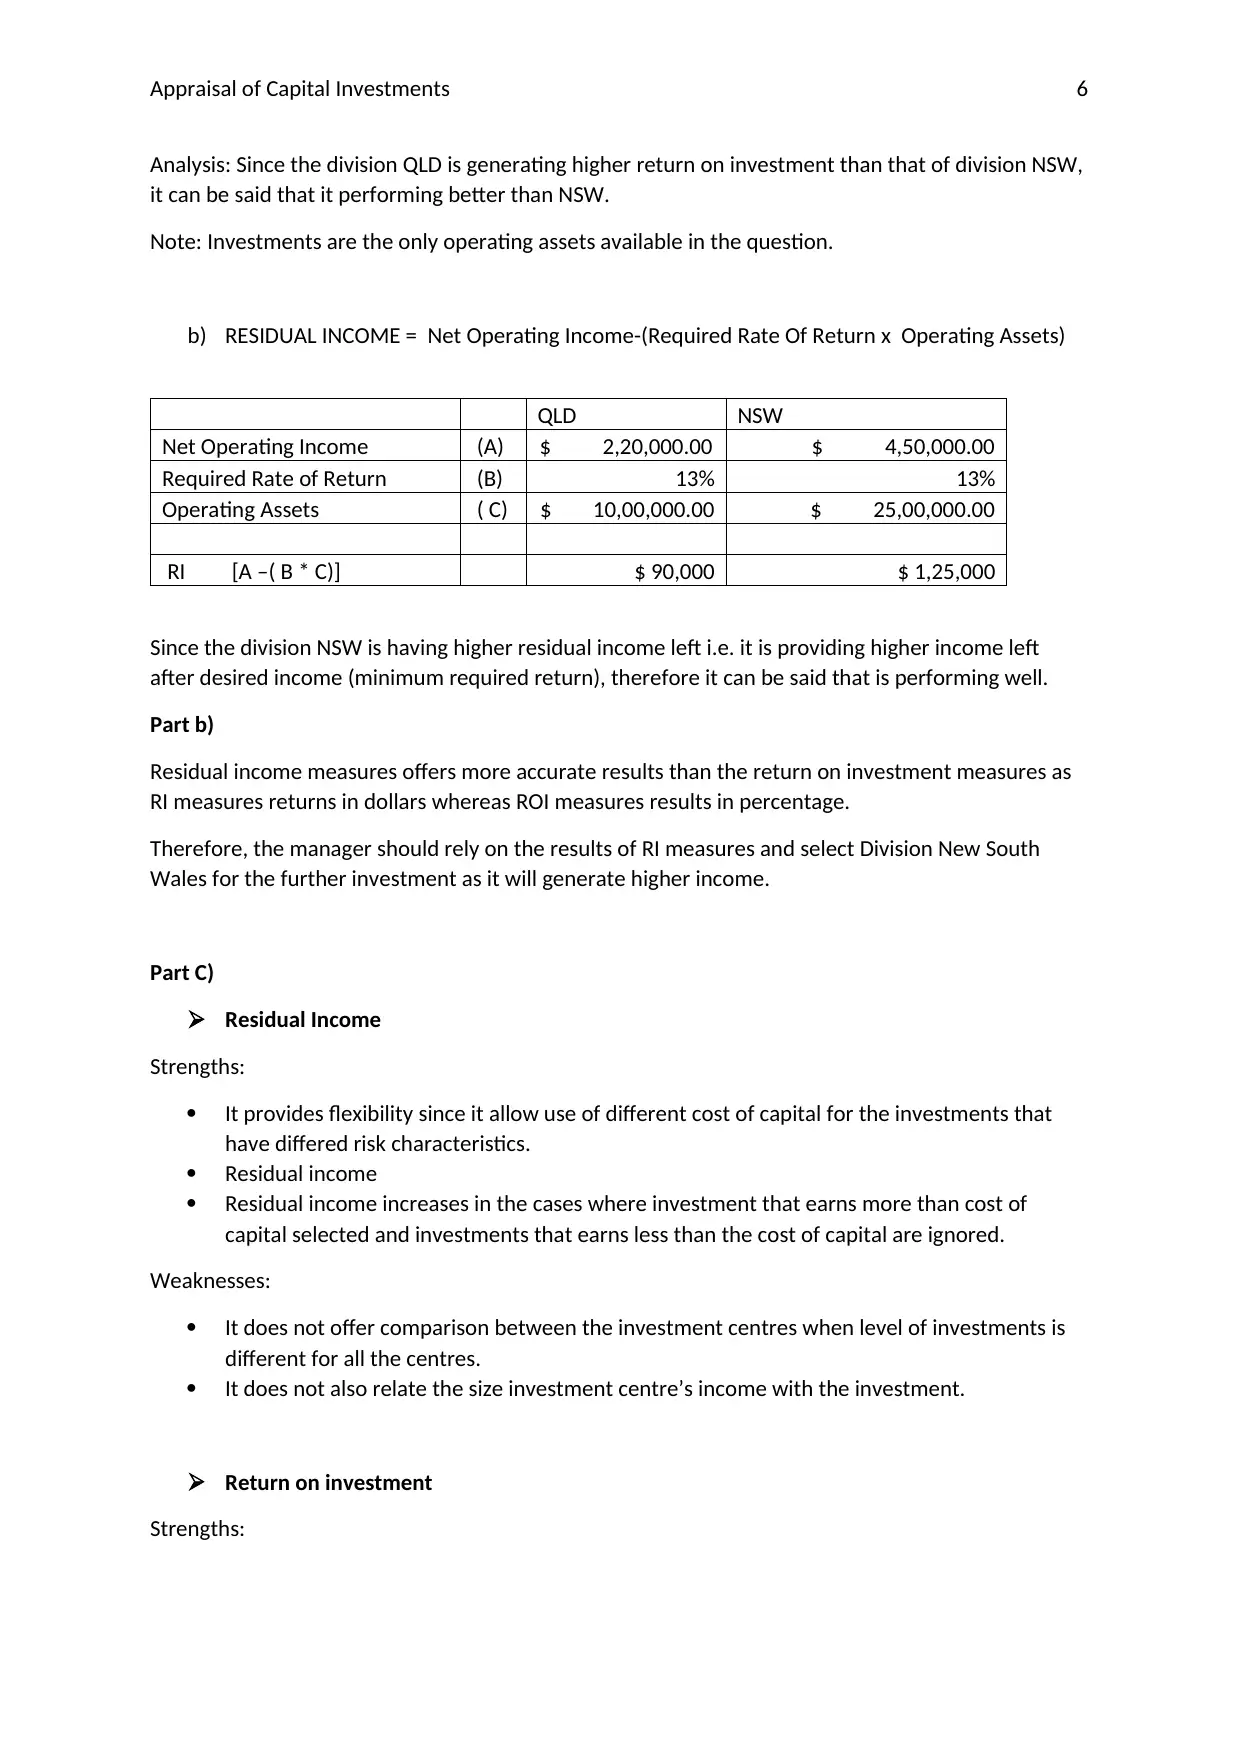
Analysis: Since the division QLD is generating higher return on investment than that of division NSW,
it can be said that it performing better than NSW.
Note: Investments are the only operating assets available in the question.
b) RESIDUAL INCOME = Net Operating Income-(Required Rate Of Return x Operating Assets)
QLD NSW
Net Operating Income (A) $ 2,20,000.00 $ 4,50,000.00
Required Rate of Return (B) 13% 13%
Operating Assets ( C) $ 10,00,000.00 $ 25,00,000.00
RI [A –( B * C)] $ 90,000 $ 1,25,000
Since the division NSW is having higher residual income left i.e. it is providing higher income left
after desired income (minimum required return), therefore it can be said that is performing well.
Part b)
Residual income measures offers more accurate results than the return on investment measures as
RI measures returns in dollars whereas ROI measures results in percentage.
Therefore, the manager should rely on the results of RI measures and select Division New South
Wales for the further investment as it will generate higher income.
Part C)
Residual Income
Strengths:
It provides flexibility since it allow use of different cost of capital for the investments that
have differed risk characteristics.
Residual income
Residual income increases in the cases where investment that earns more than cost of
capital selected and investments that earns less than the cost of capital are ignored.
Weaknesses:
It does not offer comparison between the investment centres when level of investments is
different for all the centres.
It does not also relate the size investment centre’s income with the investment.
Return on investment
Strengths:
Paraphrase This Document
Need a fresh take? Get an instant paraphrase of this document with our AI Paraphraser
Appraisal of Capital Investments 7
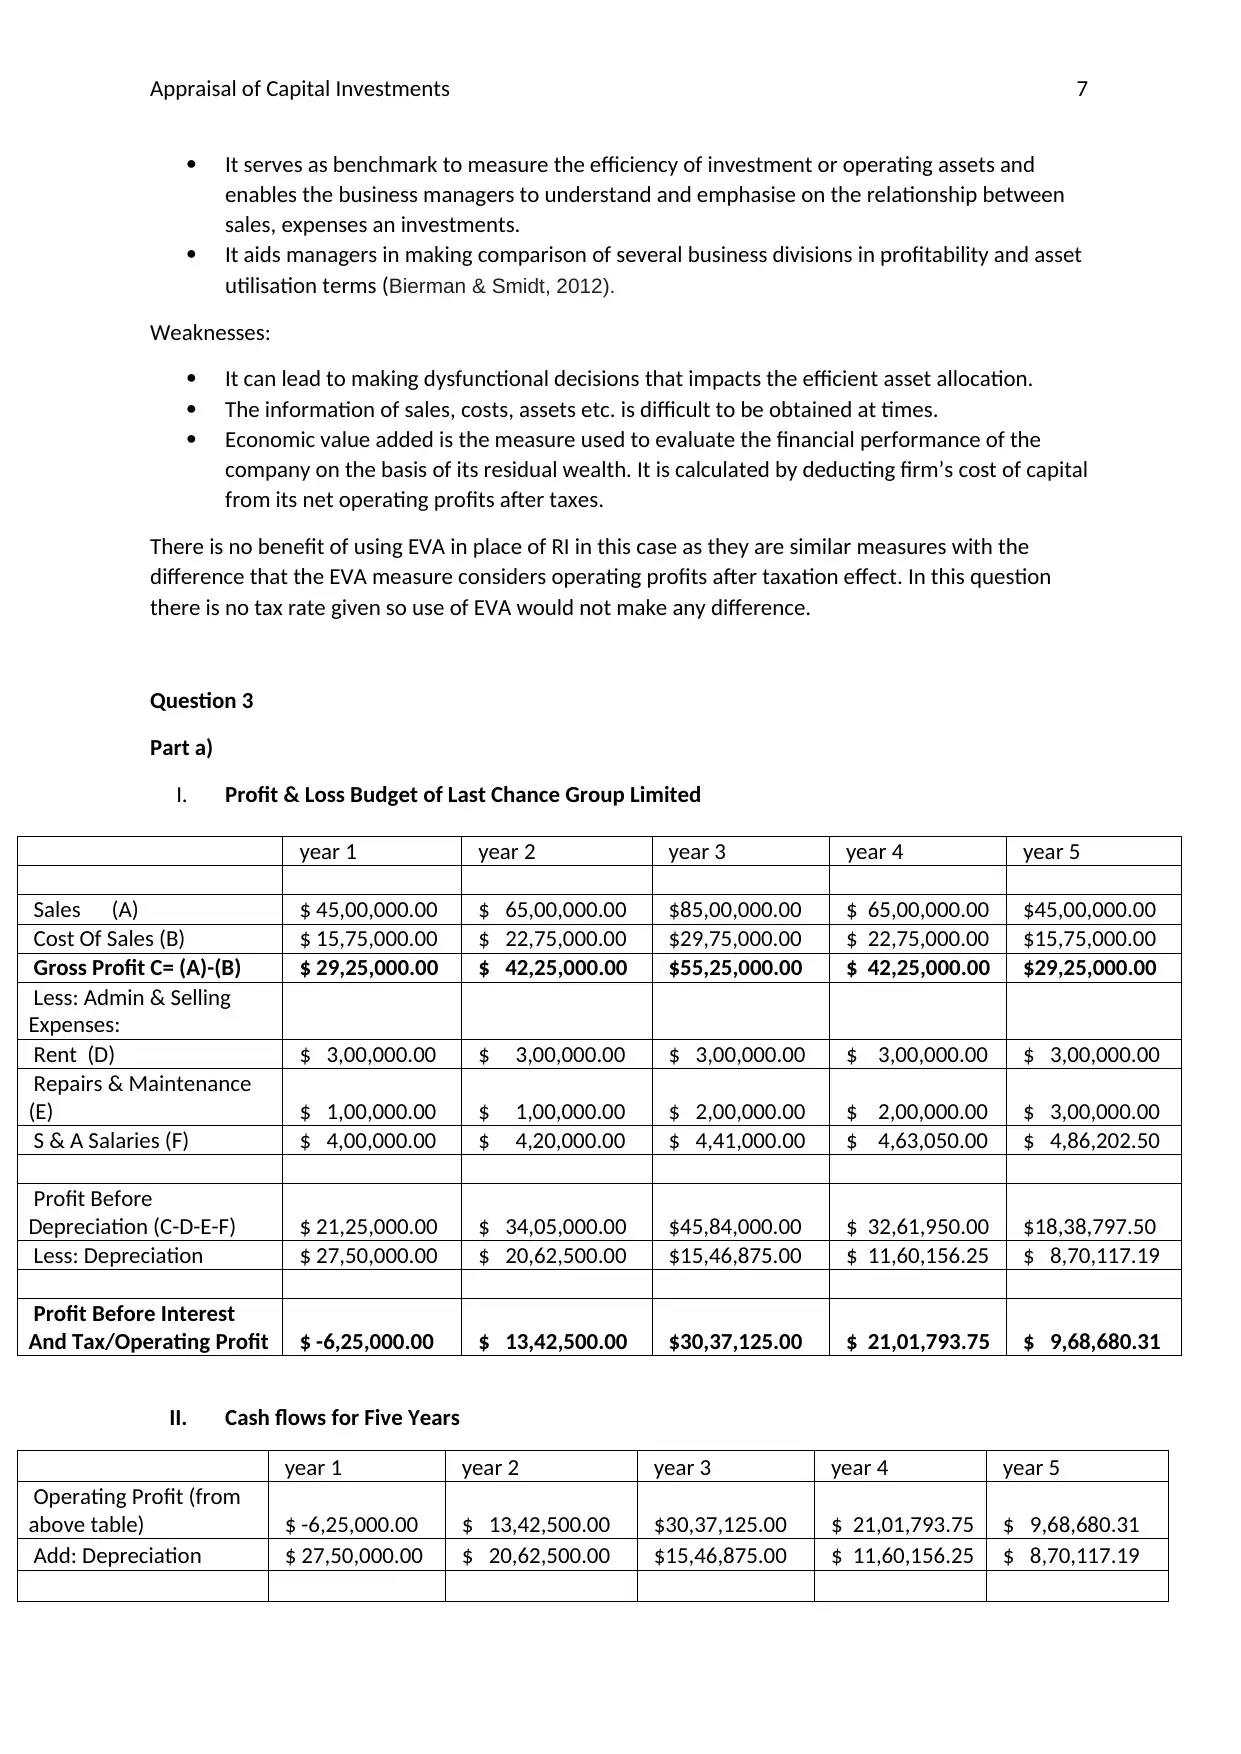
It serves as benchmark to measure the efficiency of investment or operating assets and
enables the business managers to understand and emphasise on the relationship between
sales, expenses an investments.
It aids managers in making comparison of several business divisions in profitability and asset
utilisation terms (Bierman & Smidt, 2012).
Weaknesses:
It can lead to making dysfunctional decisions that impacts the efficient asset allocation.
The information of sales, costs, assets etc. is difficult to be obtained at times.
Economic value added is the measure used to evaluate the financial performance of the
company on the basis of its residual wealth. It is calculated by deducting firm’s cost of capital
from its net operating profits after taxes.
There is no benefit of using EVA in place of RI in this case as they are similar measures with the
difference that the EVA measure considers operating profits after taxation effect. In this question
there is no tax rate given so use of EVA would not make any difference.
Question 3
Part a)
I. Profit & Loss Budget of Last Chance Group Limited
year 1 year 2 year 3 year 4 year 5
Sales (A) $ 45,00,000.00 $ 65,00,000.00 $85,00,000.00 $ 65,00,000.00 $45,00,000.00
Cost Of Sales (B) $ 15,75,000.00 $ 22,75,000.00 $29,75,000.00 $ 22,75,000.00 $15,75,000.00
Gross Profit C= (A)-(B) $ 29,25,000.00 $ 42,25,000.00 $55,25,000.00 $ 42,25,000.00 $29,25,000.00
Less: Admin & Selling
Expenses:
Rent (D) $ 3,00,000.00 $ 3,00,000.00 $ 3,00,000.00 $ 3,00,000.00 $ 3,00,000.00
Repairs & Maintenance
(E) $ 1,00,000.00 $ 1,00,000.00 $ 2,00,000.00 $ 2,00,000.00 $ 3,00,000.00
S & A Salaries (F) $ 4,00,000.00 $ 4,20,000.00 $ 4,41,000.00 $ 4,63,050.00 $ 4,86,202.50
Profit Before
Depreciation (C-D-E-F) $ 21,25,000.00 $ 34,05,000.00 $45,84,000.00 $ 32,61,950.00 $18,38,797.50
Less: Depreciation $ 27,50,000.00 $ 20,62,500.00 $15,46,875.00 $ 11,60,156.25 $ 8,70,117.19
Profit Before Interest
And Tax/Operating Profit $ -6,25,000.00 $ 13,42,500.00 $30,37,125.00 $ 21,01,793.75 $ 9,68,680.31
II. Cash flows for Five Years
year 1 year 2 year 3 year 4 year 5
Operating Profit (from
above table) $ -6,25,000.00 $ 13,42,500.00 $30,37,125.00 $ 21,01,793.75 $ 9,68,680.31
Add: Depreciation $ 27,50,000.00 $ 20,62,500.00 $15,46,875.00 $ 11,60,156.25 $ 8,70,117.19
Appraisal of Capital Investments 8
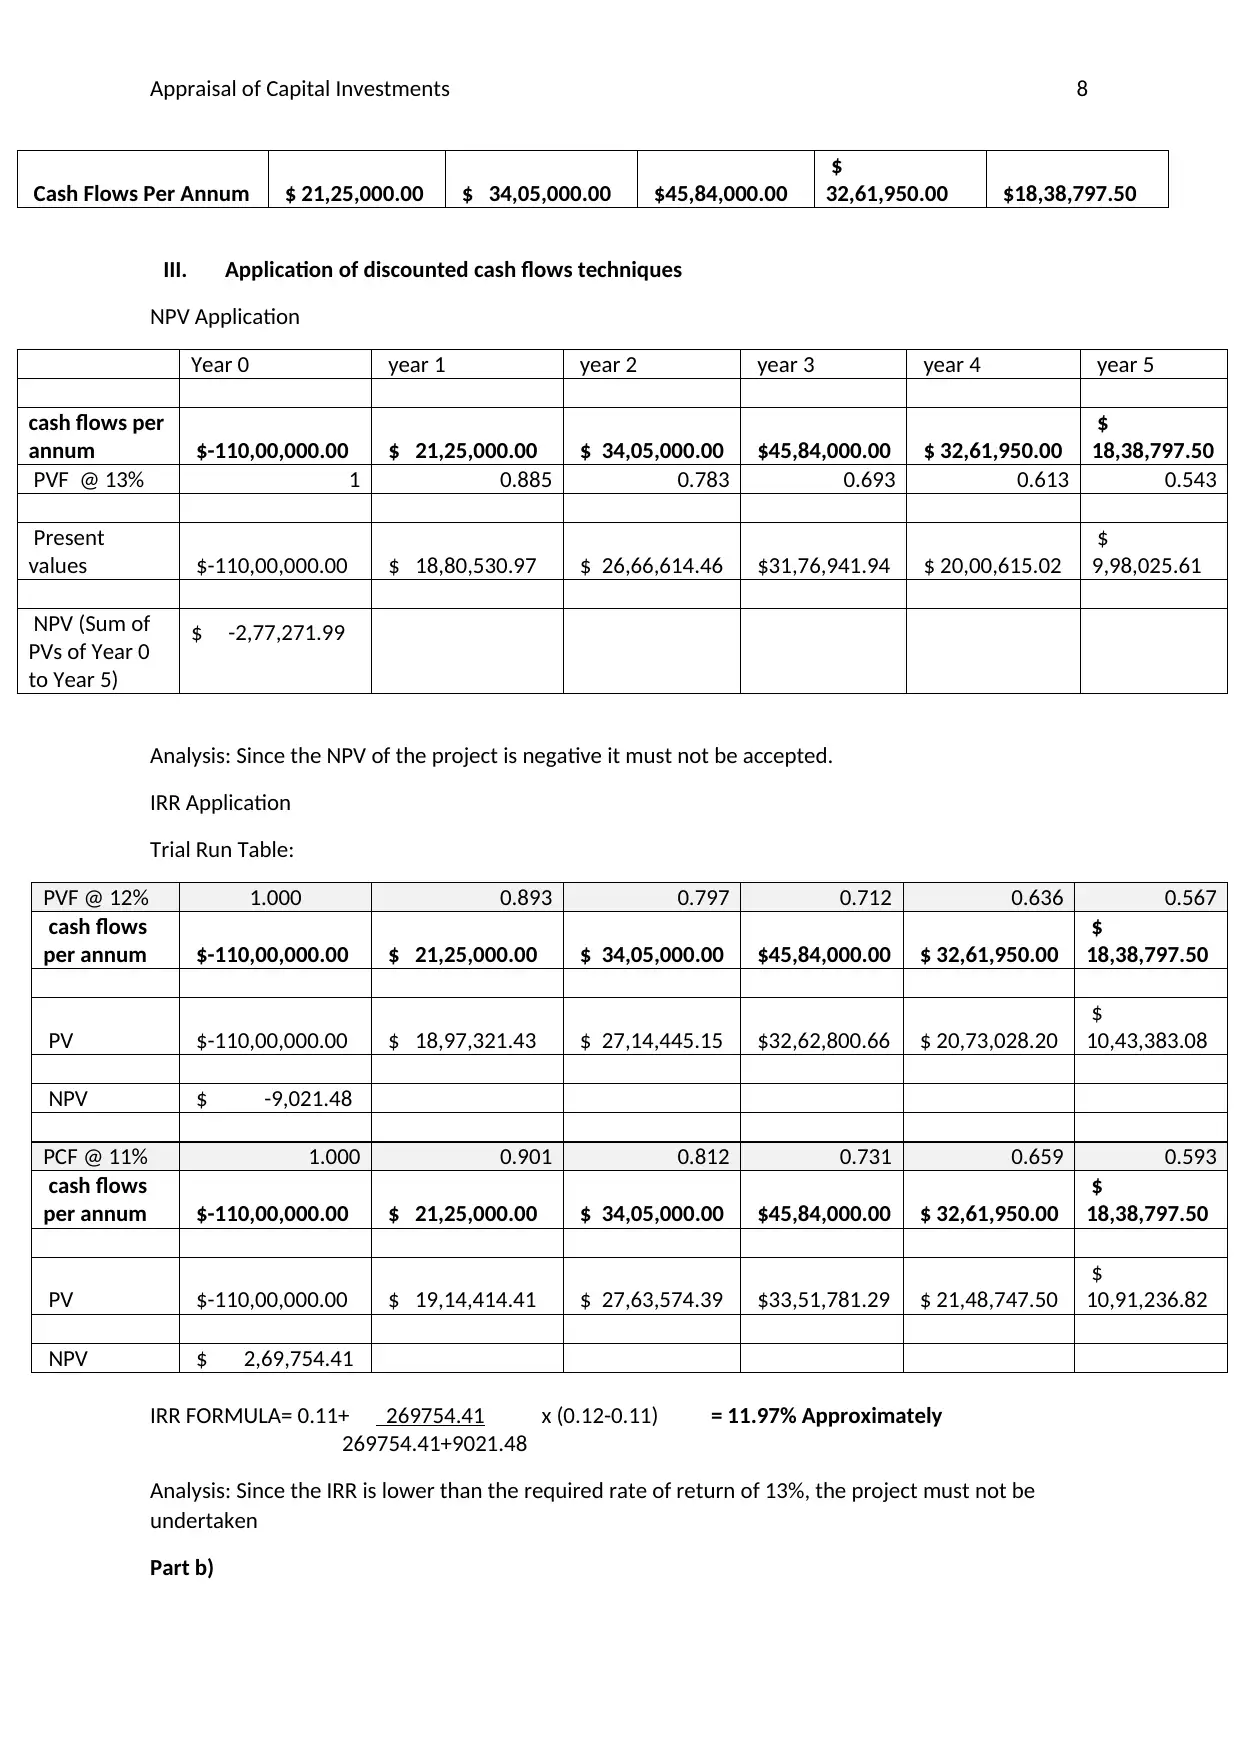
Cash Flows Per Annum $ 21,25,000.00 $ 34,05,000.00 $45,84,000.00
$
32,61,950.00 $18,38,797.50
III. Application of discounted cash flows techniques
NPV Application
Year 0 year 1 year 2 year 3 year 4 year 5
cash flows per
annum $-110,00,000.00 $ 21,25,000.00 $ 34,05,000.00 $45,84,000.00 $ 32,61,950.00
$
18,38,797.50
PVF @ 13% 1 0.885 0.783 0.693 0.613 0.543
Present
values $-110,00,000.00 $ 18,80,530.97 $ 26,66,614.46 $31,76,941.94 $ 20,00,615.02
$
9,98,025.61
NPV (Sum of
PVs of Year 0
to Year 5)
$ -2,77,271.99
Analysis: Since the NPV of the project is negative it must not be accepted.
IRR Application
Trial Run Table:
PVF @ 12% 1.000 0.893 0.797 0.712 0.636 0.567
cash flows
per annum $-110,00,000.00 $ 21,25,000.00 $ 34,05,000.00 $45,84,000.00 $ 32,61,950.00
$
18,38,797.50
PV $-110,00,000.00 $ 18,97,321.43 $ 27,14,445.15 $32,62,800.66 $ 20,73,028.20
$
10,43,383.08
NPV $ -9,021.48
PCF @ 11% 1.000 0.901 0.812 0.731 0.659 0.593
cash flows
per annum $-110,00,000.00 $ 21,25,000.00 $ 34,05,000.00 $45,84,000.00 $ 32,61,950.00
$
18,38,797.50
PV $-110,00,000.00 $ 19,14,414.41 $ 27,63,574.39 $33,51,781.29 $ 21,48,747.50
$
10,91,236.82
NPV $ 2,69,754.41
IRR FORMULA= 0.11+ 269754.41 x (0.12-0.11) = 11.97% Approximately
269754.41+9021.48
Analysis: Since the IRR is lower than the required rate of return of 13%, the project must not be
undertaken
Part b)
⊘ This is a preview!⊘
Do you want full access?
Subscribe today to unlock all pages.
Trusted by 1+ million students worldwide
Appraisal of Capital Investments 9
Budgeting is the integral part of future planning. It has its own advantages and advantages that are
given below:
Advantages:
It provides businesses with the ‘’plan of spending ’’ and thereby helps the managers in
decision making.
It provides the tool to evaluate the performance of company by offering the basis to make
comparisons of actual and planned results.
It aids the distribution and appropriate allocation of resources of the business to the key
areas (DRURY, 2013).
Disadvantages:
Budgeting process is featured by rigidity of Budgeted plans which do not work in the
changing environment of business (Wampler, 2010).
It is also very time consuming process.
Paraphrase This Document
Need a fresh take? Get an instant paraphrase of this document with our AI Paraphraser
Appraisal of Capital Investments
10
References:
Baker, H. K., & English, P. (2011). Capital budgeting valuation: Financial analysis for today's
investment projects (Vol. 13). John Wiley & Sons.
Bierman Jr, H., & Smidt, S. (2012). The capital budgeting decision: economic analysis of investment
projects. Routledge.
DRURY, C. M. (2013). Management and cost accounting. Springer.
Wampler, B. (2010). Participatory budgeting in Brazil: Contestation, cooperation, and accountability.
Penn State Press.
1 out of 11


Your All-in-One AI-Powered Toolkit for Academic Success.
+13062052269
info@desklib.com
Available 24*7 on WhatsApp / Email
![[object Object]](/_next/static/media/star-bottom.7253800d.svg)
Unlock your academic potential
Copyright © 2020–2026 A2Z Services. All Rights Reserved. Developed and managed by ZUCOL.