Capital Budgeting Techniques for the Project - Pinto Limited
VerifiedAdded on 2023/06/12
|8
|1508
|225
AI Summary
This article discusses the capital budgeting techniques for the project of Pinto Limited. It includes NPV, IRR, Payback Period, Discounted Payback Period, and Sensitivity Analysis.
Contribute Materials
Your contribution can guide someone’s learning journey. Share your
documents today.

Running head: FINANCE
Finance
Name of the Student:
Name of the University:
Author’s Note:
Finance
Name of the Student:
Name of the University:
Author’s Note:
Secure Best Marks with AI Grader
Need help grading? Try our AI Grader for instant feedback on your assignments.
1
FINANCE
Memorandum
Memo to: Board of Directors
Company: Pinto Limited
From: Author
Subject: Capital Budgeting Techniques for the Project
Date: 25/05/2018
Introduction
As per the case which is provided in the question, the management of Pinto ltd is
planning to invest in a project so that the company can establish itself in a new product market.
The company is planning to introduce a new product in a new market for which the business has
decided conduct a capital budgeting analysis so that the management of the company can judge
the viability of the project (Burns and Walker 2015).
2
FINANCE
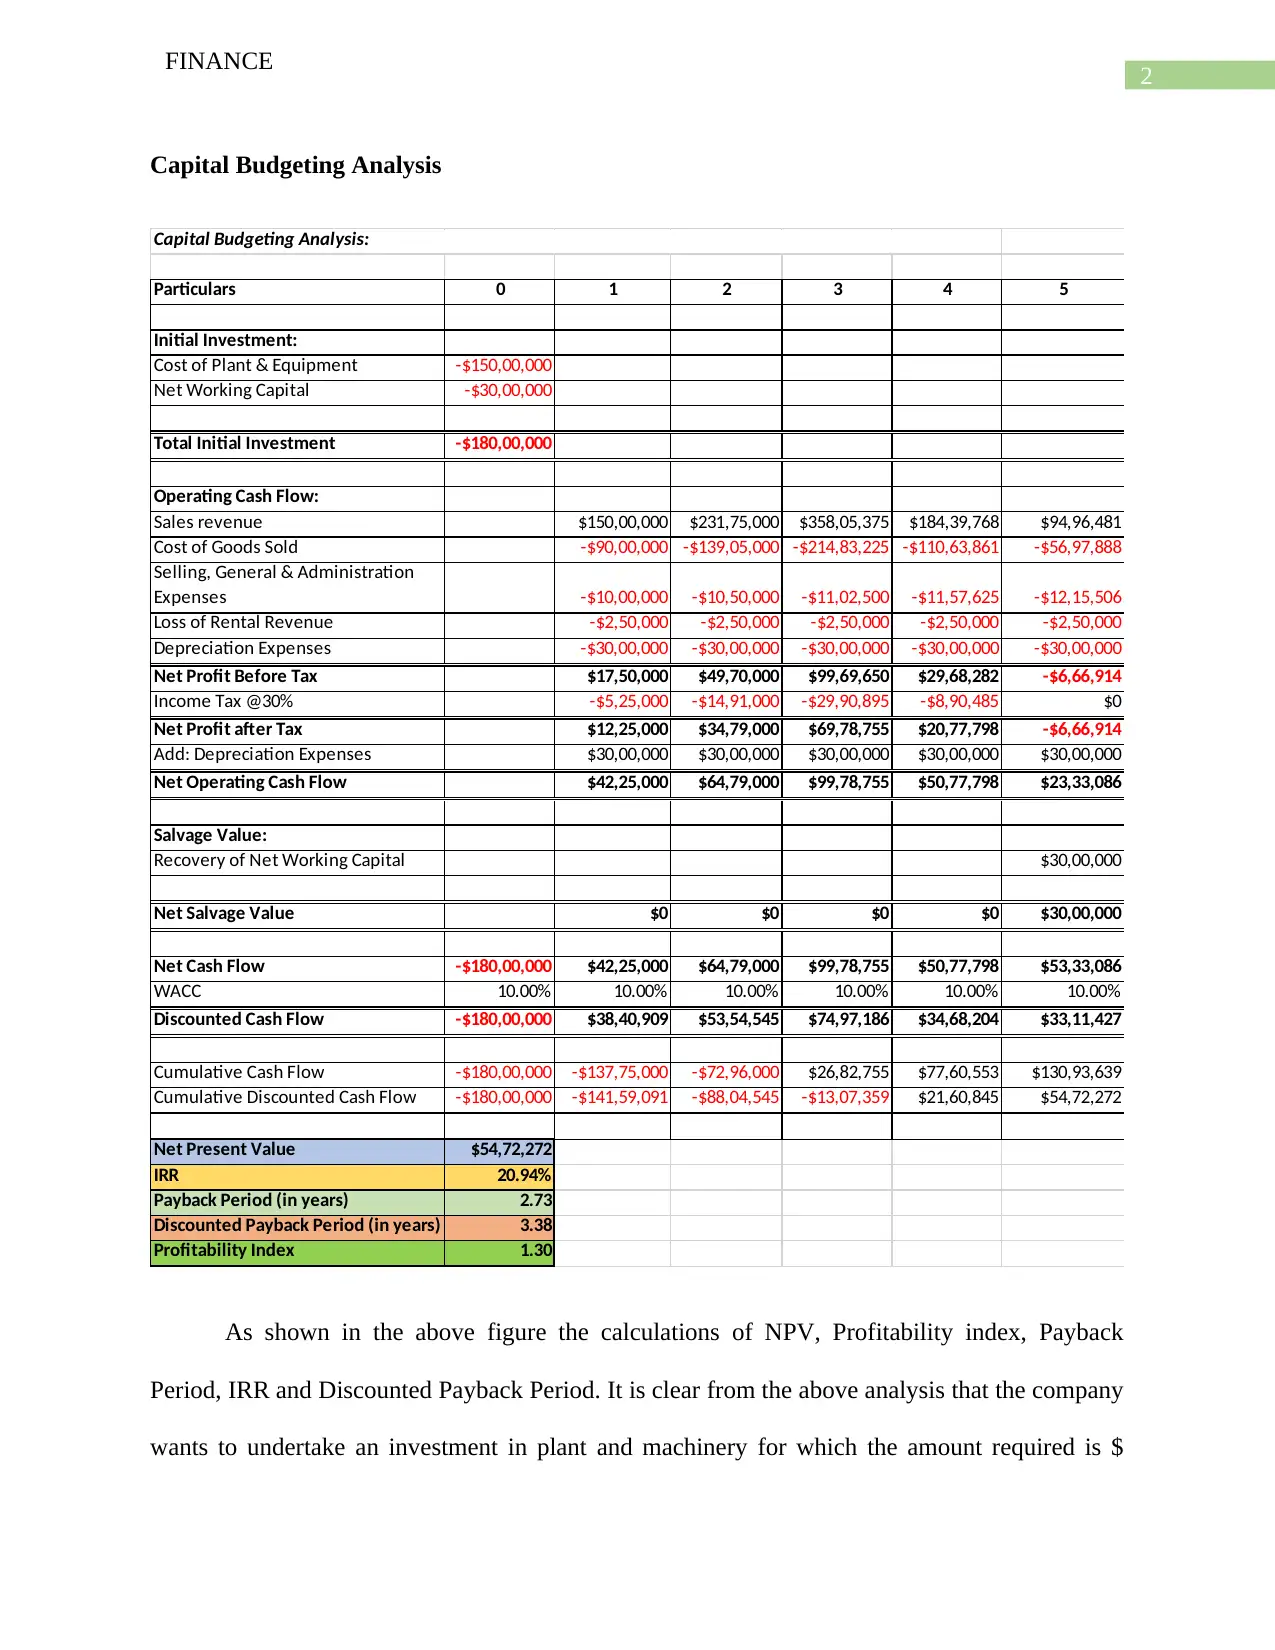
Capital Budgeting Analysis
Particulars 0 1 2 3 4 5
Initial Investment:
Cost of Plant & Equipment -$150,00,000
Net Working Capital -$30,00,000
Total Initial Investment -$180,00,000
Operating Cash Flow:
Sales revenue $150,00,000 $231,75,000 $358,05,375 $184,39,768 $94,96,481
Cost of Goods Sold -$90,00,000 -$139,05,000 -$214,83,225 -$110,63,861 -$56,97,888
Selling, General & Administration
Expenses -$10,00,000 -$10,50,000 -$11,02,500 -$11,57,625 -$12,15,506
Loss of Rental Revenue -$2,50,000 -$2,50,000 -$2,50,000 -$2,50,000 -$2,50,000
Depreciation Expenses -$30,00,000 -$30,00,000 -$30,00,000 -$30,00,000 -$30,00,000
Net Profit Before Tax $17,50,000 $49,70,000 $99,69,650 $29,68,282 -$6,66,914
Income Tax @30% -$5,25,000 -$14,91,000 -$29,90,895 -$8,90,485 $0
Net Profit after Tax $12,25,000 $34,79,000 $69,78,755 $20,77,798 -$6,66,914
Add: Depreciation Expenses $30,00,000 $30,00,000 $30,00,000 $30,00,000 $30,00,000
Net Operating Cash Flow $42,25,000 $64,79,000 $99,78,755 $50,77,798 $23,33,086
Salvage Value:
Recovery of Net Working Capital $30,00,000
Net Salvage Value $0 $0 $0 $0 $30,00,000
Net Cash Flow -$180,00,000 $42,25,000 $64,79,000 $99,78,755 $50,77,798 $53,33,086
WACC 10.00% 10.00% 10.00% 10.00% 10.00% 10.00%
Discounted Cash Flow -$180,00,000 $38,40,909 $53,54,545 $74,97,186 $34,68,204 $33,11,427
Cumulative Cash Flow -$180,00,000 -$137,75,000 -$72,96,000 $26,82,755 $77,60,553 $130,93,639
Cumulative Discounted Cash Flow -$180,00,000 -$141,59,091 -$88,04,545 -$13,07,359 $21,60,845 $54,72,272
Net Present Value $54,72,272
IRR 20.94%
Payback Period (in years) 2.73
Discounted Payback Period (in years) 3.38
Profitability Index 1.30
Capital Budgeting Analysis:
As shown in the above figure the calculations of NPV, Profitability index, Payback
Period, IRR and Discounted Payback Period. It is clear from the above analysis that the company
wants to undertake an investment in plant and machinery for which the amount required is $
FINANCE
Capital Budgeting Analysis
Particulars 0 1 2 3 4 5
Initial Investment:
Cost of Plant & Equipment -$150,00,000
Net Working Capital -$30,00,000
Total Initial Investment -$180,00,000
Operating Cash Flow:
Sales revenue $150,00,000 $231,75,000 $358,05,375 $184,39,768 $94,96,481
Cost of Goods Sold -$90,00,000 -$139,05,000 -$214,83,225 -$110,63,861 -$56,97,888
Selling, General & Administration
Expenses -$10,00,000 -$10,50,000 -$11,02,500 -$11,57,625 -$12,15,506
Loss of Rental Revenue -$2,50,000 -$2,50,000 -$2,50,000 -$2,50,000 -$2,50,000
Depreciation Expenses -$30,00,000 -$30,00,000 -$30,00,000 -$30,00,000 -$30,00,000
Net Profit Before Tax $17,50,000 $49,70,000 $99,69,650 $29,68,282 -$6,66,914
Income Tax @30% -$5,25,000 -$14,91,000 -$29,90,895 -$8,90,485 $0
Net Profit after Tax $12,25,000 $34,79,000 $69,78,755 $20,77,798 -$6,66,914
Add: Depreciation Expenses $30,00,000 $30,00,000 $30,00,000 $30,00,000 $30,00,000
Net Operating Cash Flow $42,25,000 $64,79,000 $99,78,755 $50,77,798 $23,33,086
Salvage Value:
Recovery of Net Working Capital $30,00,000
Net Salvage Value $0 $0 $0 $0 $30,00,000
Net Cash Flow -$180,00,000 $42,25,000 $64,79,000 $99,78,755 $50,77,798 $53,33,086
WACC 10.00% 10.00% 10.00% 10.00% 10.00% 10.00%
Discounted Cash Flow -$180,00,000 $38,40,909 $53,54,545 $74,97,186 $34,68,204 $33,11,427
Cumulative Cash Flow -$180,00,000 -$137,75,000 -$72,96,000 $26,82,755 $77,60,553 $130,93,639
Cumulative Discounted Cash Flow -$180,00,000 -$141,59,091 -$88,04,545 -$13,07,359 $21,60,845 $54,72,272
Net Present Value $54,72,272
IRR 20.94%
Payback Period (in years) 2.73
Discounted Payback Period (in years) 3.38
Profitability Index 1.30
Capital Budgeting Analysis:
As shown in the above figure the calculations of NPV, Profitability index, Payback
Period, IRR and Discounted Payback Period. It is clear from the above analysis that the company
wants to undertake an investment in plant and machinery for which the amount required is $
3
FINANCE
150,00,000 and will also require additional working capital of $ 30,00,000. The weighted
average cost of capital is taken to be 10% for the purpose of calculations. As per the NPV
analysis of the business, the project is estimated to be $ 54,72,272 which shows that the cash
inflows which is expected from the business is more than the cash outflows of the business
(Moten Jr and Thron 2013). The profitability index of the business shows that the business is
able to get an index which is greater than 1 which means that the profitability of the business is
good and it is shown to be 1.30. In case of Payback period analysis, the business takes 2.73 years
in order to recover the initial investments of the business. The discounted payback period which
is calculated on the basis of the discounting rate of the business and the calculations shoe that the
discounted payback period is 3.38 years. The internal rate of return of the business which is the
point where the cash inflows and cash outflows of the business which is useful for estimating the
net worth of the project (Guerra, Magni and Stefanini 2014). The IRR of the business is shown to
be 20.94% for the project.
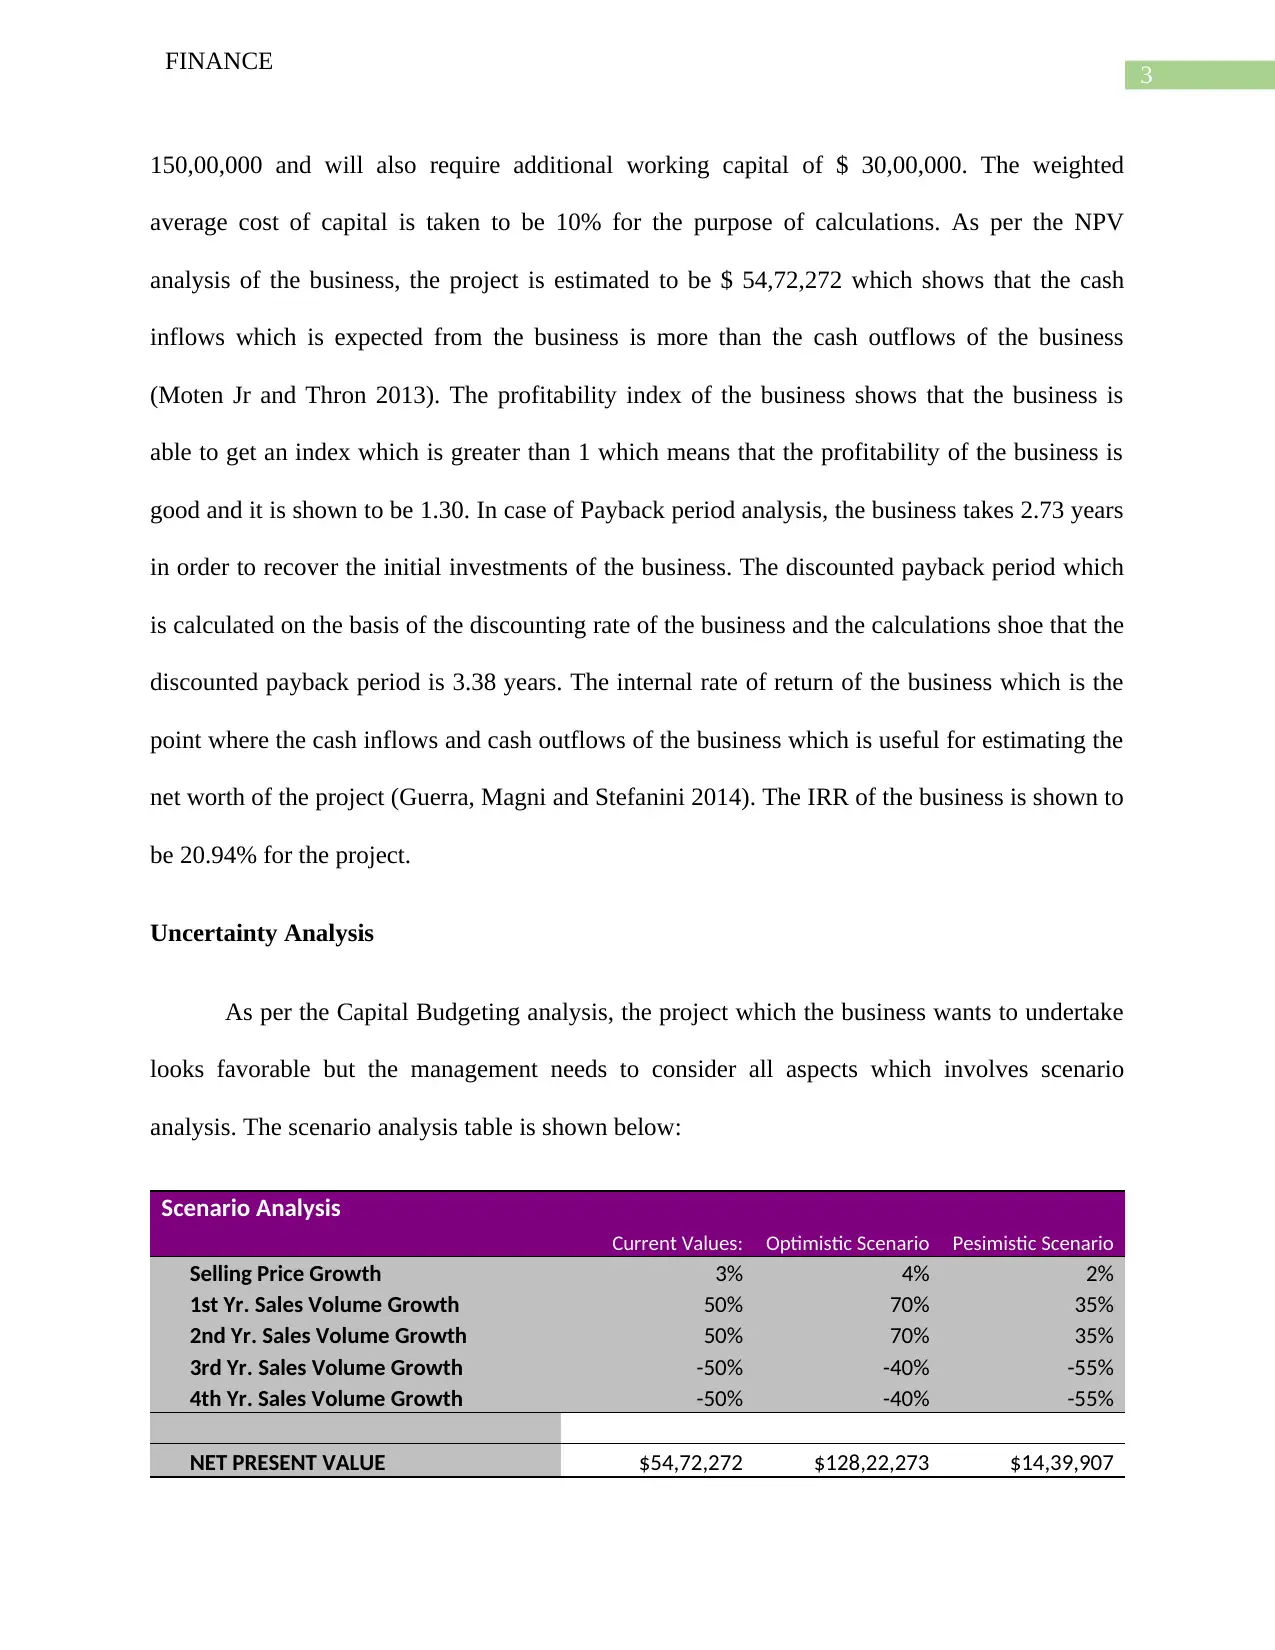
Uncertainty Analysis
As per the Capital Budgeting analysis, the project which the business wants to undertake
looks favorable but the management needs to consider all aspects which involves scenario
analysis. The scenario analysis table is shown below:
Scenario Analysis
Current Values: Optimistic Scenario Pesimistic Scenario
Selling Price Growth 3% 4% 2%
1st Yr. Sales Volume Growth 50% 70% 35%
2nd Yr. Sales Volume Growth 50% 70% 35%
3rd Yr. Sales Volume Growth -50% -40% -55%
4th Yr. Sales Volume Growth -50% -40% -55%
NET PRESENT VALUE $54,72,272 $128,22,273 $14,39,907
FINANCE
150,00,000 and will also require additional working capital of $ 30,00,000. The weighted
average cost of capital is taken to be 10% for the purpose of calculations. As per the NPV
analysis of the business, the project is estimated to be $ 54,72,272 which shows that the cash
inflows which is expected from the business is more than the cash outflows of the business
(Moten Jr and Thron 2013). The profitability index of the business shows that the business is
able to get an index which is greater than 1 which means that the profitability of the business is
good and it is shown to be 1.30. In case of Payback period analysis, the business takes 2.73 years
in order to recover the initial investments of the business. The discounted payback period which
is calculated on the basis of the discounting rate of the business and the calculations shoe that the
discounted payback period is 3.38 years. The internal rate of return of the business which is the
point where the cash inflows and cash outflows of the business which is useful for estimating the
net worth of the project (Guerra, Magni and Stefanini 2014). The IRR of the business is shown to
be 20.94% for the project.
Uncertainty Analysis
As per the Capital Budgeting analysis, the project which the business wants to undertake
looks favorable but the management needs to consider all aspects which involves scenario
analysis. The scenario analysis table is shown below:
Scenario Analysis
Current Values: Optimistic Scenario Pesimistic Scenario
Selling Price Growth 3% 4% 2%
1st Yr. Sales Volume Growth 50% 70% 35%
2nd Yr. Sales Volume Growth 50% 70% 35%
3rd Yr. Sales Volume Growth -50% -40% -55%
4th Yr. Sales Volume Growth -50% -40% -55%
NET PRESENT VALUE $54,72,272 $128,22,273 $14,39,907
Secure Best Marks with AI Grader
Need help grading? Try our AI Grader for instant feedback on your assignments.
4
FINANCE
Optimistic Approach: In this scenario it is assumed that the sales growth will be 4% and the
performance of the business will be beyond expectations. The sales growth in terms of unit for
the year 1 and 2 is anticipated to be 70%. The business in such a scenario is anticipated to be at a
favorable position. The NPV of the business is shown to be $ 128,22,273 under this scenario.
Pessimistic Approach: In this scenario, a narrow approach is considered and the growth in sales
is taken to be 2%, The projections of sales growth in the shows s 35% for the 1st and 2nd year.
The NPV under this scenario is shown to be $ 14,39,907.
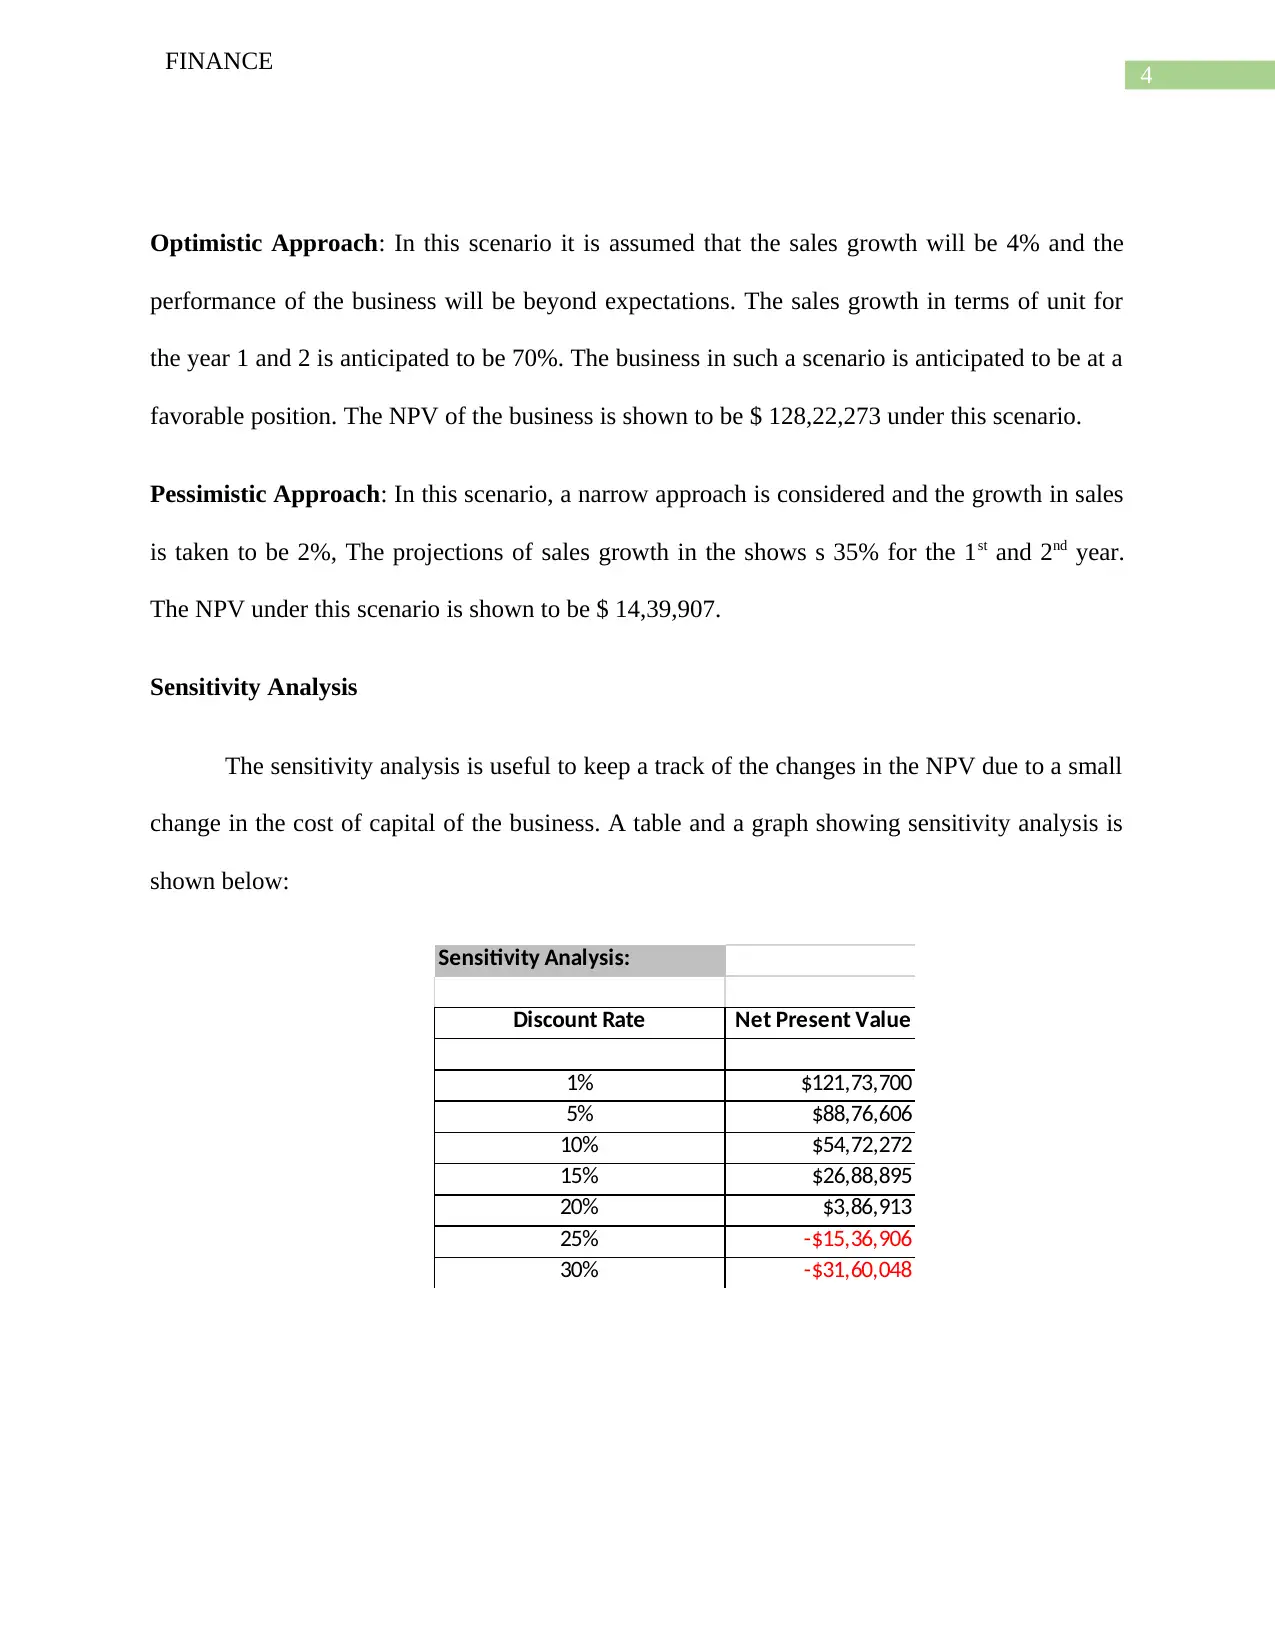
Sensitivity Analysis
The sensitivity analysis is useful to keep a track of the changes in the NPV due to a small
change in the cost of capital of the business. A table and a graph showing sensitivity analysis is
shown below:
Sensitivity Analysis:
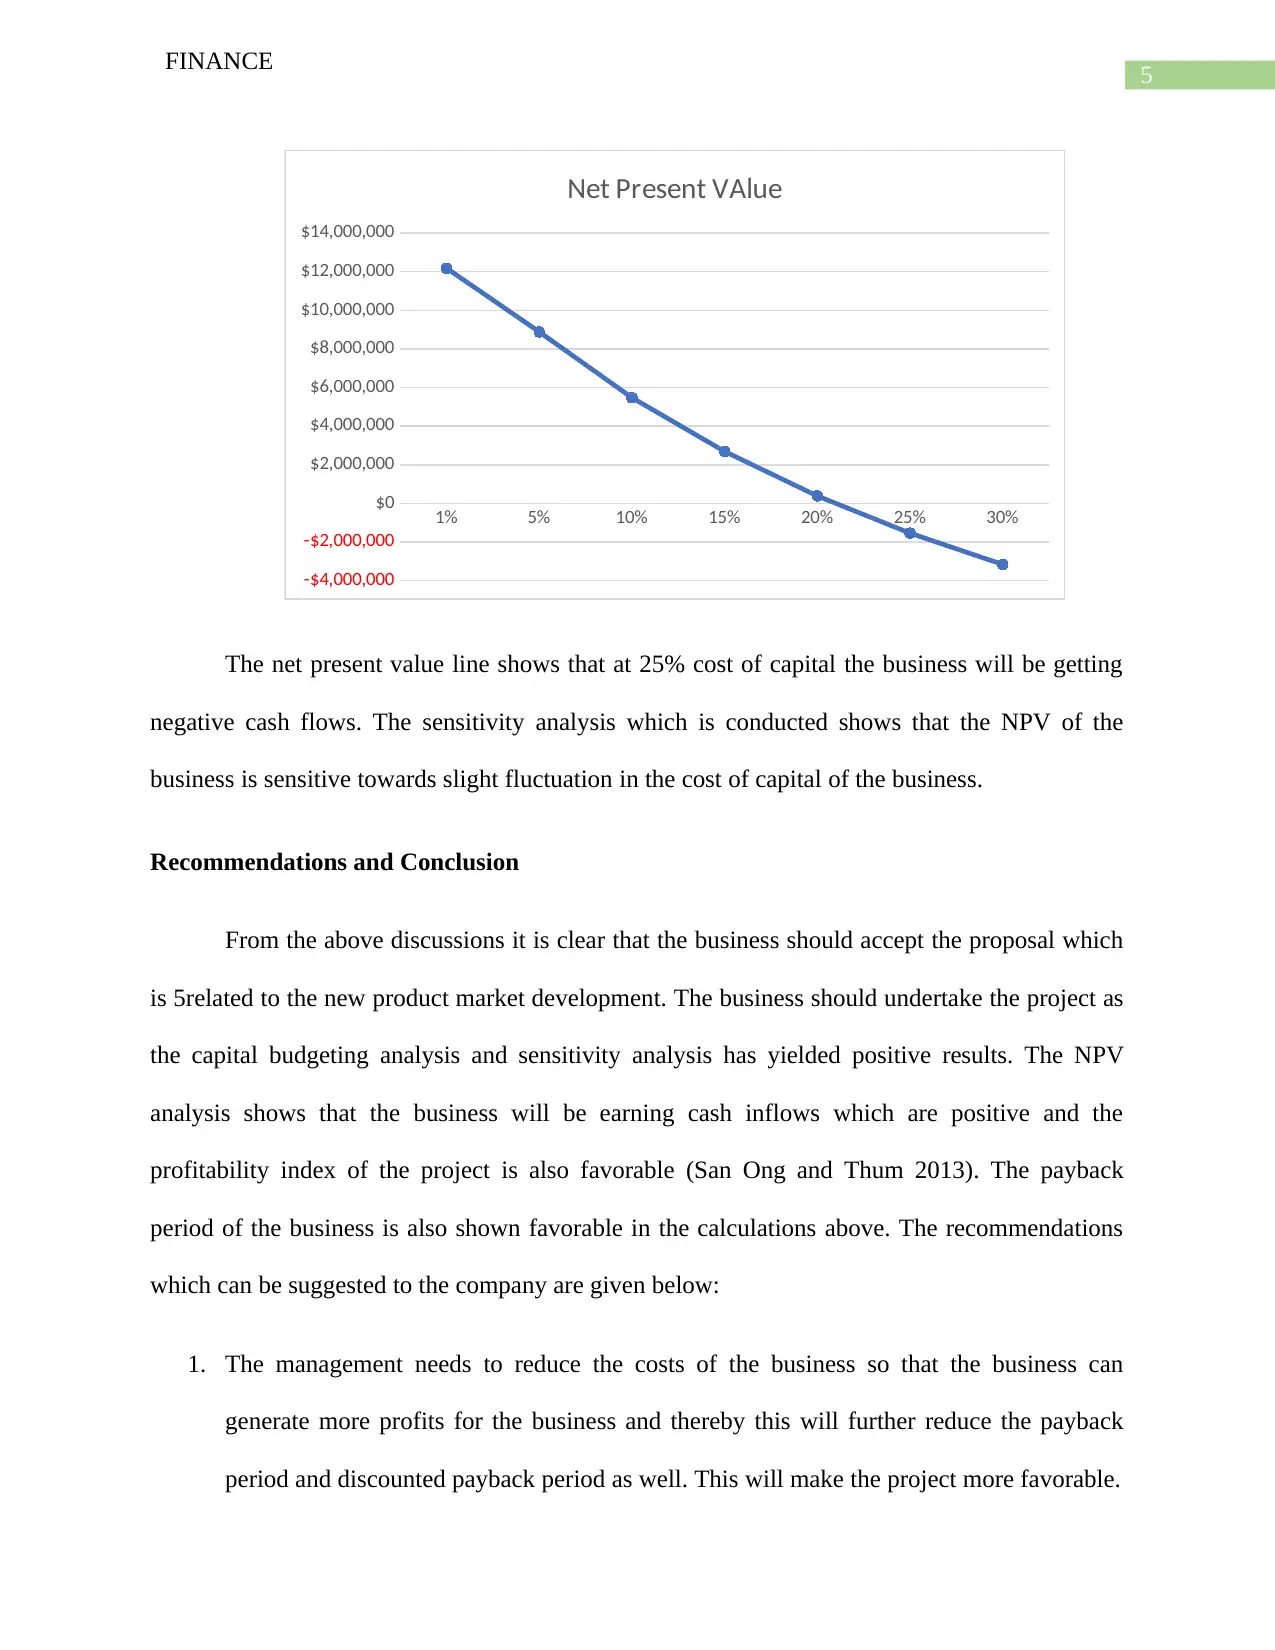
Discount Rate Net Present Value
1% $121,73,700
5% $88,76,606
10% $54,72,272
15% $26,88,895
20% $3,86,913
25% -$15,36,906
30% -$31,60,048
FINANCE
Optimistic Approach: In this scenario it is assumed that the sales growth will be 4% and the
performance of the business will be beyond expectations. The sales growth in terms of unit for
the year 1 and 2 is anticipated to be 70%. The business in such a scenario is anticipated to be at a
favorable position. The NPV of the business is shown to be $ 128,22,273 under this scenario.
Pessimistic Approach: In this scenario, a narrow approach is considered and the growth in sales
is taken to be 2%, The projections of sales growth in the shows s 35% for the 1st and 2nd year.
The NPV under this scenario is shown to be $ 14,39,907.
Sensitivity Analysis
The sensitivity analysis is useful to keep a track of the changes in the NPV due to a small
change in the cost of capital of the business. A table and a graph showing sensitivity analysis is
shown below:
Sensitivity Analysis:
Discount Rate Net Present Value
1% $121,73,700
5% $88,76,606
10% $54,72,272
15% $26,88,895
20% $3,86,913
25% -$15,36,906
30% -$31,60,048
5
FINANCE
1% 5% 10% 15% 20% 25% 30%
-$4,000,000
-$2,000,000
$0
$2,000,000
$4,000,000
$6,000,000
$8,000,000
$10,000,000
$12,000,000
$14,000,000
Net Present VAlue
The net present value line shows that at 25% cost of capital the business will be getting
negative cash flows. The sensitivity analysis which is conducted shows that the NPV of the
business is sensitive towards slight fluctuation in the cost of capital of the business.
Recommendations and Conclusion
From the above discussions it is clear that the business should accept the proposal which
is 5related to the new product market development. The business should undertake the project as
the capital budgeting analysis and sensitivity analysis has yielded positive results. The NPV
analysis shows that the business will be earning cash inflows which are positive and the
profitability index of the project is also favorable (San Ong and Thum 2013). The payback
period of the business is also shown favorable in the calculations above. The recommendations
which can be suggested to the company are given below:
1. The management needs to reduce the costs of the business so that the business can
generate more profits for the business and thereby this will further reduce the payback
period and discounted payback period as well. This will make the project more favorable.

6
FINANCE
2. The management of the company needs to develop strategies so that the sales of the
business can be maximized. The assumption which is considered in this case is that the
volume of sales and sale price will be increasing.
FINANCE
2. The management of the company needs to develop strategies so that the sales of the
business can be maximized. The assumption which is considered in this case is that the
volume of sales and sale price will be increasing.
Paraphrase This Document
Need a fresh take? Get an instant paraphrase of this document with our AI Paraphraser
7
FINANCE
Reference
Burns, R. and Walker, J., 2015. Capital budgeting surveys: the future is now.
Guerra, M.L., Magni, C.A. and Stefanini, L., 2014. Interval and fuzzy Average Internal Rate of
Return for investment appraisal. Fuzzy Sets and Systems, 257, pp.217-241.
Moten Jr, J.M. and Thron, C., 2013. Improvements on secant method for estimating internal rate
of return (IRR). Int. J. Appl. Math. Stat, 42(12), pp.84-93.
San Ong, T. and Thum, C.H., 2013. Net present value and payback period for building integrated
photovoltaic projects in Malaysia. International Journal of Academic Research in Business and
Social Sciences, 3(2), p.153.
1 out of 8
Related Documents


Your All-in-One AI-Powered Toolkit for Academic Success.
+13062052269
info@desklib.com
Available 24*7 on WhatsApp / Email
![[object Object]](/_next/static/media/star-bottom.7253800d.svg)
Unlock your academic potential
© 2024 | Zucol Services PVT LTD | All rights reserved.