Capital Structure Decision for Firm X: Finance for Decision Making
VerifiedAdded on 2023/06/04
|20
|4622
|109
AI Summary
The report explores proposed business decision making for raising finance via equity or debt for Firm X. It analyses different scenarios with computation of capital structure under different scenarios. The report emphasizes on the qualitative aspects of loan procurement like agency effect and signalling effect of capital structure. The optimal combination of debt and equity is achieved at different points of capital mix. Subject: Finance for Decision Making, Course Code: N/A, Course Name: N/A, College/University: N/A
Contribute Materials
Your contribution can guide someone’s learning journey. Share your
documents today.

FINANCE FOR DECISION MAKING
FIRM X-CAPITAL STRUCTURE DECISION
FIRM X-CAPITAL STRUCTURE DECISION
Secure Best Marks with AI Grader
Need help grading? Try our AI Grader for instant feedback on your assignments.
Table Of Contents
Analysis..................................................................................................................................................3
Computation of Capital Structure under different scenario..................................................................5
Case 1: Risk Free Debt without tax....................................................................................................5
Case 1: Risk Free Debt with tax..........................................................................................................7
Case 2: Risky Debt without tax..........................................................................................................9
Case 2: Risky Debt with tax..............................................................................................................10
Problems under Capital Financing.......................................................................................................12
Conclusion...........................................................................................................................................14
References...........................................................................................................................................14
Introduction
The report has been written to explore proposed business decision making for raising finance
via equity or debt. X Company is trying to explore different venues of procuring funds and
has surveyed and collected data regarding the cost of capital of the company under different
structure and different level of risk.
X company has an investment opportunity of $100,000 and for the purpose of the same the
company has listed various funding options and trying to explore an optimal combination of
debt and equity to fund the project at low cost of capital while emphasizing on the qualitative
aspects of loan procurement like agency effect and signalling effect of capital structure. The
report in detail deals with the same.
It shall also be pertinent to note that Net Present Value of the project is positive at 15% rate
of discount. Thus, the ideal financing shall have ideal combination of debt and equity under
which the cost of capital shall be lower than 15%.
Analysis
The report contains two case: case 1 and case 2 with different range of combination of debt
and equity. Under case 1 there is risk free debt while under case 2 there is risky debt. Further,
the corporate rate of taxation is 40% and the tax saving in account if interest shall be
available. The report also assumes that the pre and post cost of equity remains the same and
thus there is no impact of corporate tax.
The analysis starts with explaining the proposition of Modigliani Miller under which it has
been stated that the market capitalisation of the company is not dependent on the capital
structure of the company rather the same is dependent on the net operating cash flows.
Further, the model assumes that there is no transaction cost and taxes. However, under the
present scenario, there is corporation tax of 40%, thus the proposition 1 does not hold good.
Under the second proposition it has been stated that the market value of the firm shall
increase by the present value of tax savings on account of interest on debt. Further, the above
proposition states that the ideal debt equity combination is 100% and 0% symbolising fully
funded by debt which is not a good idea. The proposition is set back by many drawbacks and
limitation and cannot be wholly trusted upon. Further, it shall be in appropriate to assume that
cost of capital of the company remains consistent irrespective of capital structure as it with
increase in debt in the capital mix, the cost of debt initially decreased however the same
increase after a certain level of combination on account of cost of distress to equity
shareholders.
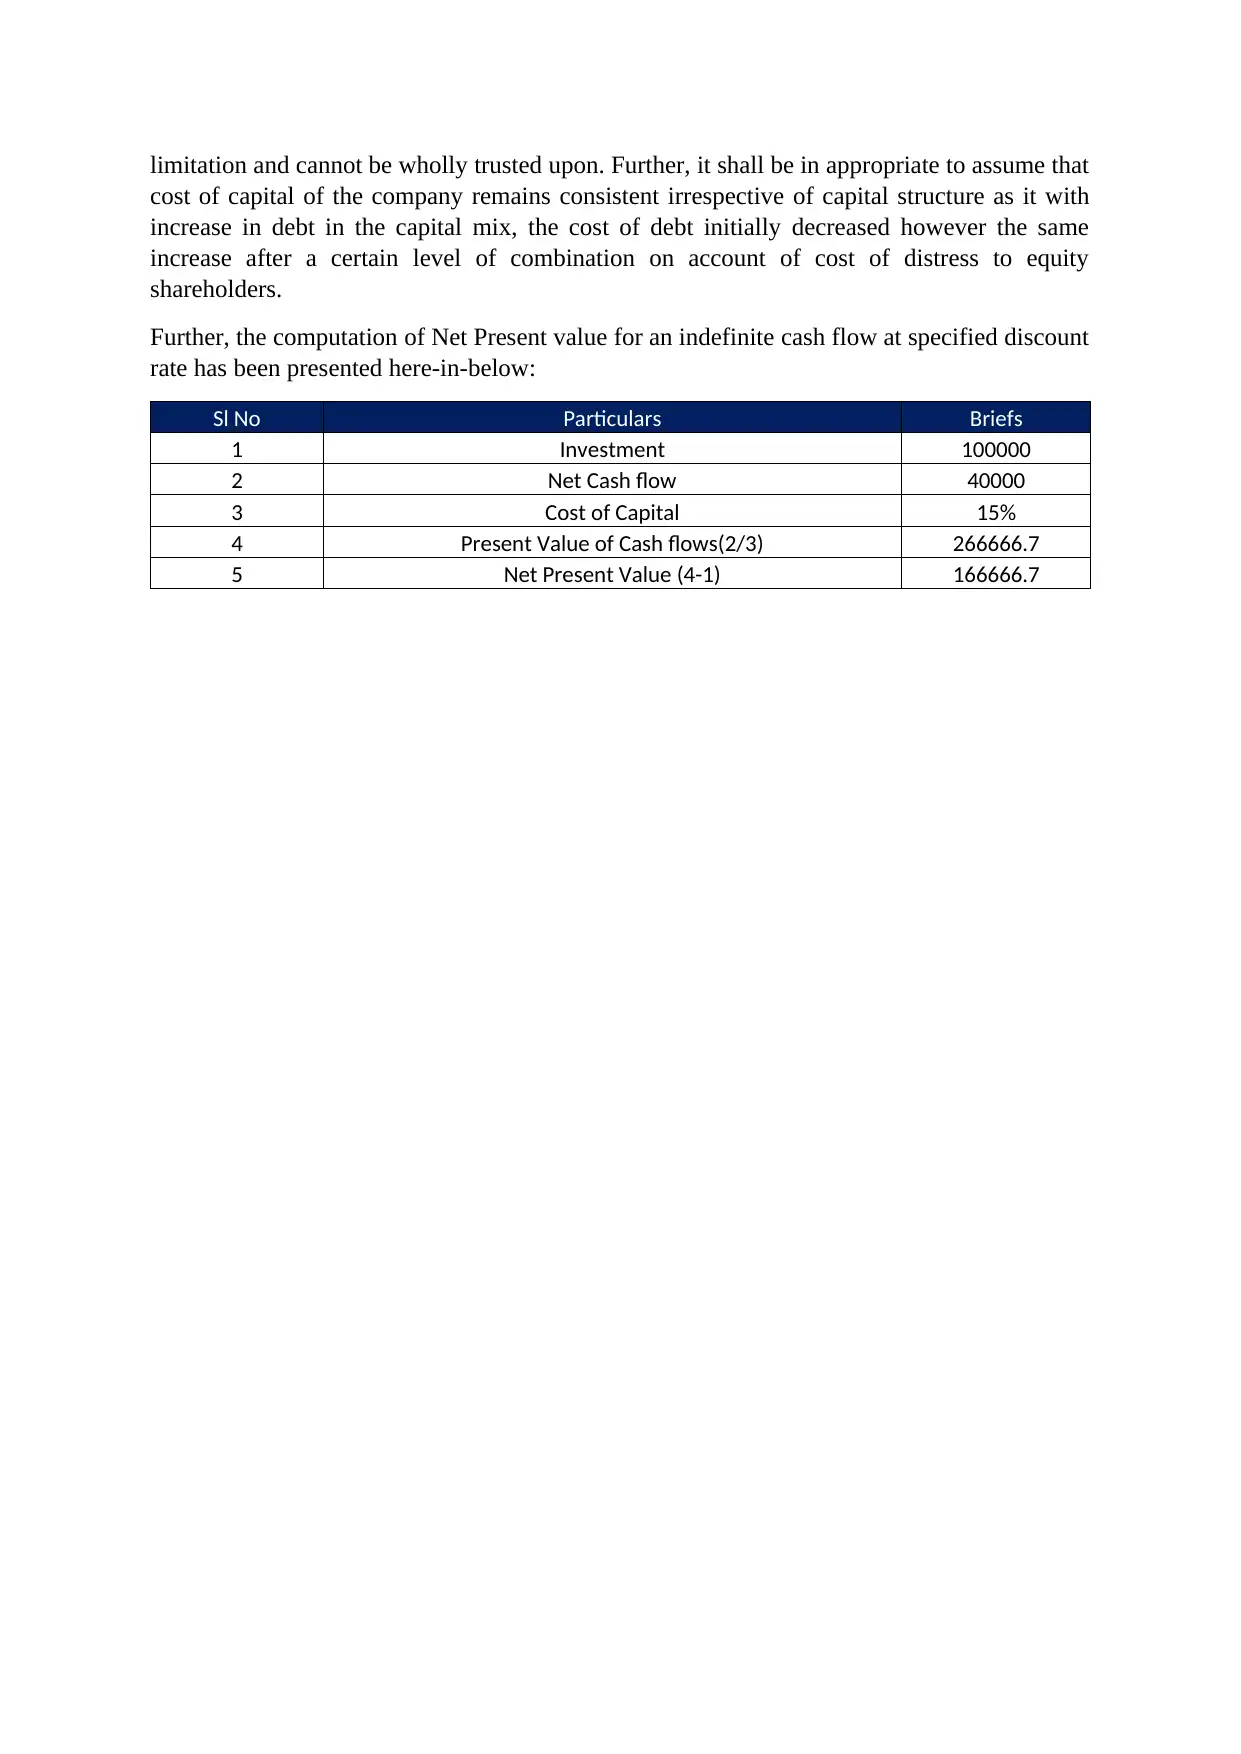
Further, the computation of Net Present value for an indefinite cash flow at specified discount
rate has been presented here-in-below:
Sl No Particulars Briefs
1 Investment 100000
2 Net Cash flow 40000
3 Cost of Capital 15%
4 Present Value of Cash flows(2/3) 266666.7
5 Net Present Value (4-1) 166666.7
cost of capital of the company remains consistent irrespective of capital structure as it with
increase in debt in the capital mix, the cost of debt initially decreased however the same
increase after a certain level of combination on account of cost of distress to equity
shareholders.
Further, the computation of Net Present value for an indefinite cash flow at specified discount
rate has been presented here-in-below:
Sl No Particulars Briefs
1 Investment 100000
2 Net Cash flow 40000
3 Cost of Capital 15%
4 Present Value of Cash flows(2/3) 266666.7
5 Net Present Value (4-1) 166666.7
Secure Best Marks with AI Grader
Need help grading? Try our AI Grader for instant feedback on your assignments.
Computation of Capital Structure under different scenario
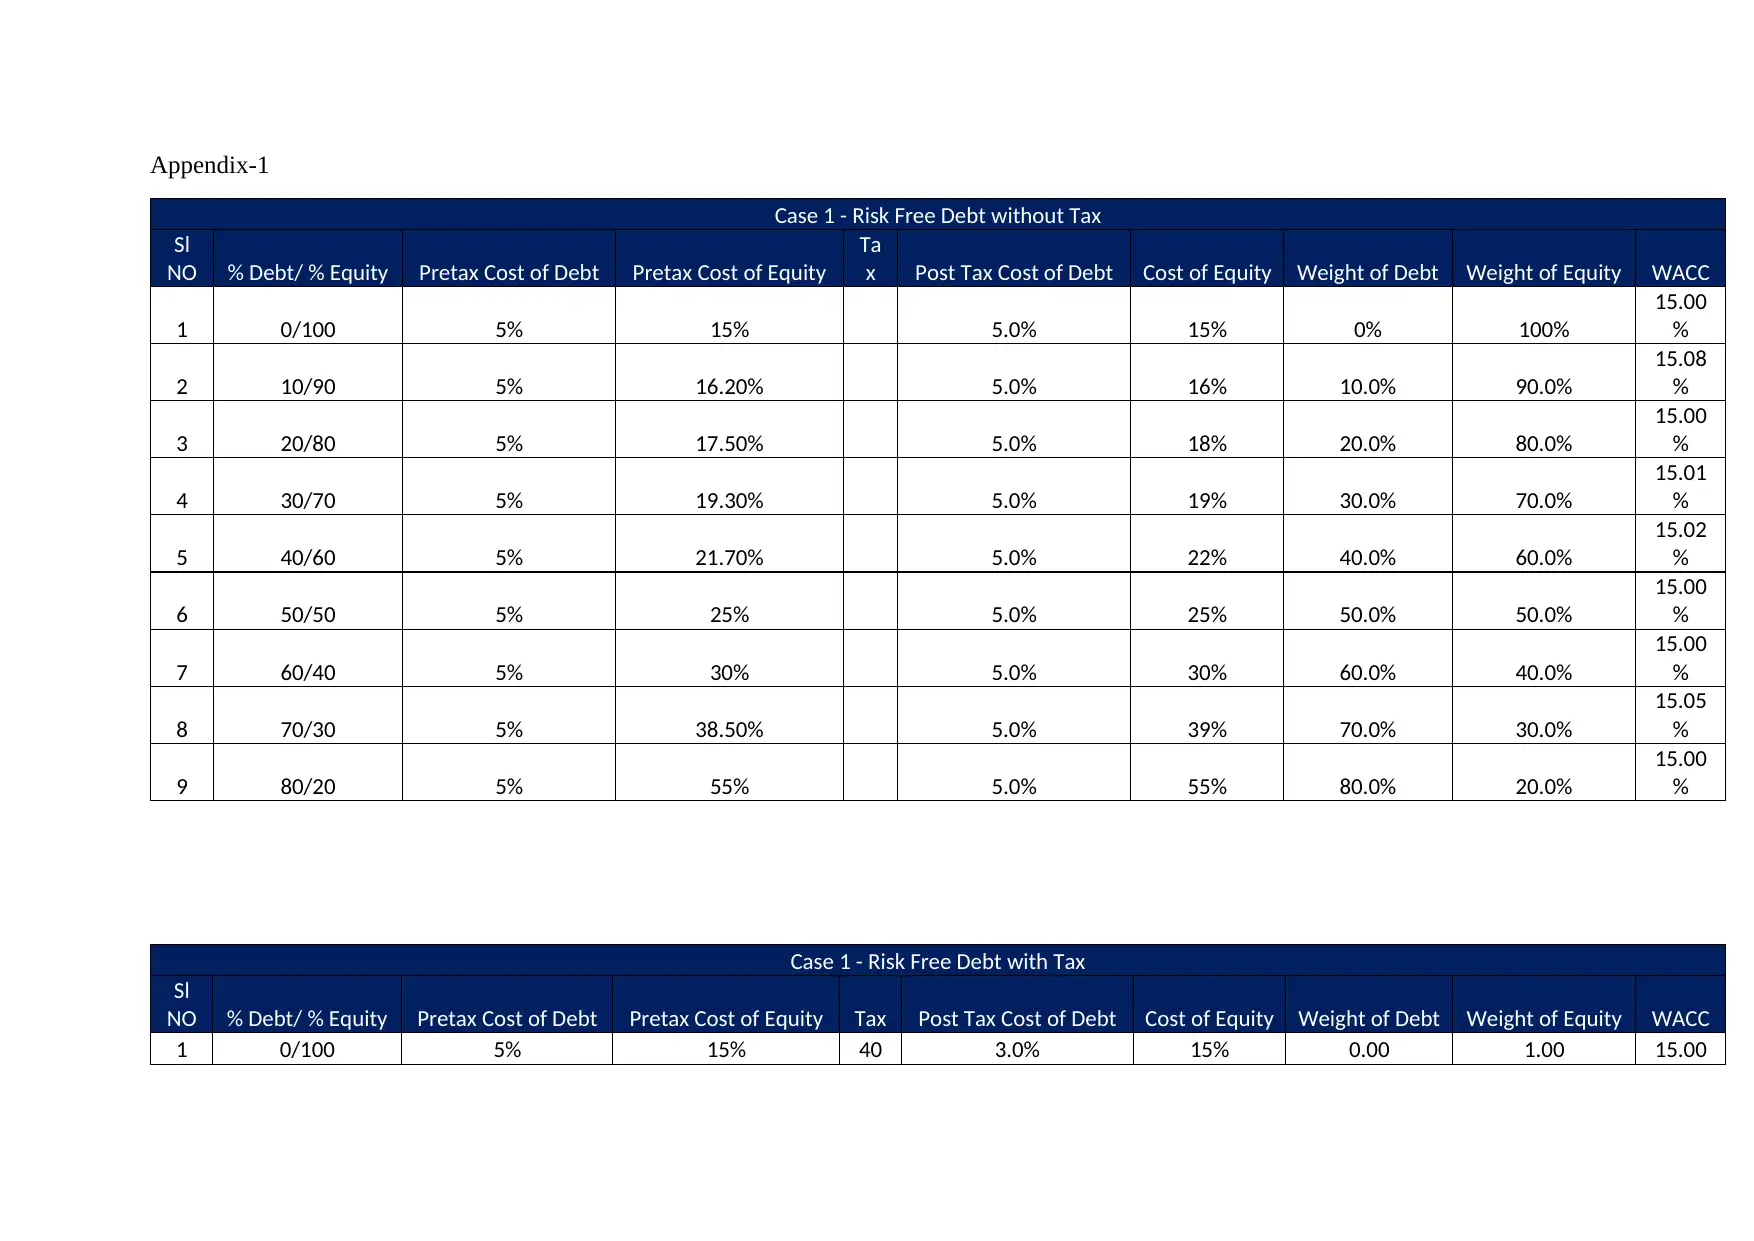
Case 1: Risk Free Debt without tax
Under the first scenario for optimising the capital structure, no tax has been assumed in the corporate world and the debt considered is risk free.
The analysis involves 9 scenarios with different combination of debt and equity with rate of debt remaining consistent throughout the analysis.
The cost of equity increases continuously over the analysis as the amount of debt increase on account of distress cost and other ancillary cost.
Further, there shall be benefit of trading on equity and investors seek excess return for their investment in equity.
The cost of capital under different capital structure has been presented here-in-below:
Case 1 - Risk Free Debt without Tax
Sl
NO
% Debt/ %
Equity
Pretax Cost of
Debt
Pretax Cost of
Equity
Ta
x
Post Tax Cost of
Debt
Cost of
Equity
Weight of
Debt
Weight of
Equity WACC
1 0/100 5% 15% 5.0% 15% 0% 100%
15.00
%
2 10/90 5% 16.20% 5.0% 16% 10.0% 90.0%
15.08
%
3 20/80 5% 17.50% 5.0% 18% 20.0% 80.0%
15.00
%
4 30/70 5% 19.30% 5.0% 19% 30.0% 70.0%
15.01
%
5 40/60 5% 21.70% 5.0% 22% 40.0% 60.0%
15.02
%
6 50/50 5% 25% 5.0% 25% 50.0% 50.0%
15.00
%
7 60/40 5% 30% 5.0% 30% 60.0% 40.0%
15.00
%
8 70/30 5% 38.50% 5.0% 39% 70.0% 30.0%
15.05
%
9 80/20 5% 55% 5.0% 55% 80.0% 20.0%
15.00
%
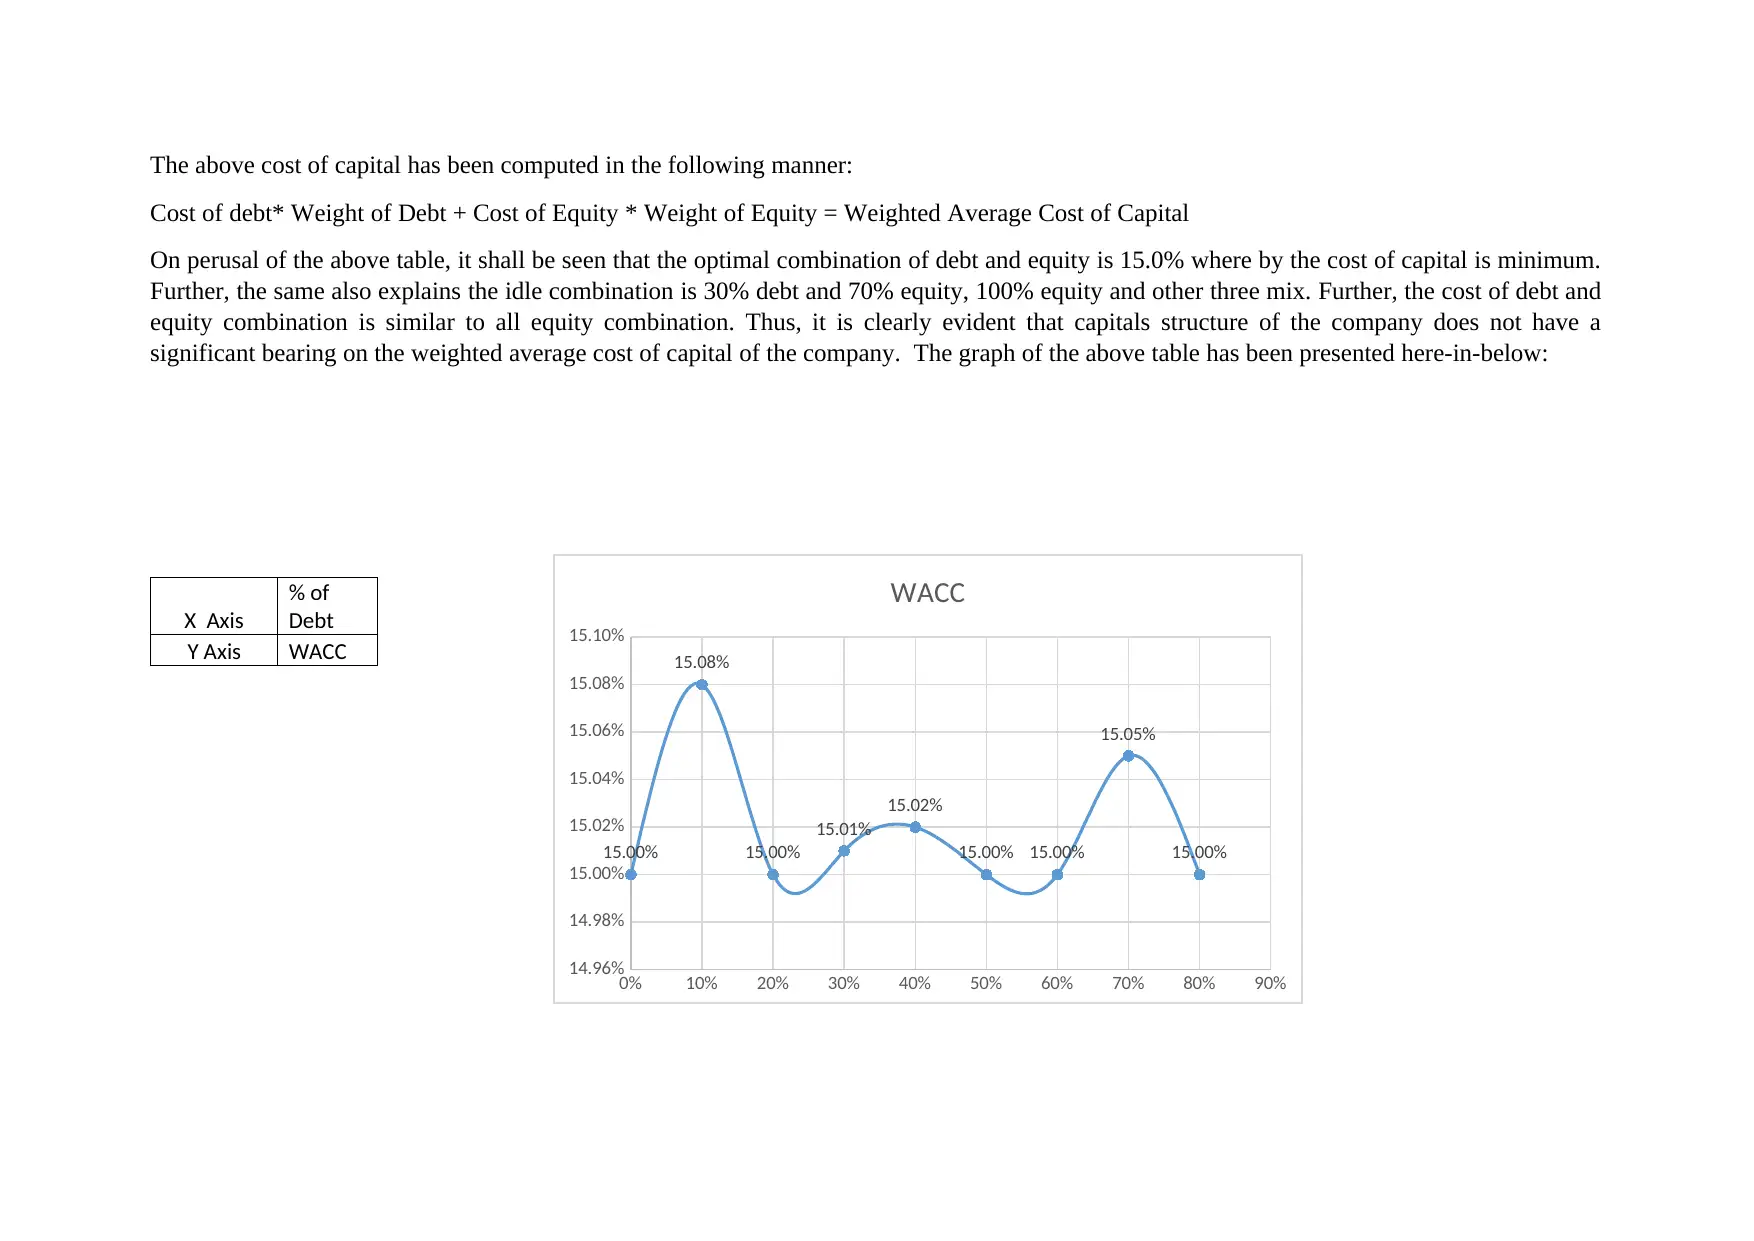
The above cost of capital has been computed in the following manner:
Cost of debt* Weight of Debt + Cost of Equity * Weight of Equity = Weighted Average Cost of Capital
On perusal of the above table, it shall be seen that the optimal combination of debt and equity is 15.0% where by the cost of capital is minimum.
Further, the same also explains the idle combination is 30% debt and 70% equity, 100% equity and other three mix. Further, the cost of debt and
equity combination is similar to all equity combination. Thus, it is clearly evident that capitals structure of the company does not have a
significant bearing on the weighted average cost of capital of the company. The graph of the above table has been presented here-in-below:
X Axis
% of
Debt
Y Axis WACC
0% 10% 20% 30% 40% 50% 60% 70% 80% 90%
14.96%
14.98%
15.00%
15.02%
15.04%
15.06%
15.08%
15.10%
15.00%
15.08%
15.00%
15.01%
15.02%
15.00% 15.00%
15.05%
15.00%
WACC
Thus, under the first scenario, the idle mix of debt and equity results in the optimal cost of capital of the company is 15.0%.
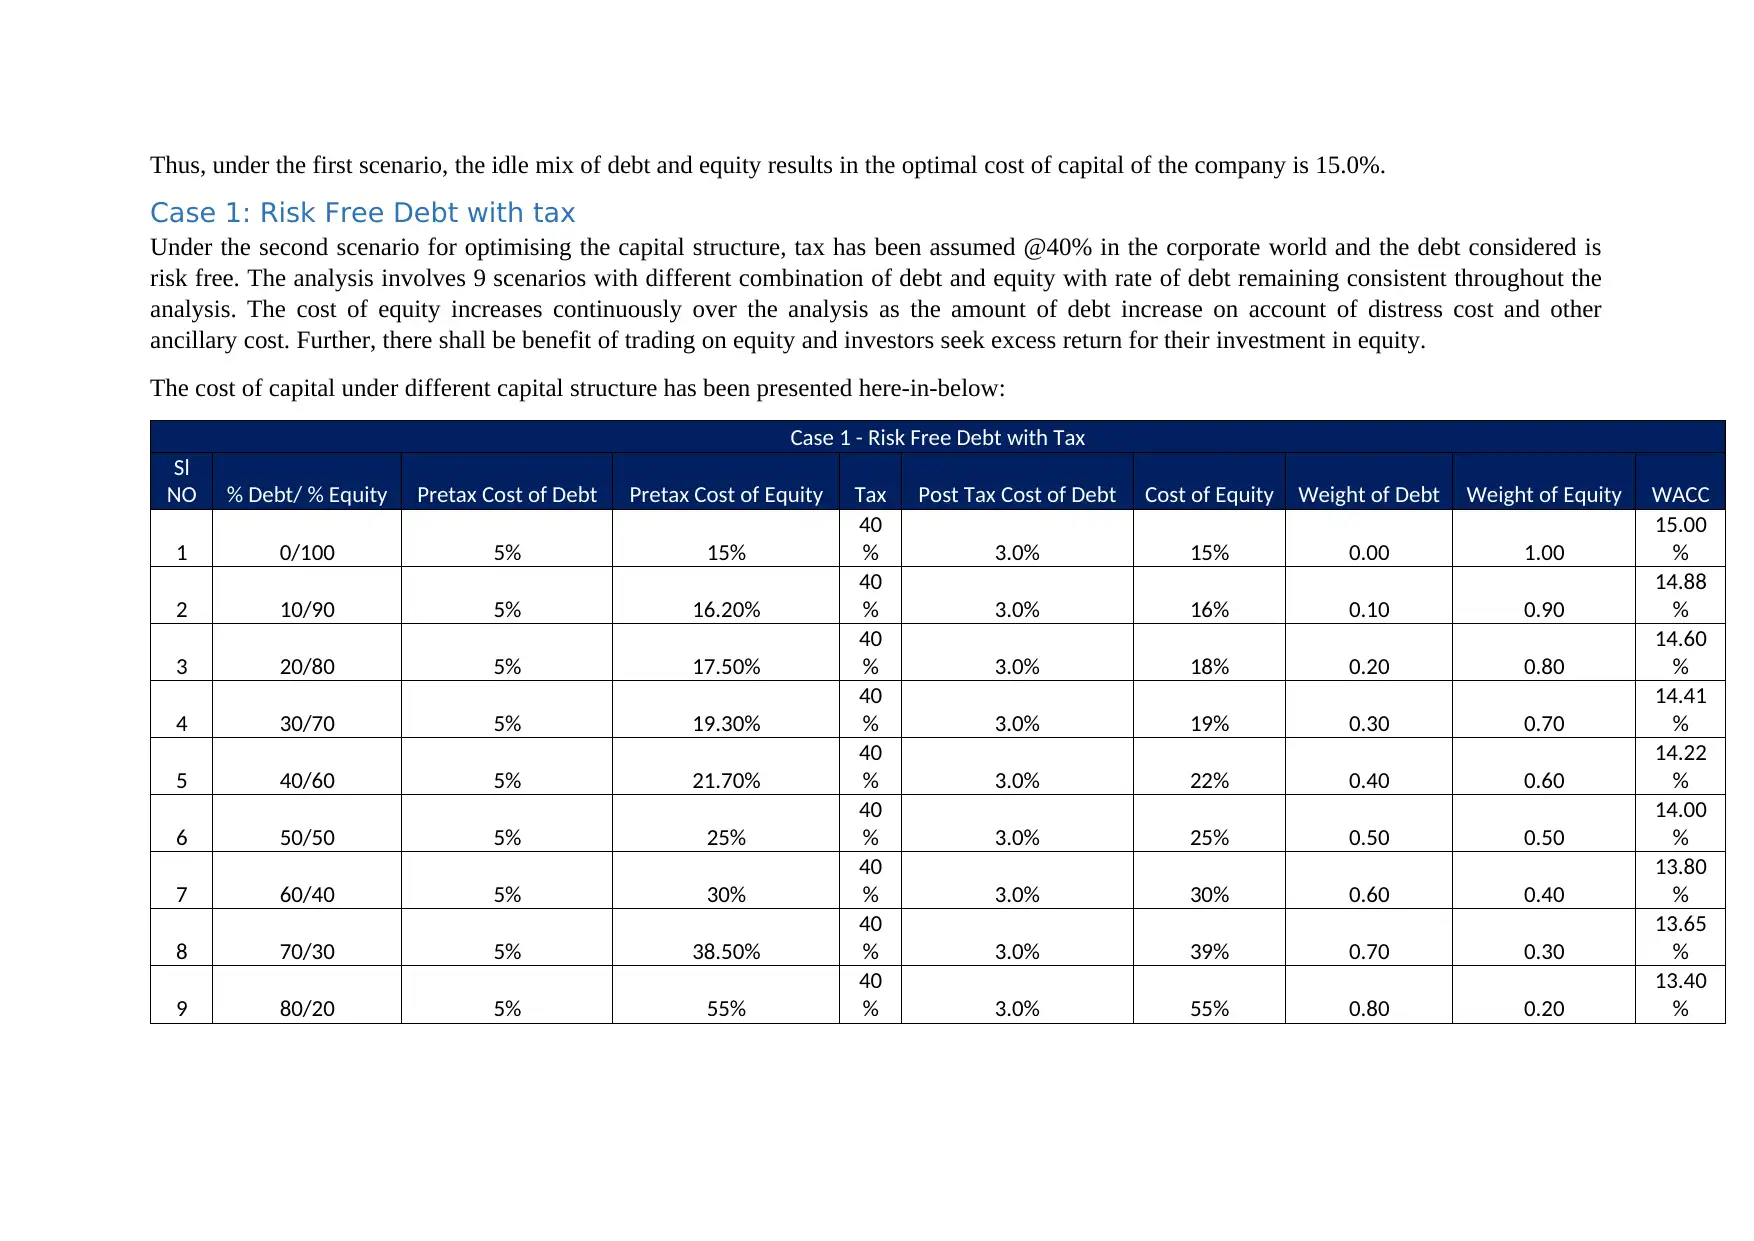
Case 1: Risk Free Debt with tax
Under the second scenario for optimising the capital structure, tax has been assumed @40% in the corporate world and the debt considered is
risk free. The analysis involves 9 scenarios with different combination of debt and equity with rate of debt remaining consistent throughout the
analysis. The cost of equity increases continuously over the analysis as the amount of debt increase on account of distress cost and other
ancillary cost. Further, there shall be benefit of trading on equity and investors seek excess return for their investment in equity.
The cost of capital under different capital structure has been presented here-in-below:
Case 1 - Risk Free Debt with Tax
Sl
NO % Debt/ % Equity Pretax Cost of Debt Pretax Cost of Equity Tax Post Tax Cost of Debt Cost of Equity Weight of Debt Weight of Equity WACC
1 0/100 5% 15%
40
% 3.0% 15% 0.00 1.00
15.00
%
2 10/90 5% 16.20%
40
% 3.0% 16% 0.10 0.90
14.88
%
3 20/80 5% 17.50%
40
% 3.0% 18% 0.20 0.80
14.60
%
4 30/70 5% 19.30%
40
% 3.0% 19% 0.30 0.70
14.41
%
5 40/60 5% 21.70%
40
% 3.0% 22% 0.40 0.60
14.22
%
6 50/50 5% 25%
40
% 3.0% 25% 0.50 0.50
14.00
%
7 60/40 5% 30%
40
% 3.0% 30% 0.60 0.40
13.80
%
8 70/30 5% 38.50%
40
% 3.0% 39% 0.70 0.30
13.65
%
9 80/20 5% 55%
40
% 3.0% 55% 0.80 0.20
13.40
%
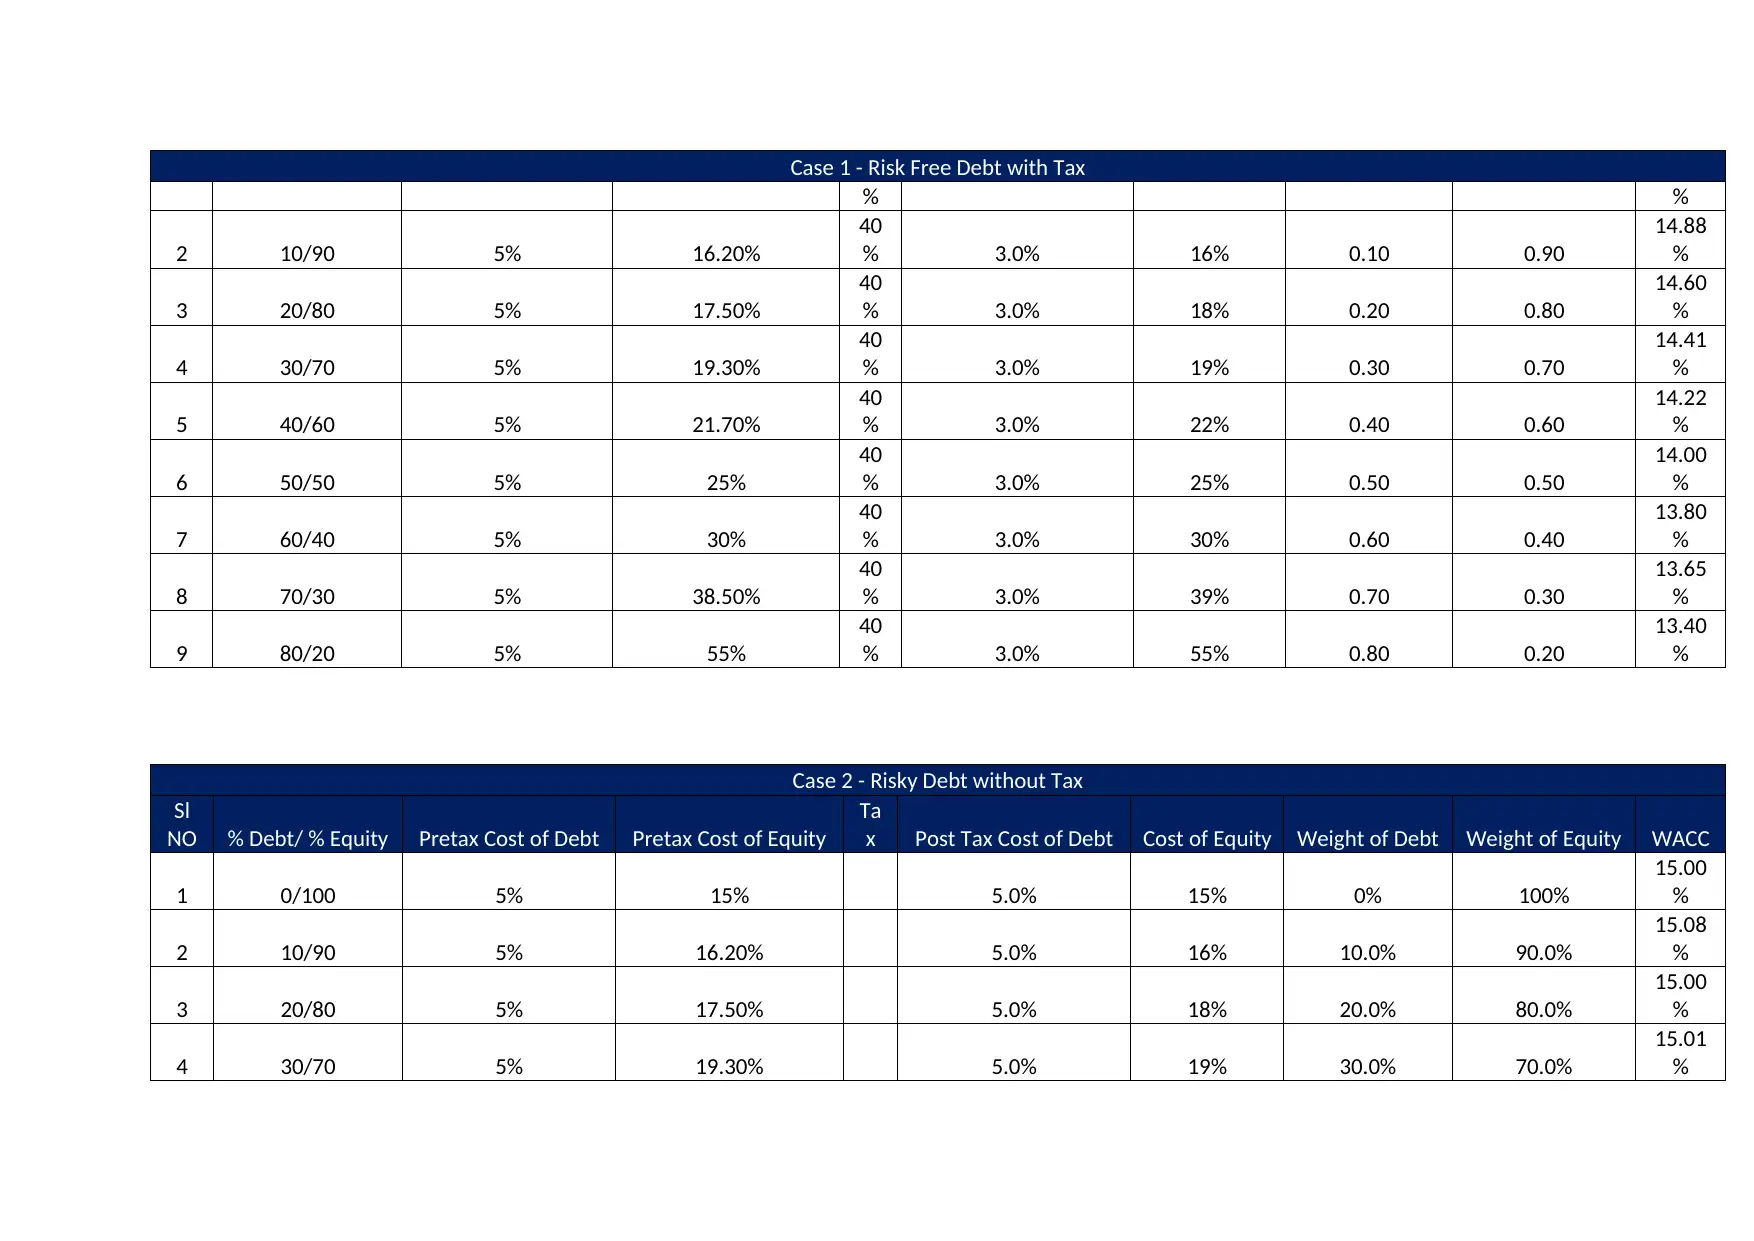
Paraphrase This Document
Need a fresh take? Get an instant paraphrase of this document with our AI Paraphraser
The above cost of capital has been computed in the following manner:
Cost of debt* Weight of Debt + Cost of Equity * Weight of Equity = Weighted Average Cost of Capital
On perusal of the above table, it shall be seen that the optimal combination of debt and equity is 80% debt and 20% equity whereby the cost of
capital of the company is 13.40% which is minimum. Further, the same also explains the Modigliani Miller approach proposition as the amount
of debt increases the company cost of capital decreases as evident in the above table. Further, it is evident that cost of capital of equity increases
as the proportion of debt increase in the portfolio. On the basis of above, it can be seen that capitals structure of the company does have a
significant bearing on the weighted average cost of capital of the company. The graph of the above table has been presented here-in-below:
X Axis
% of
Debt
Y Axis WACC
Thus, under the second scenario, the idle mix of debt and equity results in the optimal cost of capital of the company which is 13.40% and the
curve represented above is a down sloping curve.
0.00 0.10 0.20 0.30 0.40 0.50 0.60 0.70 0.80 0.90
12.50%
13.00%
13.50%
14.00%
14.50%
15.00%
15.50%
15.00% 14.88%
14.60%
14.41%
14.22%
14.00%
13.80% 13.65%
13.40%
WACC

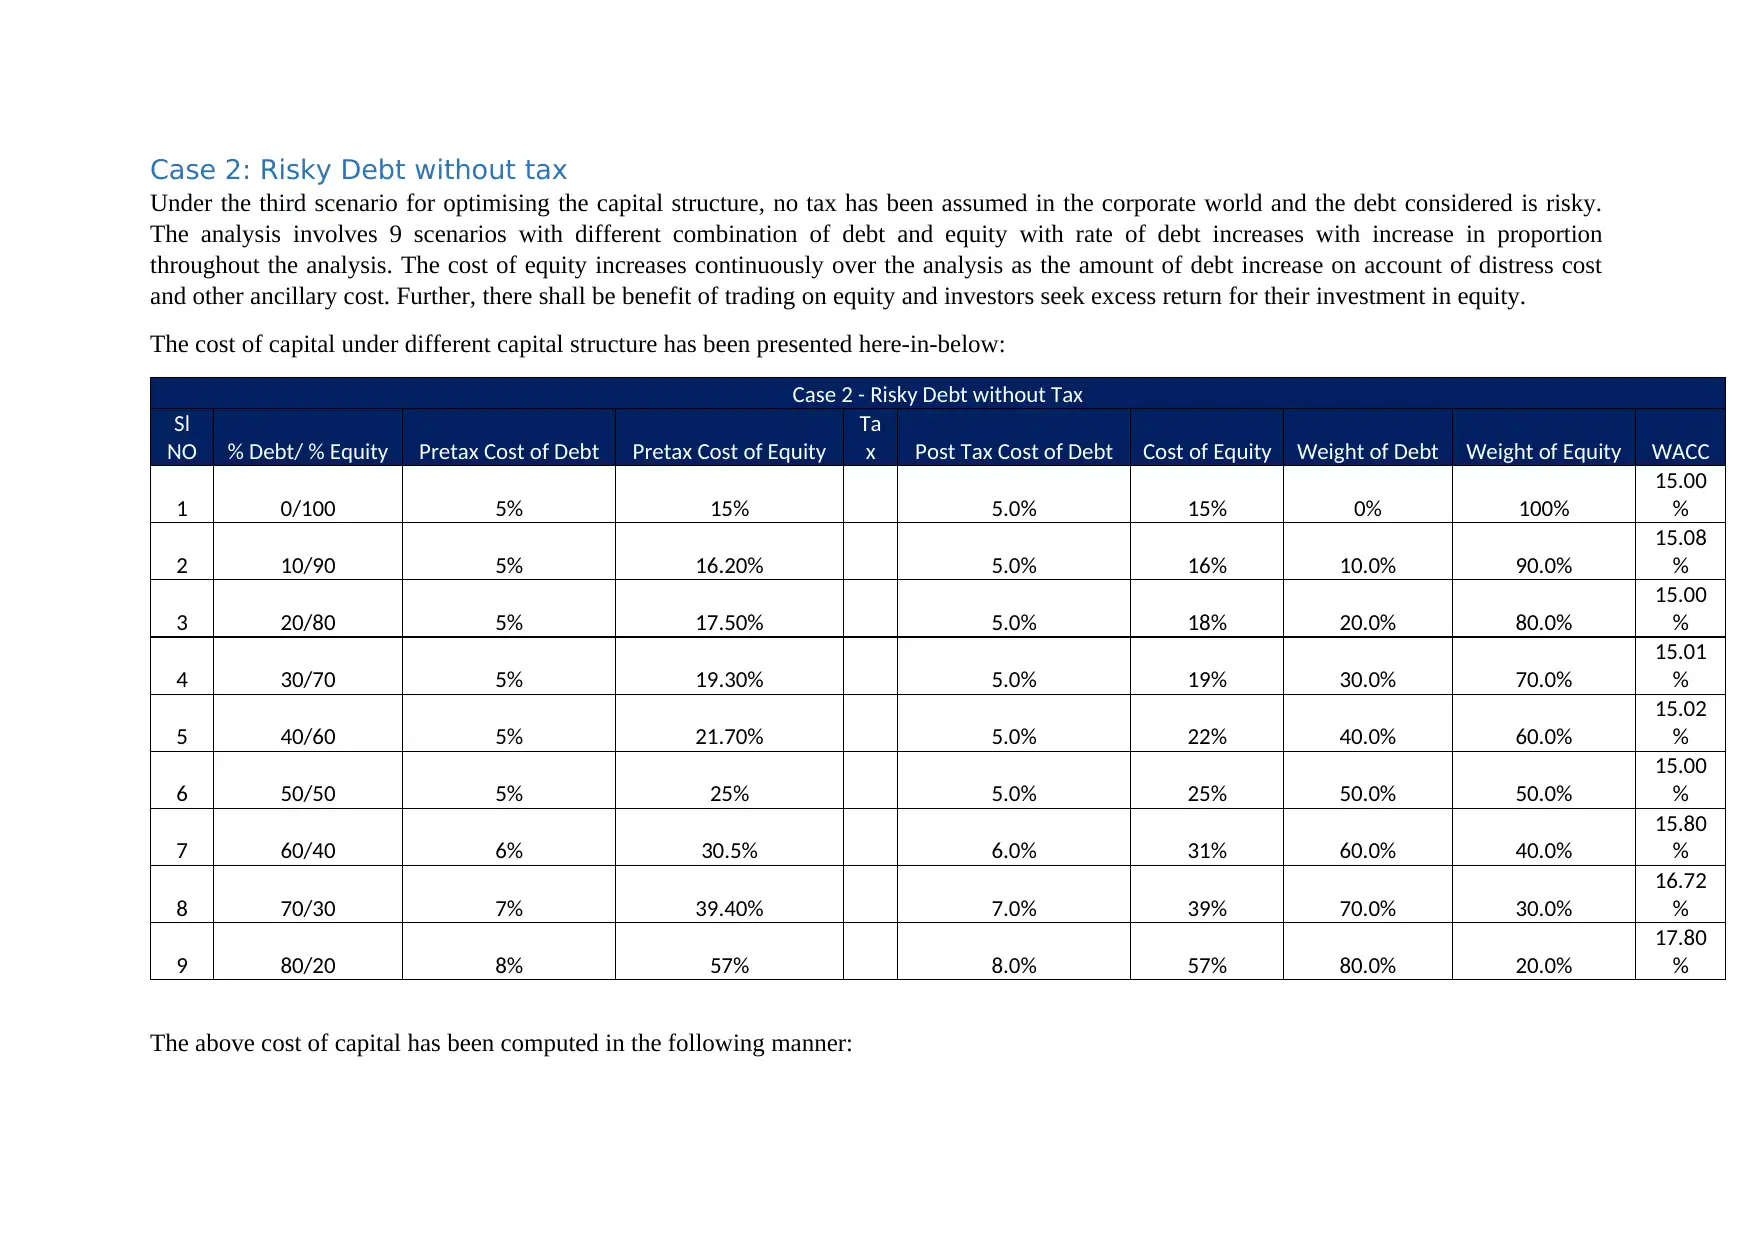
Case 2: Risky Debt without tax
Under the third scenario for optimising the capital structure, no tax has been assumed in the corporate world and the debt considered is risky.
The analysis involves 9 scenarios with different combination of debt and equity with rate of debt increases with increase in proportion
throughout the analysis. The cost of equity increases continuously over the analysis as the amount of debt increase on account of distress cost
and other ancillary cost. Further, there shall be benefit of trading on equity and investors seek excess return for their investment in equity.
The cost of capital under different capital structure has been presented here-in-below:
Case 2 - Risky Debt without Tax
Sl
NO % Debt/ % Equity Pretax Cost of Debt Pretax Cost of Equity
Ta
x Post Tax Cost of Debt Cost of Equity Weight of Debt Weight of Equity WACC
1 0/100 5% 15% 5.0% 15% 0% 100%
15.00
%
2 10/90 5% 16.20% 5.0% 16% 10.0% 90.0%
15.08
%
3 20/80 5% 17.50% 5.0% 18% 20.0% 80.0%
15.00
%
4 30/70 5% 19.30% 5.0% 19% 30.0% 70.0%
15.01
%
5 40/60 5% 21.70% 5.0% 22% 40.0% 60.0%
15.02
%
6 50/50 5% 25% 5.0% 25% 50.0% 50.0%
15.00
%
7 60/40 6% 30.5% 6.0% 31% 60.0% 40.0%
15.80
%
8 70/30 7% 39.40% 7.0% 39% 70.0% 30.0%
16.72
%
9 80/20 8% 57% 8.0% 57% 80.0% 20.0%
17.80
%
The above cost of capital has been computed in the following manner:
Secure Best Marks with AI Grader
Need help grading? Try our AI Grader for instant feedback on your assignments.
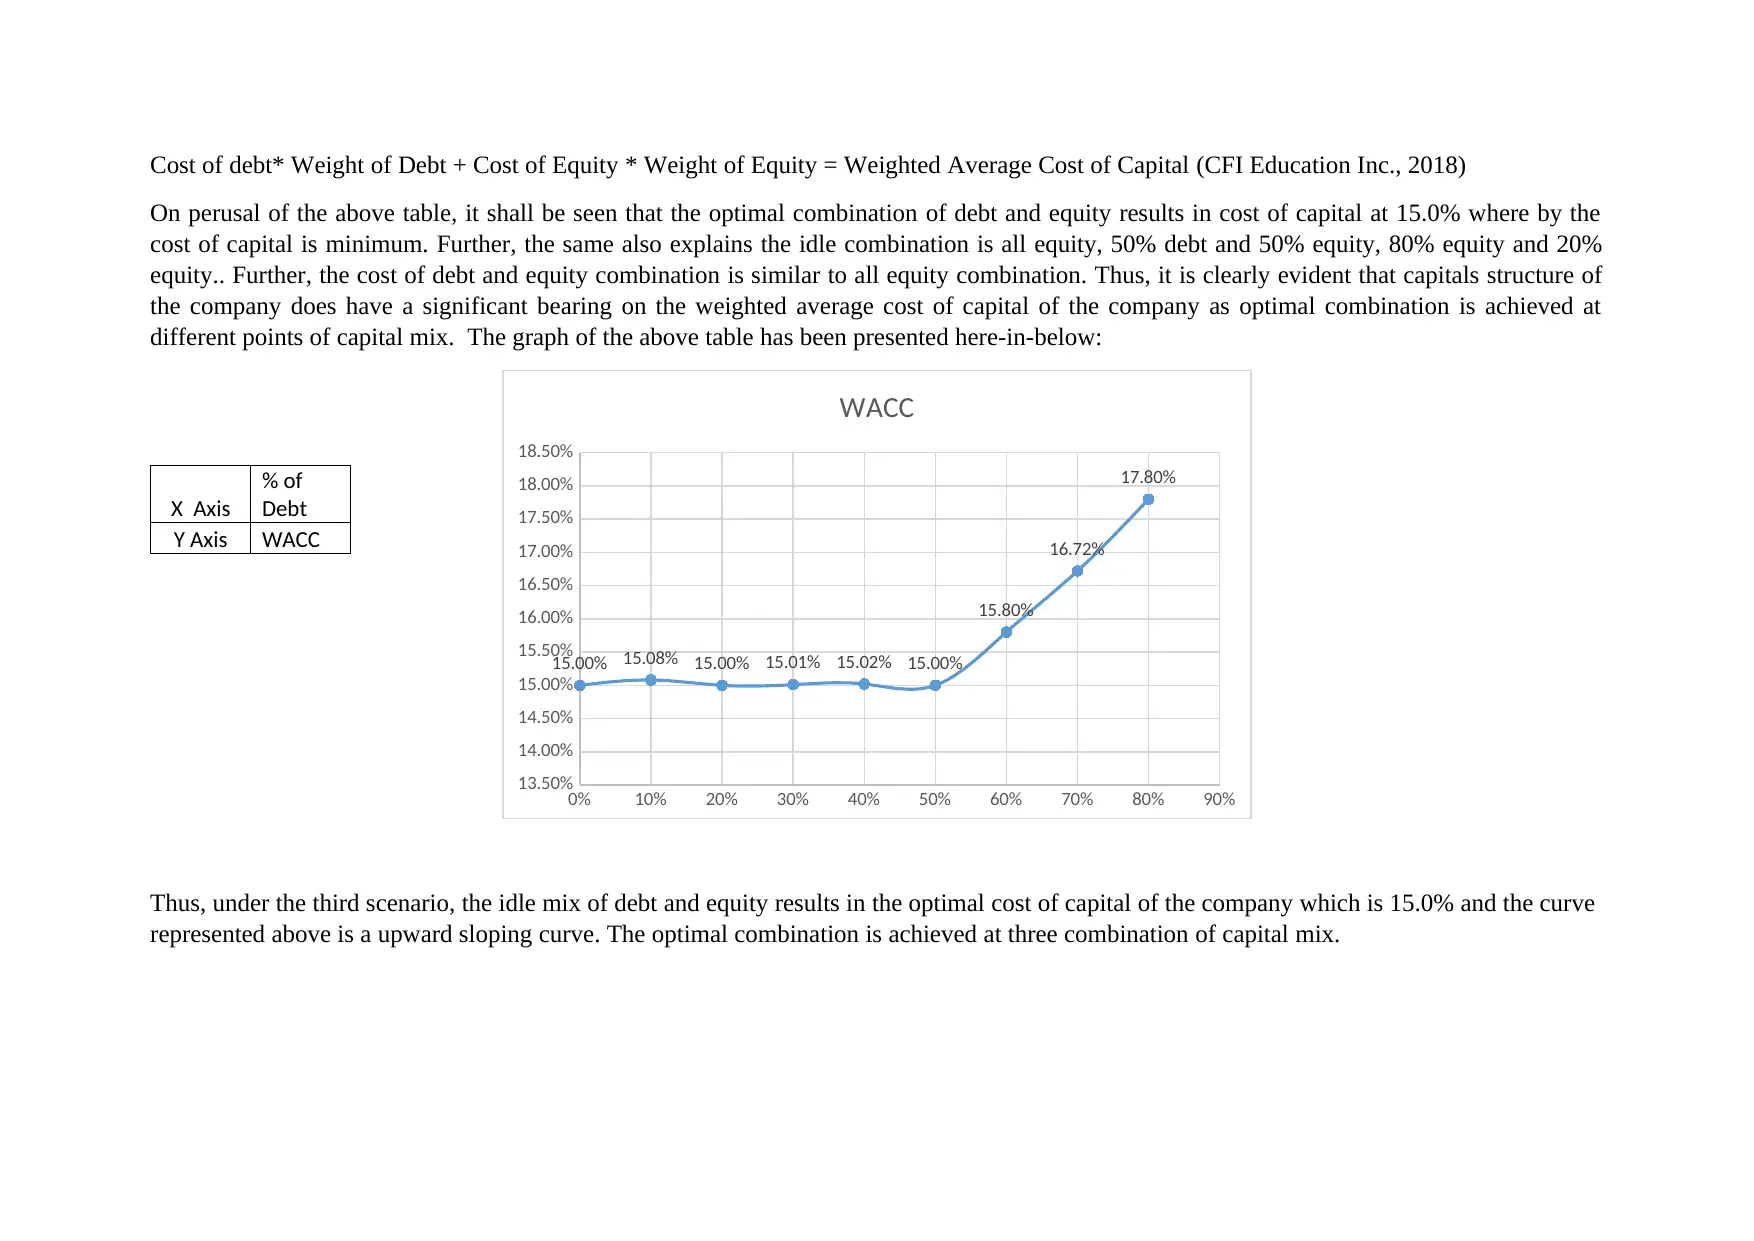
Cost of debt* Weight of Debt + Cost of Equity * Weight of Equity = Weighted Average Cost of Capital (CFI Education Inc., 2018)
On perusal of the above table, it shall be seen that the optimal combination of debt and equity results in cost of capital at 15.0% where by the
cost of capital is minimum. Further, the same also explains the idle combination is all equity, 50% debt and 50% equity, 80% equity and 20%
equity.. Further, the cost of debt and equity combination is similar to all equity combination. Thus, it is clearly evident that capitals structure of
the company does have a significant bearing on the weighted average cost of capital of the company as optimal combination is achieved at
different points of capital mix. The graph of the above table has been presented here-in-below:
X Axis
% of
Debt
Y Axis WACC
Thus, under the third scenario, the idle mix of debt and equity results in the optimal cost of capital of the company which is 15.0% and the curve
represented above is a upward sloping curve. The optimal combination is achieved at three combination of capital mix.
0% 10% 20% 30% 40% 50% 60% 70% 80% 90%
13.50%
14.00%
14.50%
15.00%
15.50%
16.00%
16.50%
17.00%
17.50%
18.00%
18.50%
15.00% 15.08% 15.00% 15.01% 15.02% 15.00%
15.80%
16.72%
17.80%
WACC

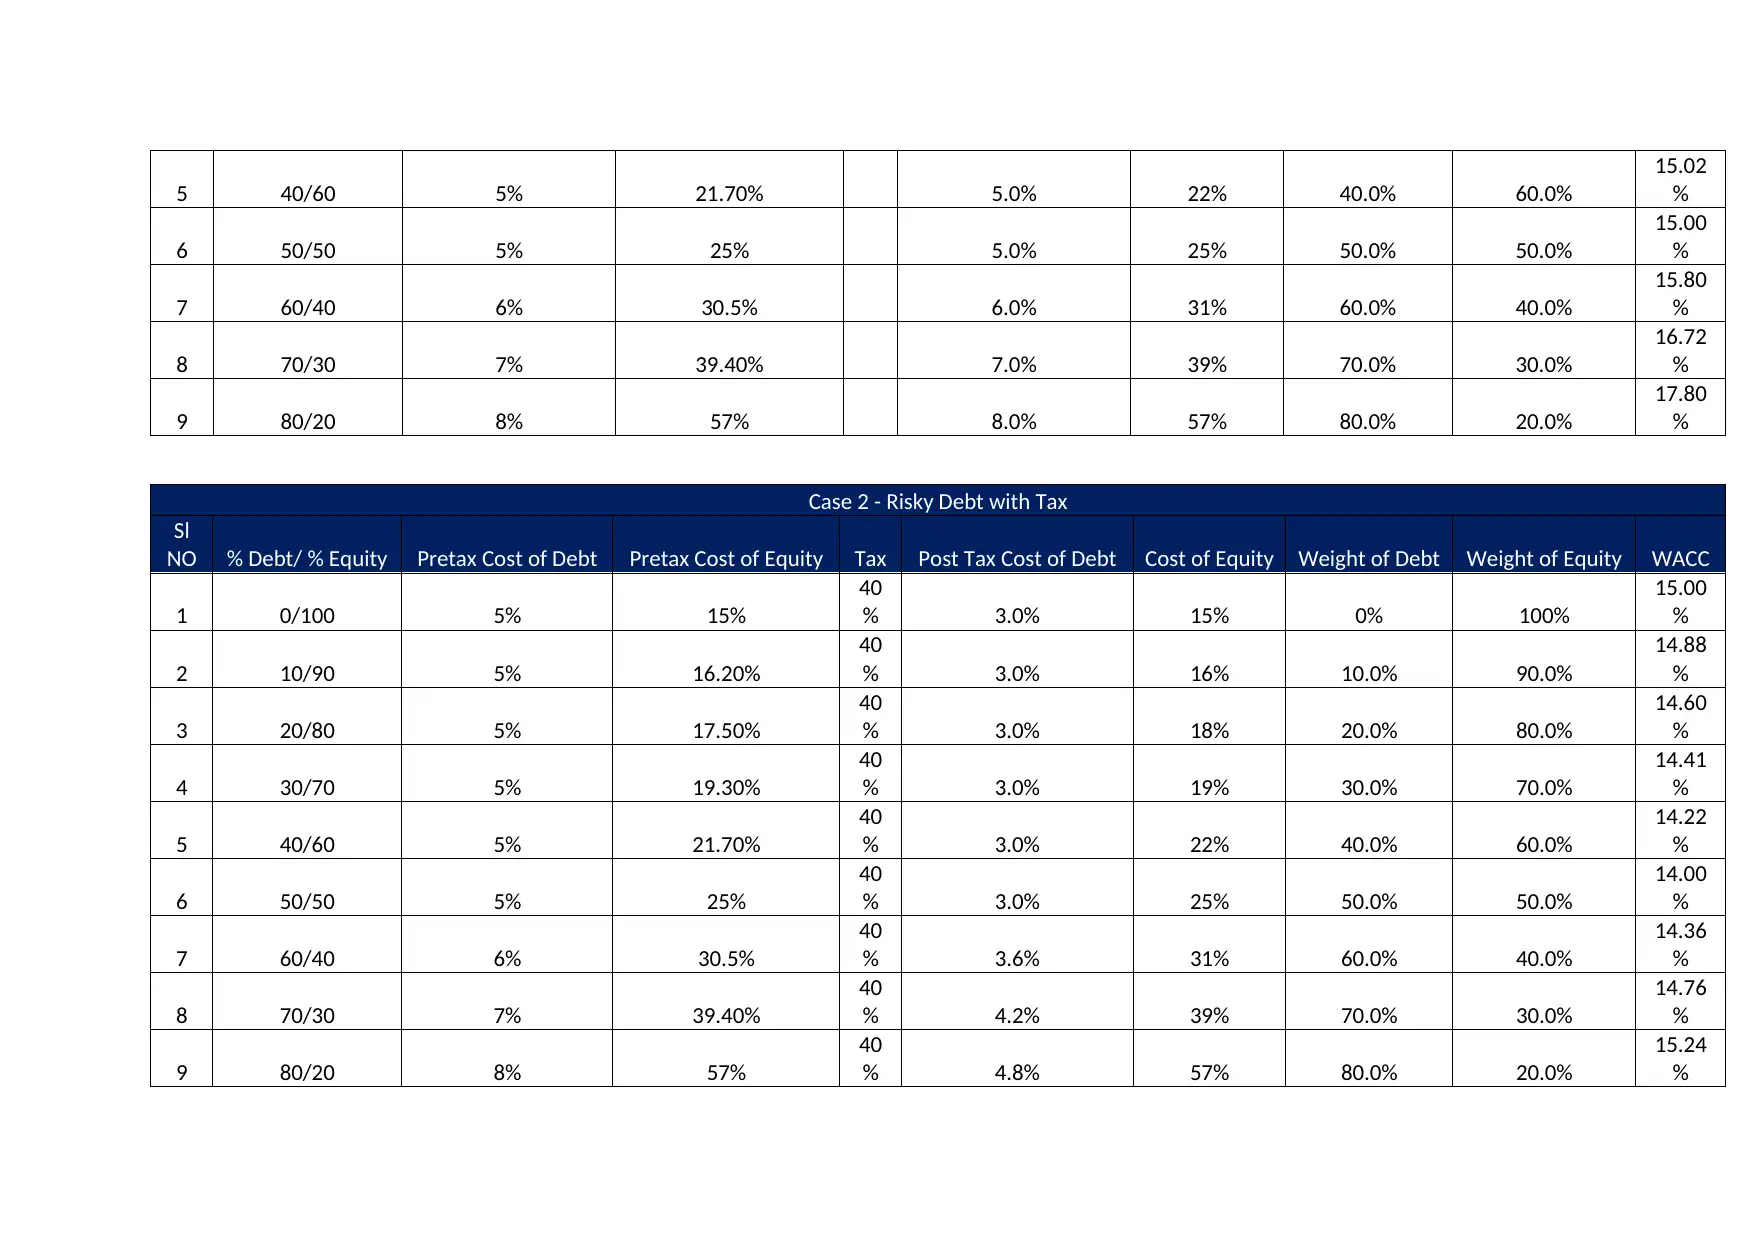
Case 2: Risky Debt with tax
Under the second scenario for optimising the capital structure, tax has been assumed @40% in the corporate world and the debt considered is
risky. The analysis involves 9 scenarios with different combination of debt and equity with rate of debt increasing at different level of analysis.
The cost of equity increases continuously over the analysis as the amount of debt increase on account of distress cost and other ancillary cost.
Further, there shall be benefit of trading on equity and investors seek excess return for their investment in equity.
The cost of capital under different capital structure has been presented here-in-below:
Case 2 - Risky Debt with Tax
Sl
NO % Debt/ % Equity Pretax Cost of Debt Pretax Cost of Equity Tax Post Tax Cost of Debt Cost of Equity Weight of Debt Weight of Equity WACC
1 0/100 5% 15%
40
% 3.0% 15% 0% 100%
15.00
%
2 10/90 5% 16.20%
40
% 3.0% 16% 10.0% 90.0%
14.88
%
3 20/80 5% 17.50%
40
% 3.0% 18% 20.0% 80.0%
14.60
%
4 30/70 5% 19.30%
40
% 3.0% 19% 30.0% 70.0%
14.41
%
5 40/60 5% 21.70%
40
% 3.0% 22% 40.0% 60.0%
14.22
%
6 50/50 5% 25%
40
% 3.0% 25% 50.0% 50.0%
14.00
%
7 60/40 6% 30.5%
40
% 3.6% 31% 60.0% 40.0%
14.36
%
8 70/30 7% 39.40%
40
% 4.2% 39% 70.0% 30.0%
14.76
%
9 80/20 8% 57%
40
% 4.8% 57% 80.0% 20.0%
15.24
%
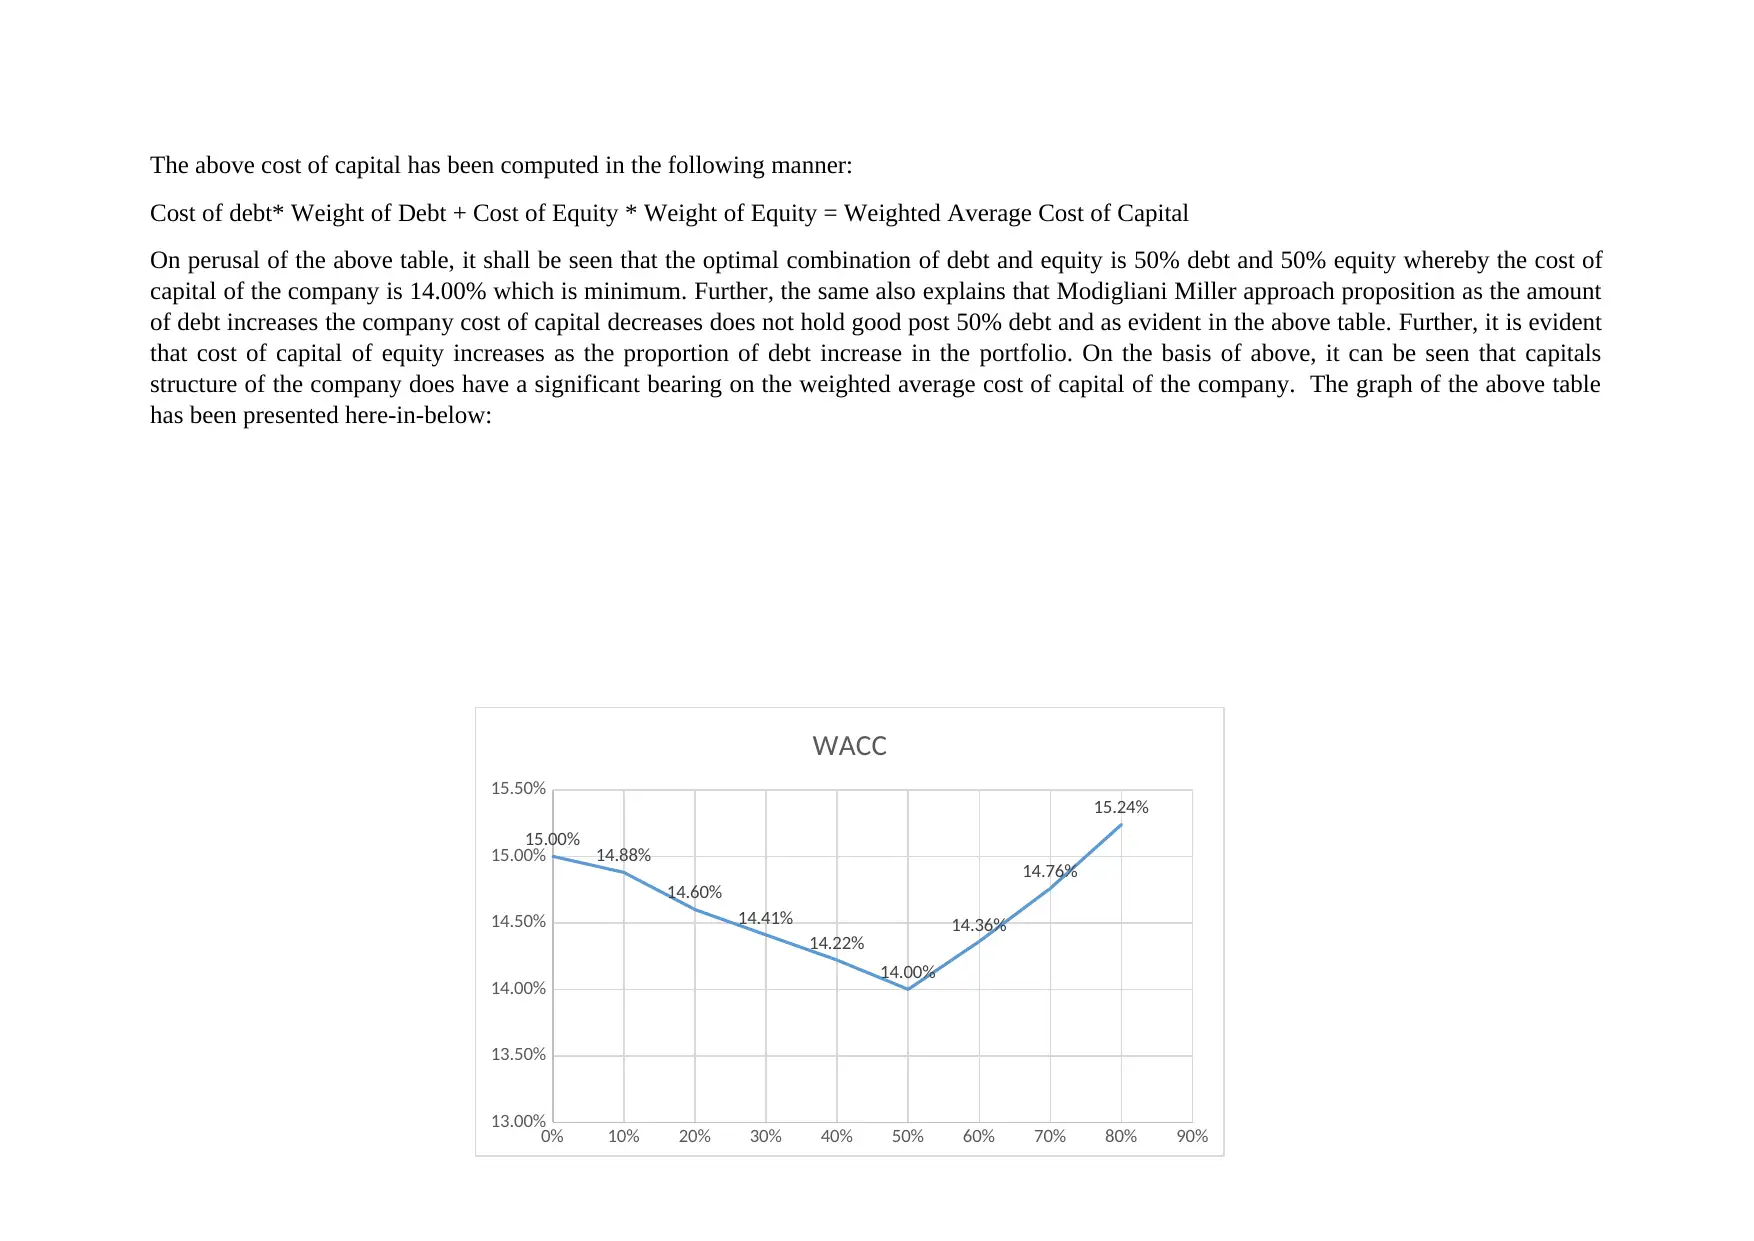
The above cost of capital has been computed in the following manner:
Cost of debt* Weight of Debt + Cost of Equity * Weight of Equity = Weighted Average Cost of Capital
On perusal of the above table, it shall be seen that the optimal combination of debt and equity is 50% debt and 50% equity whereby the cost of
capital of the company is 14.00% which is minimum. Further, the same also explains that Modigliani Miller approach proposition as the amount
of debt increases the company cost of capital decreases does not hold good post 50% debt and as evident in the above table. Further, it is evident
that cost of capital of equity increases as the proportion of debt increase in the portfolio. On the basis of above, it can be seen that capitals
structure of the company does have a significant bearing on the weighted average cost of capital of the company. The graph of the above table
has been presented here-in-below:
0% 10% 20% 30% 40% 50% 60% 70% 80% 90%
13.00%
13.50%
14.00%
14.50%
15.00%
15.50%
15.00% 14.88%
14.60%
14.41%
14.22%
14.00%
14.36%
14.76%
15.24%
WACC
Paraphrase This Document
Need a fresh take? Get an instant paraphrase of this document with our AI Paraphraser
Thus, under the fourth scenario, the idle mix of debt and equity results in the optimal cost of capital of the company which is 14.00% and the
curve represented above is a V shaped and represent a true and real market scenario.
Conclusion: Fourth Scenario is the most practical scenario.
Problems under Capital Financing
Agency Theory: The theory states that managers of the company generally do not act in the best interest of the shareholders of the company.
Further, the said theory has been highlighted by Jensen and Meckling by identifying two main conflicts:
(a) Conflict between the managers and shareholders of the company;
(b) Conflict between the shareholders and the creditors of the company.
Under the first conflict it is generally believed that manager generally pursue those course of action which results in personal gain of the
investors at the cost of the shareholders of the company. Further, under the second conflict, it is inferred that debt provides incentives to
shareholders of the company to invest sub optimally on account of benefit of trading on equity. It also provides them with the benefit of limited
liability in case the project fails. (University Van Pretoria, n.d.)
Further, the concern is that in case the company is on the verge on bankruptcy, there are generally no inventive to shareholders to infuse more
capital even if NPV projects are available as the major benefit of the project shall accrue to debt holders.
Thus, under agency theory a significant relationship exist between the insider ownership and leverage and it has been established that agency
costs are associated with shifts in Leverage. Thus, it can be concluded that agency theory do impact the decision of financing under different
scenario.
In the present case, the project can be funded by debt in majority if investors are not willing to plunge in their capital or when managers want to
increase their remuneration by increasing the earning per share of the company or on account of any allied reason. Thus, agency cost have an
impact on the current project. However, the same shall be mitigated by making an appropriate combination of debt and cost that benefit
shareholders, debtholders and management of the company. (University Van Pretoria, n.d.)
Signalling Effect: The said theory emerges on account of asymmetric information between the owners of the company and the persons who are
managing the company generally the mangers. This is on account of separate legal existence of the company. Under, the said theory, if the
management feels that the company is undervalue, they generally prefer to issue debt and conversely if the management hold the view that
company is overvalued they shall issue equity to balance the same. The term was coined by Mr.Ross who stated that if the managers of the
company have insider information, their choice of instrument for funding shall send signals to the market regarding undervaluation and over
valuation. Further, the same indicated the confidence of manager regarding the future prospects of the company (Novinson, 2011).
However, taking debt entitles the firm to make payment to debt holders before any payment is made to shareholders of the company and
shareholders are residual claimants of the cash flows of the company. Thus, announcement of debt or equity have impact on the share prices of
the company and correspondingly on the wealth of the shareholders. An announcement of debt leads to increase in the value of shares and
increasing the wealth of shareholders and vice versa. (Novinson, 2011)
Accordingly, signalling effect will try to time equity issues based on market assessment of their shares. For example Baker and Wrugler in 2002
report have established a strong relationship between the decision of finance and impact on the value of equity of the company. Thus, in short
can be concluded that decision regarding capital structure of the firm is the net cumulative result of the corporate manager past attempt to time
the market. Thus, signalling effect have a strong impact on the share prices of the company and correspondingly on the firm value. Thus, an
appropriate concern should be placed on the method of raising finance for the project whether the same shall be equity financing or debt
financing.
Conclusion
On the basis of above case deliberations, it shall be practical for the company to switch to model 4 for the company and chose 50% debt and
50% equity to finance the proposed project as the said scenario is practical and in line with the management expectation. Under the said
scenario, the MM proposition fail and capital structure is relevant for the purpose of decision making. Further, it is an idle combination and shall
take care of the signalling effect as no negative shall flow through such decision and shall appear as a cautious step on the part of the
management of the company. In addition to above, it shall not impact the agency cost to a significant level as none of the investors are hurt and
the benefit of the proposed investment shall be shared equally among the debt and equity shareholders of the company.
References
CFI Education Inc., 2018. WACC. [Online]
Available at: https://corporatefinanceinstitute.com/resources/knowledge/finance/what-is-wacc-formula/
[Accessed 20 October 2018].
Novinson, E., 2011. What Are Signaling Effects in Capital Structure?. [Online]
Available at: https://www.sapling.com/7743194/signaling-effects-capital-structure
[Accessed 20 October 2018].
University Van Pretoria, n.d. THE THEORY OF CAPITAL STRUCTURE. [Online]
Available at: https://repository.up.ac.za/bitstream/handle/2263/23951/02chapter2.pdf
[Accessed 20 October 2018].
Secure Best Marks with AI Grader
Need help grading? Try our AI Grader for instant feedback on your assignments.
Appendix-1
Case 1 - Risk Free Debt without Tax
Sl
NO % Debt/ % Equity Pretax Cost of Debt Pretax Cost of Equity
Ta
x Post Tax Cost of Debt Cost of Equity Weight of Debt Weight of Equity WACC
1 0/100 5% 15% 5.0% 15% 0% 100%
15.00
%
2 10/90 5% 16.20% 5.0% 16% 10.0% 90.0%
15.08
%
3 20/80 5% 17.50% 5.0% 18% 20.0% 80.0%
15.00
%
4 30/70 5% 19.30% 5.0% 19% 30.0% 70.0%
15.01
%
5 40/60 5% 21.70% 5.0% 22% 40.0% 60.0%
15.02
%
6 50/50 5% 25% 5.0% 25% 50.0% 50.0%
15.00
%
7 60/40 5% 30% 5.0% 30% 60.0% 40.0%
15.00
%
8 70/30 5% 38.50% 5.0% 39% 70.0% 30.0%
15.05
%
9 80/20 5% 55% 5.0% 55% 80.0% 20.0%
15.00
%
Case 1 - Risk Free Debt with Tax
Sl
NO % Debt/ % Equity Pretax Cost of Debt Pretax Cost of Equity Tax Post Tax Cost of Debt Cost of Equity Weight of Debt Weight of Equity WACC
1 0/100 5% 15% 40 3.0% 15% 0.00 1.00 15.00
Case 1 - Risk Free Debt with Tax
% %
2 10/90 5% 16.20%
40
% 3.0% 16% 0.10 0.90
14.88
%
3 20/80 5% 17.50%
40
% 3.0% 18% 0.20 0.80
14.60
%
4 30/70 5% 19.30%
40
% 3.0% 19% 0.30 0.70
14.41
%
5 40/60 5% 21.70%
40
% 3.0% 22% 0.40 0.60
14.22
%
6 50/50 5% 25%
40
% 3.0% 25% 0.50 0.50
14.00
%
7 60/40 5% 30%
40
% 3.0% 30% 0.60 0.40
13.80
%
8 70/30 5% 38.50%
40
% 3.0% 39% 0.70 0.30
13.65
%
9 80/20 5% 55%
40
% 3.0% 55% 0.80 0.20
13.40
%
Case 2 - Risky Debt without Tax
Sl
NO % Debt/ % Equity Pretax Cost of Debt Pretax Cost of Equity
Ta
x Post Tax Cost of Debt Cost of Equity Weight of Debt Weight of Equity WACC
1 0/100 5% 15% 5.0% 15% 0% 100%
15.00
%
2 10/90 5% 16.20% 5.0% 16% 10.0% 90.0%
15.08
%
3 20/80 5% 17.50% 5.0% 18% 20.0% 80.0%
15.00
%
4 30/70 5% 19.30% 5.0% 19% 30.0% 70.0%
15.01
%
5 40/60 5% 21.70% 5.0% 22% 40.0% 60.0%
15.02
%
6 50/50 5% 25% 5.0% 25% 50.0% 50.0%
15.00
%
7 60/40 6% 30.5% 6.0% 31% 60.0% 40.0%
15.80
%
8 70/30 7% 39.40% 7.0% 39% 70.0% 30.0%
16.72
%
9 80/20 8% 57% 8.0% 57% 80.0% 20.0%
17.80
%
Case 2 - Risky Debt with Tax
Sl
NO % Debt/ % Equity Pretax Cost of Debt Pretax Cost of Equity Tax Post Tax Cost of Debt Cost of Equity Weight of Debt Weight of Equity WACC
1 0/100 5% 15%
40
% 3.0% 15% 0% 100%
15.00
%
2 10/90 5% 16.20%
40
% 3.0% 16% 10.0% 90.0%
14.88
%
3 20/80 5% 17.50%
40
% 3.0% 18% 20.0% 80.0%
14.60
%
4 30/70 5% 19.30%
40
% 3.0% 19% 30.0% 70.0%
14.41
%
5 40/60 5% 21.70%
40
% 3.0% 22% 40.0% 60.0%
14.22
%
6 50/50 5% 25%
40
% 3.0% 25% 50.0% 50.0%
14.00
%
7 60/40 6% 30.5%
40
% 3.6% 31% 60.0% 40.0%
14.36
%
8 70/30 7% 39.40%
40
% 4.2% 39% 70.0% 30.0%
14.76
%
9 80/20 8% 57%
40
% 4.8% 57% 80.0% 20.0%
15.24
%
Paraphrase This Document
Need a fresh take? Get an instant paraphrase of this document with our AI Paraphraser

1 out of 20
Related Documents


Your All-in-One AI-Powered Toolkit for Academic Success.
+13062052269
info@desklib.com
Available 24*7 on WhatsApp / Email
![[object Object]](/_next/static/media/star-bottom.7253800d.svg)
Unlock your academic potential
© 2024 | Zucol Services PVT LTD | All rights reserved.