Car Driving Simulation Report: BMW, GM, Toyota Fuel Efficiency
VerifiedAdded on 2022/09/12
|10
|1197
|18
Report
AI Summary
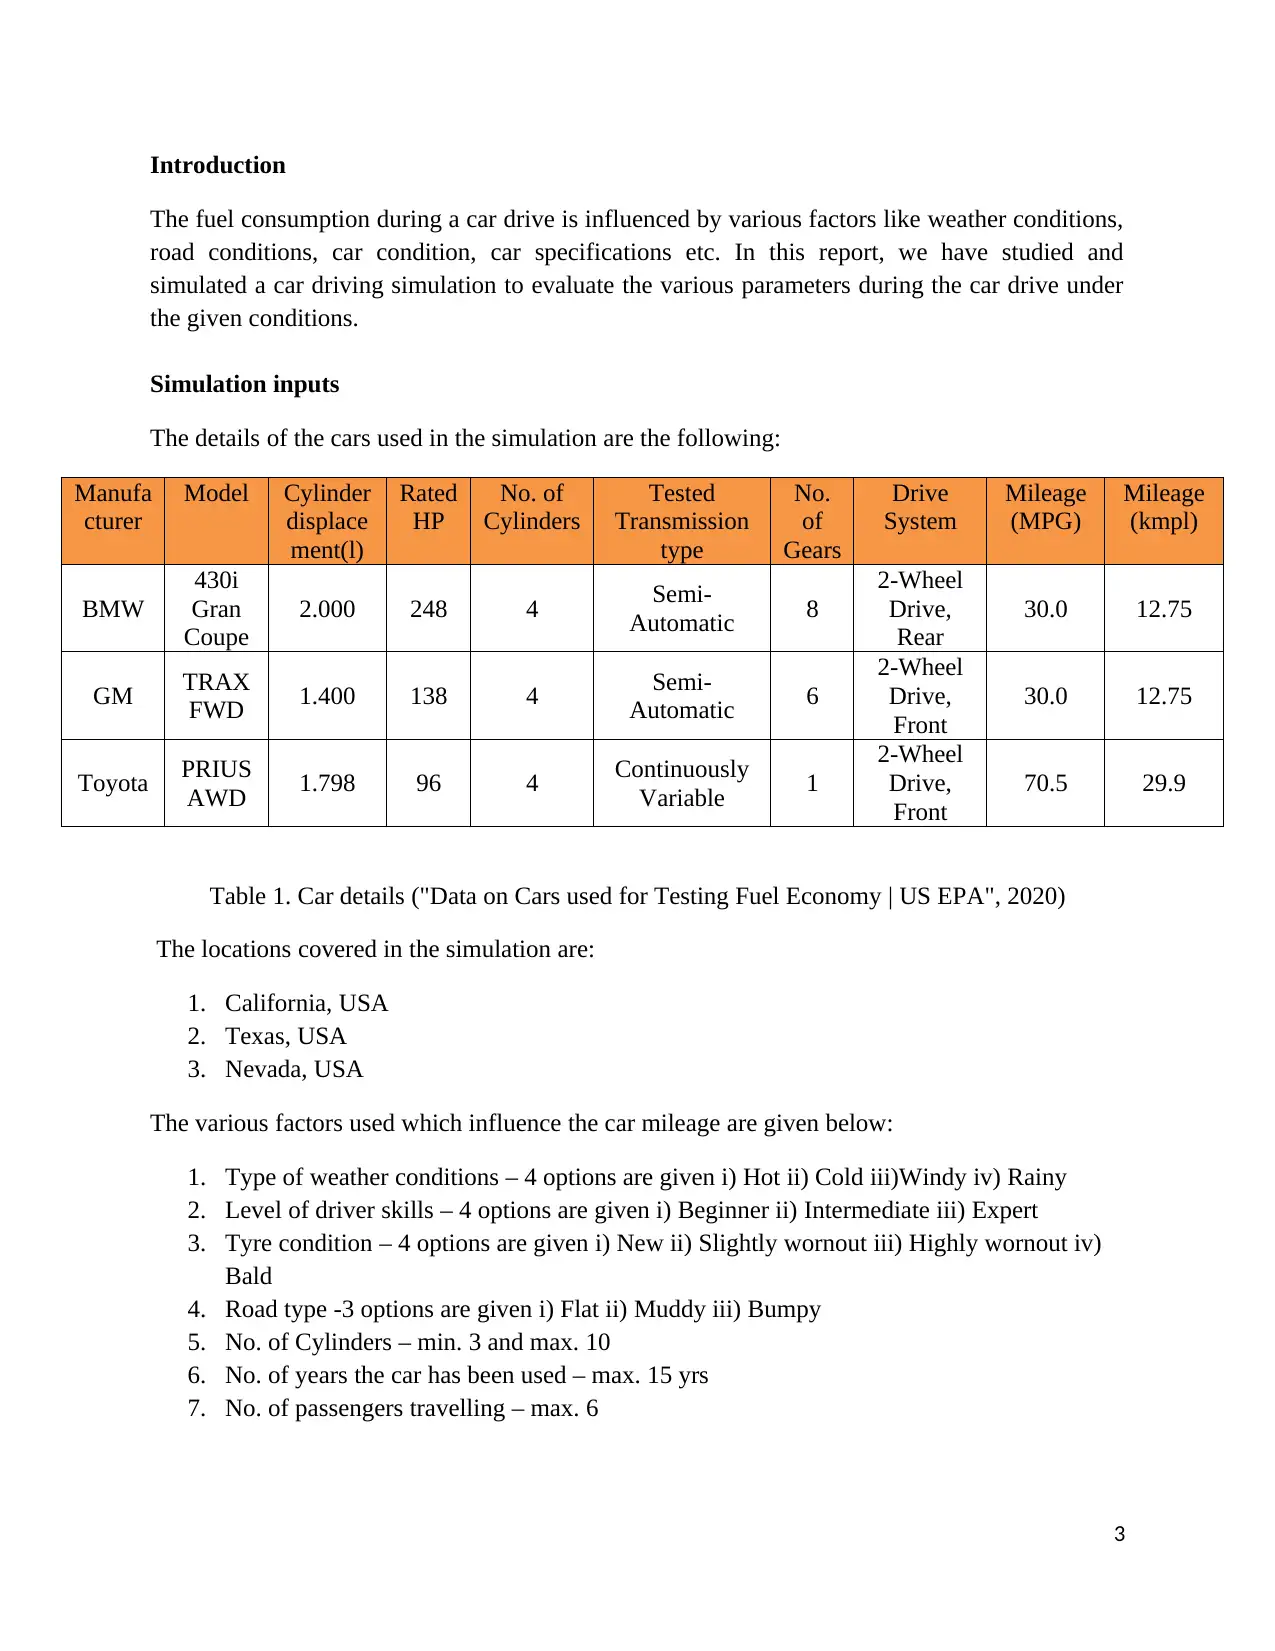
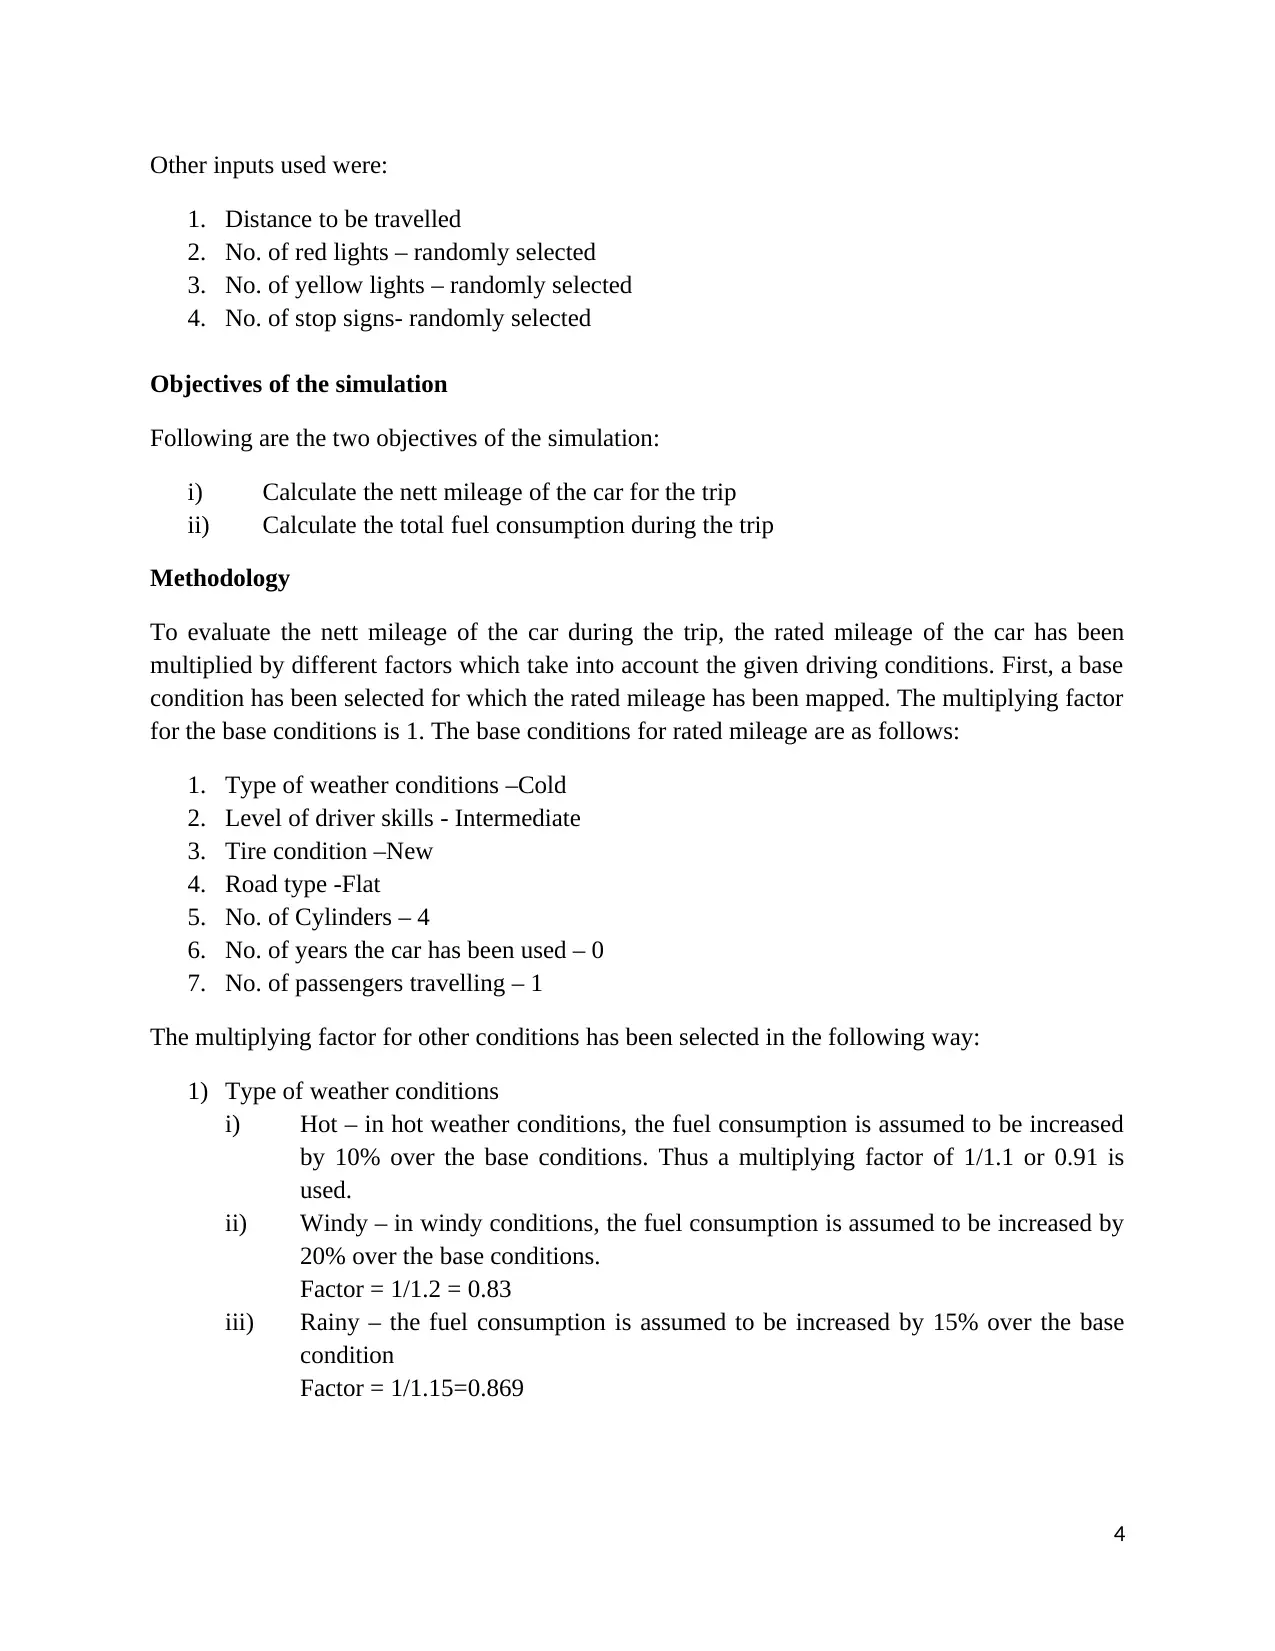
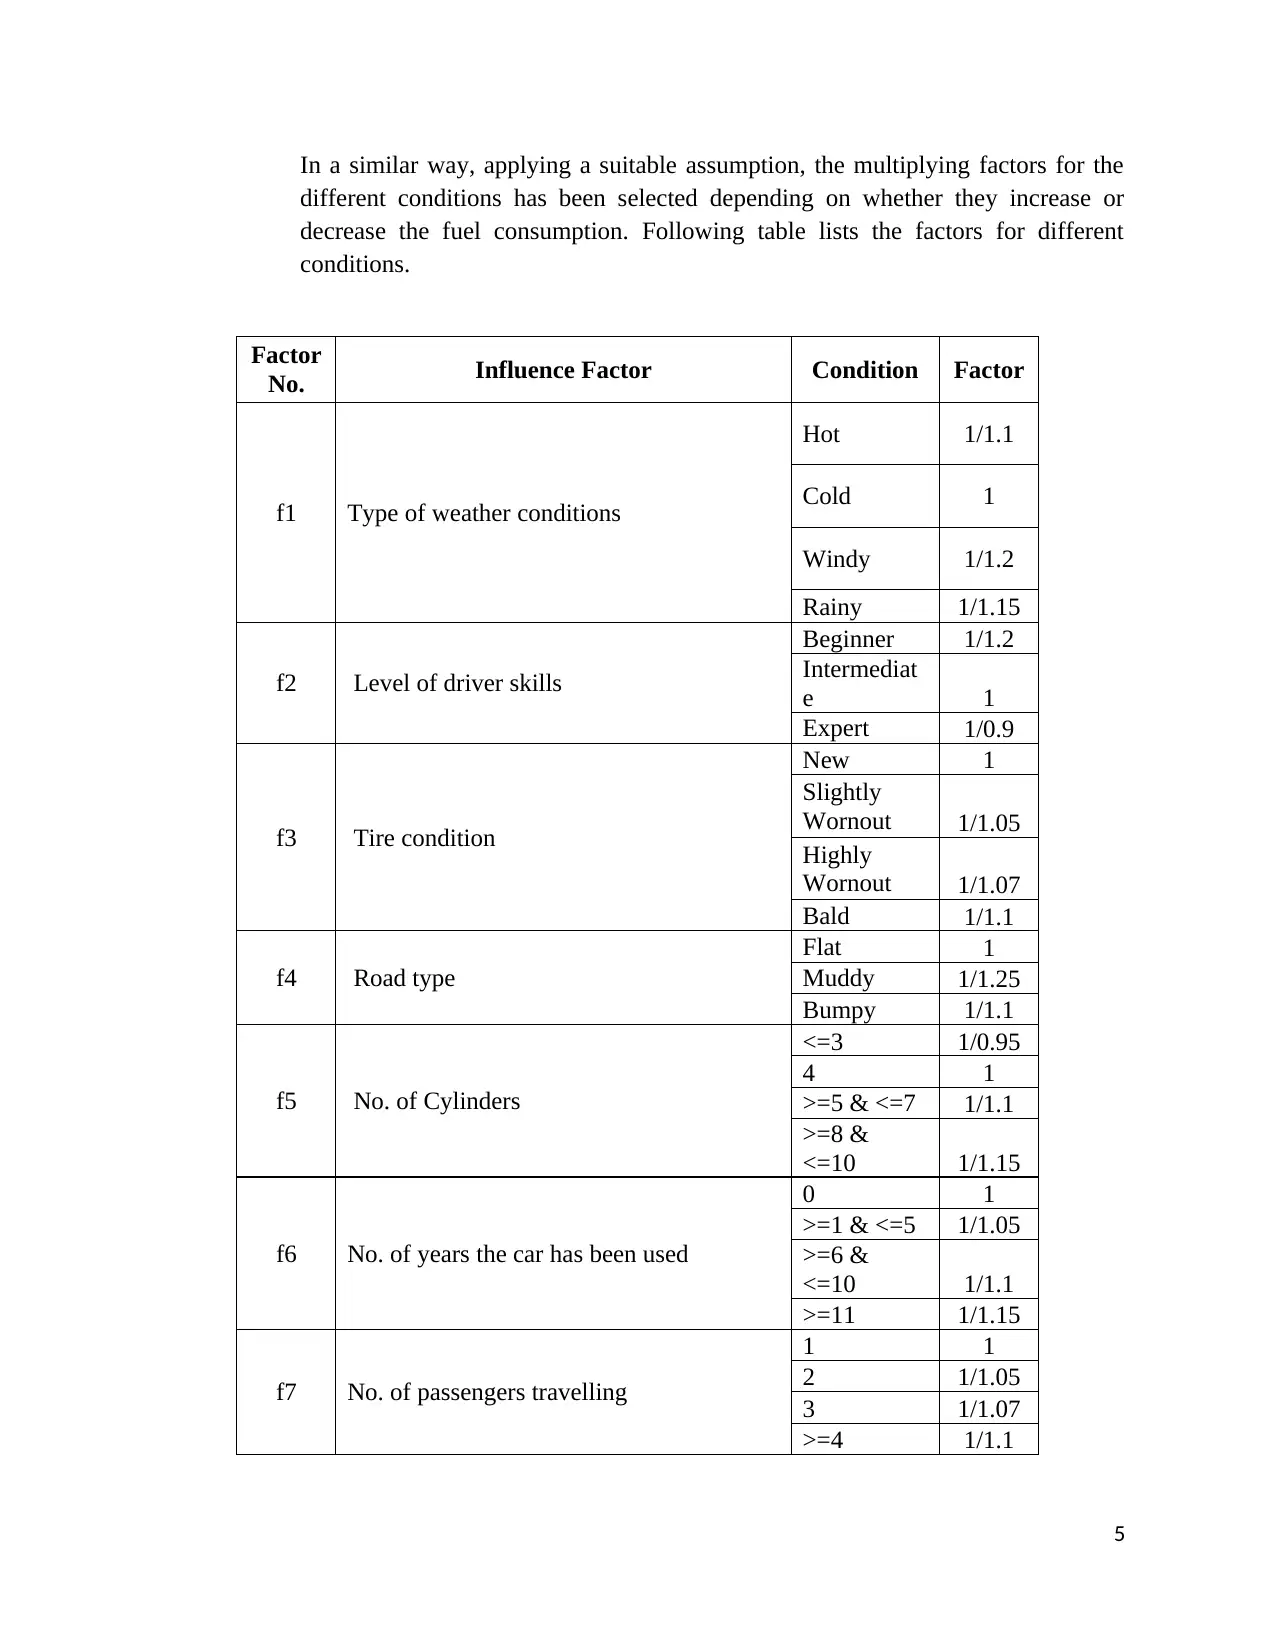
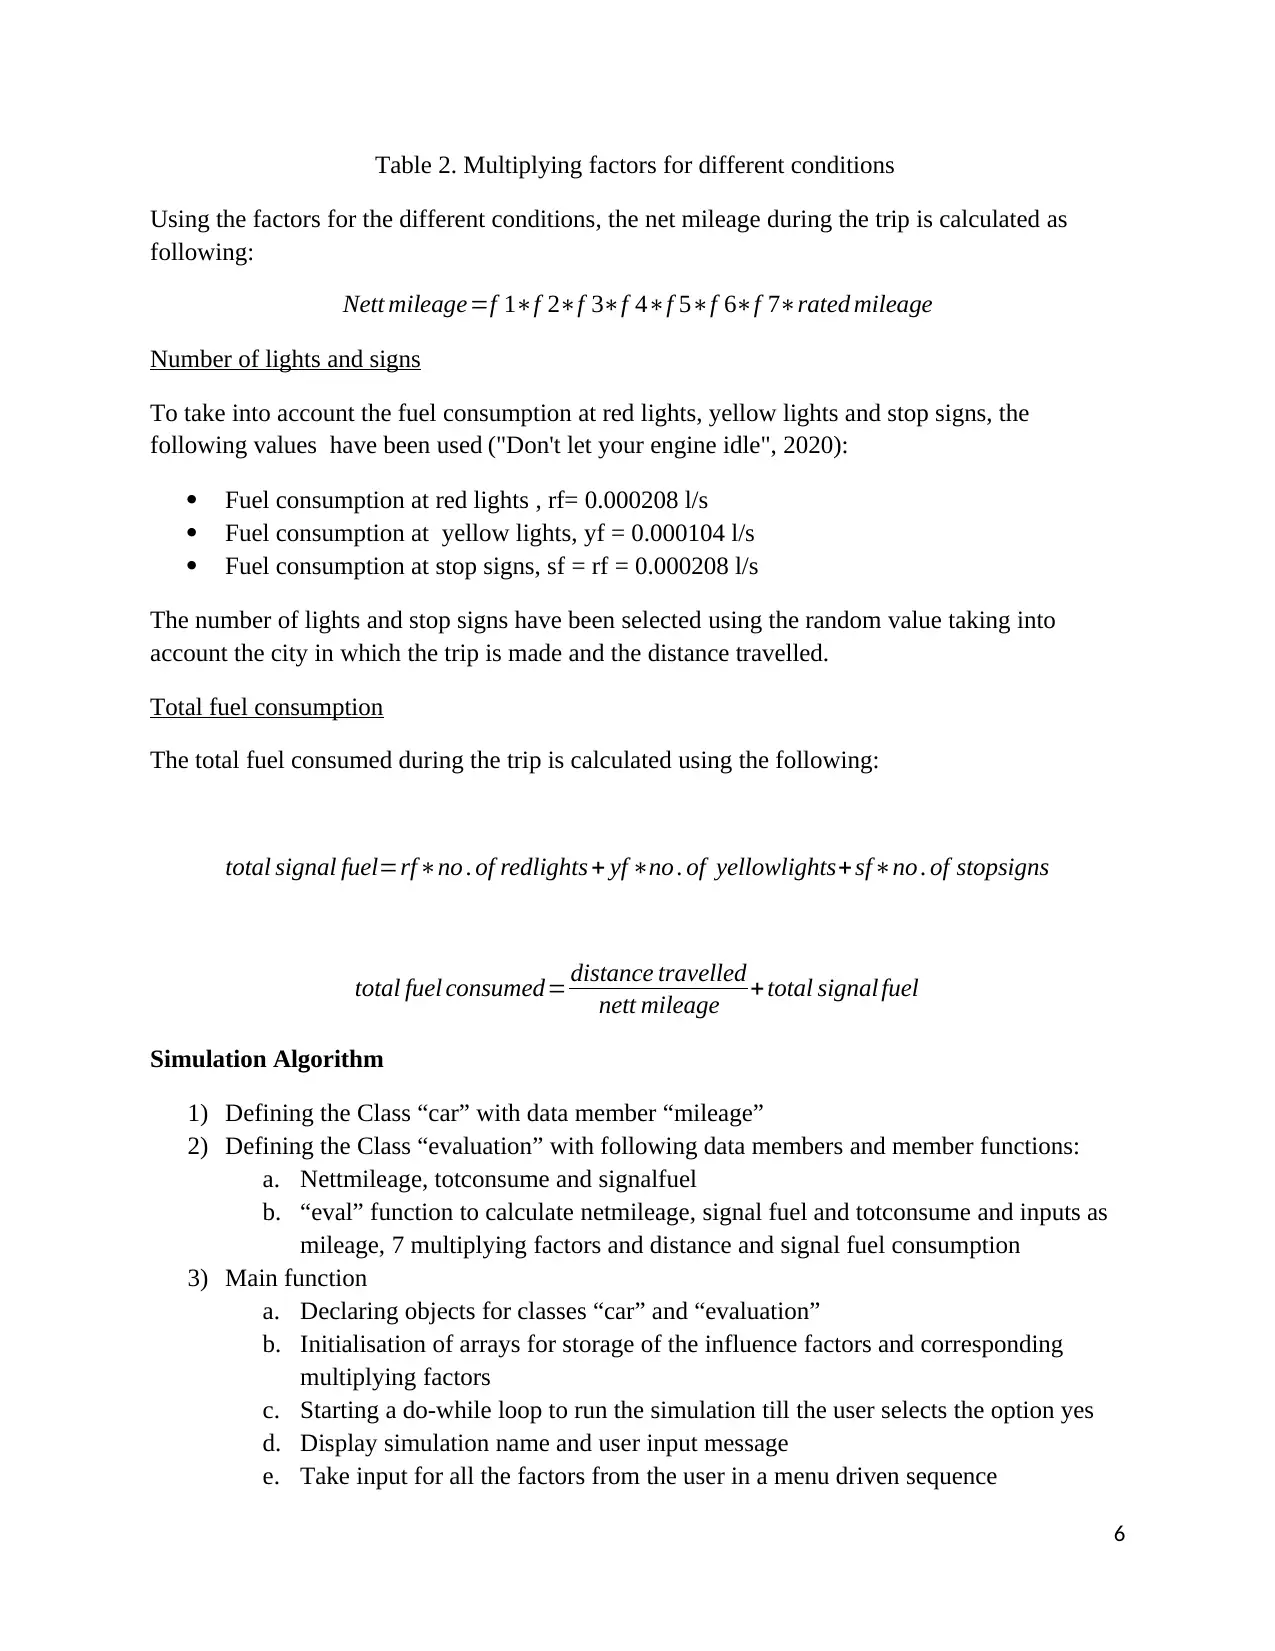
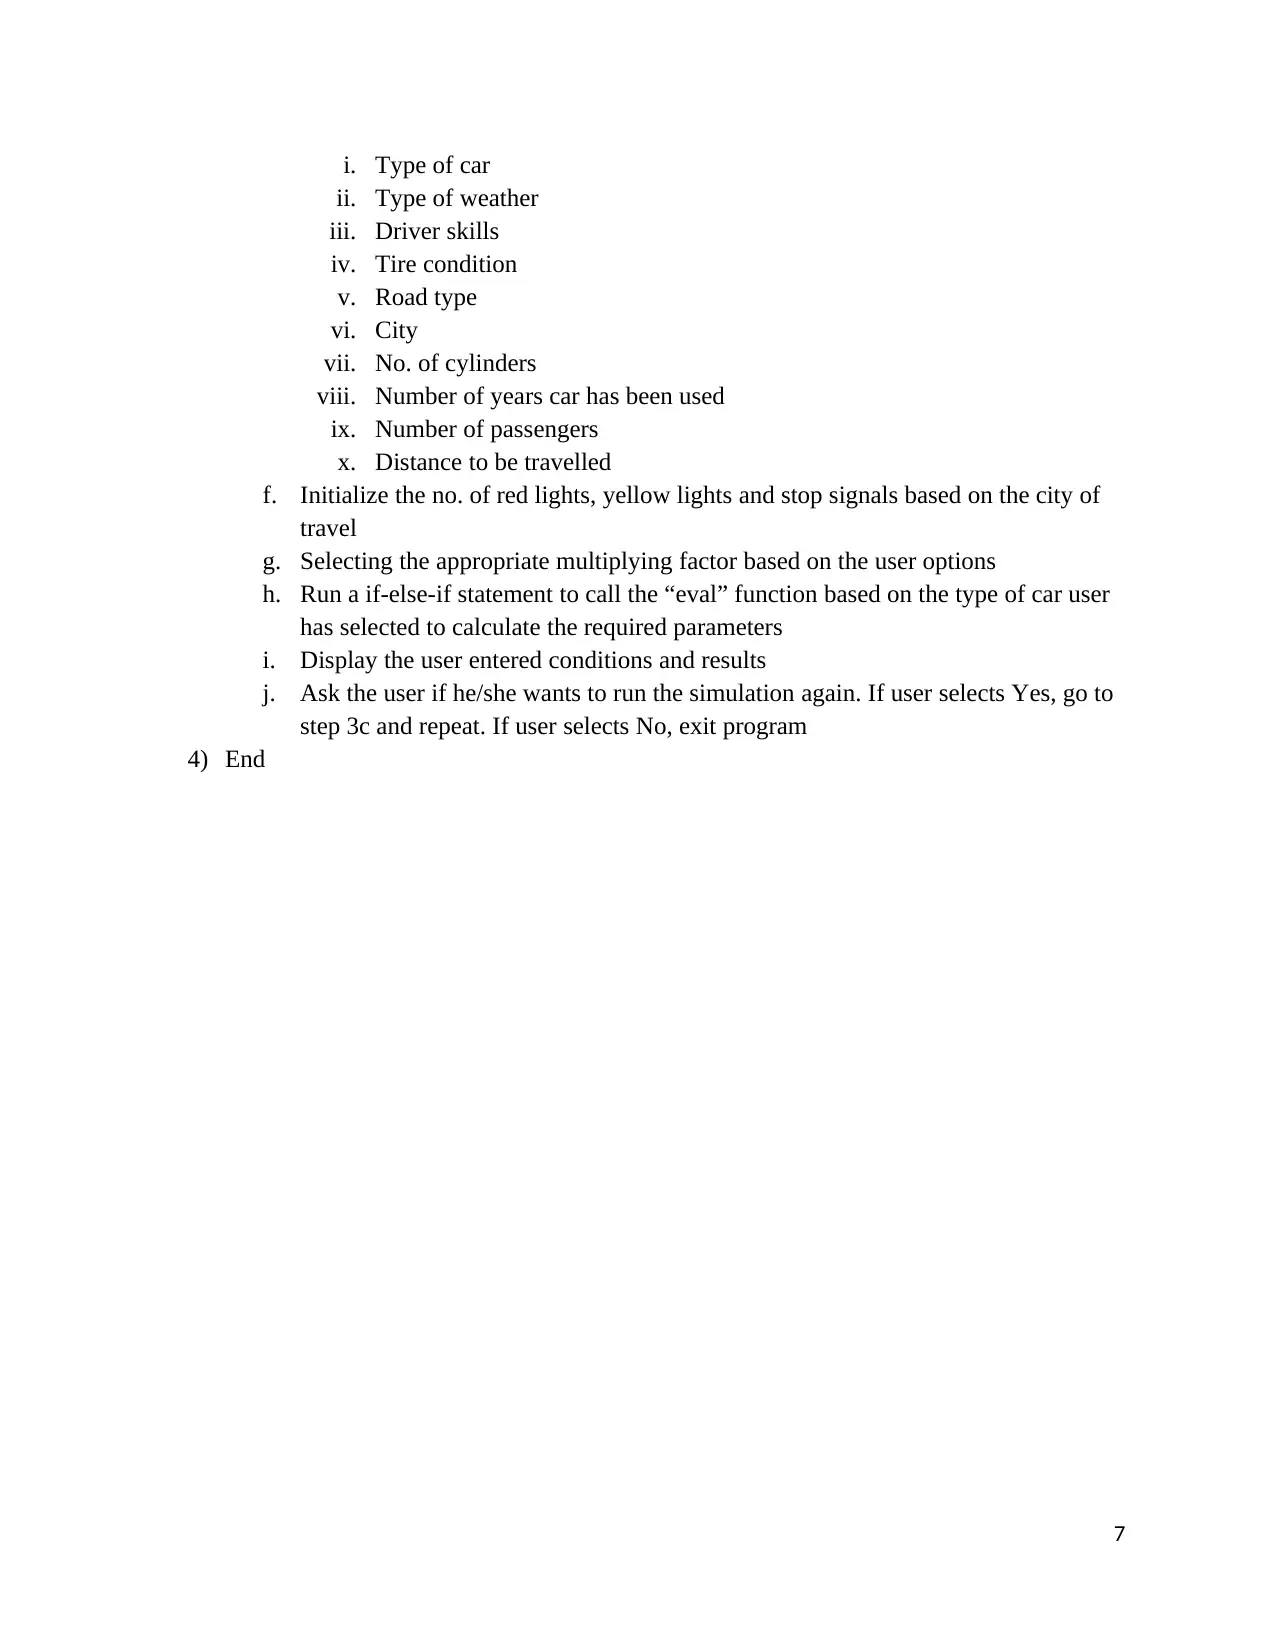
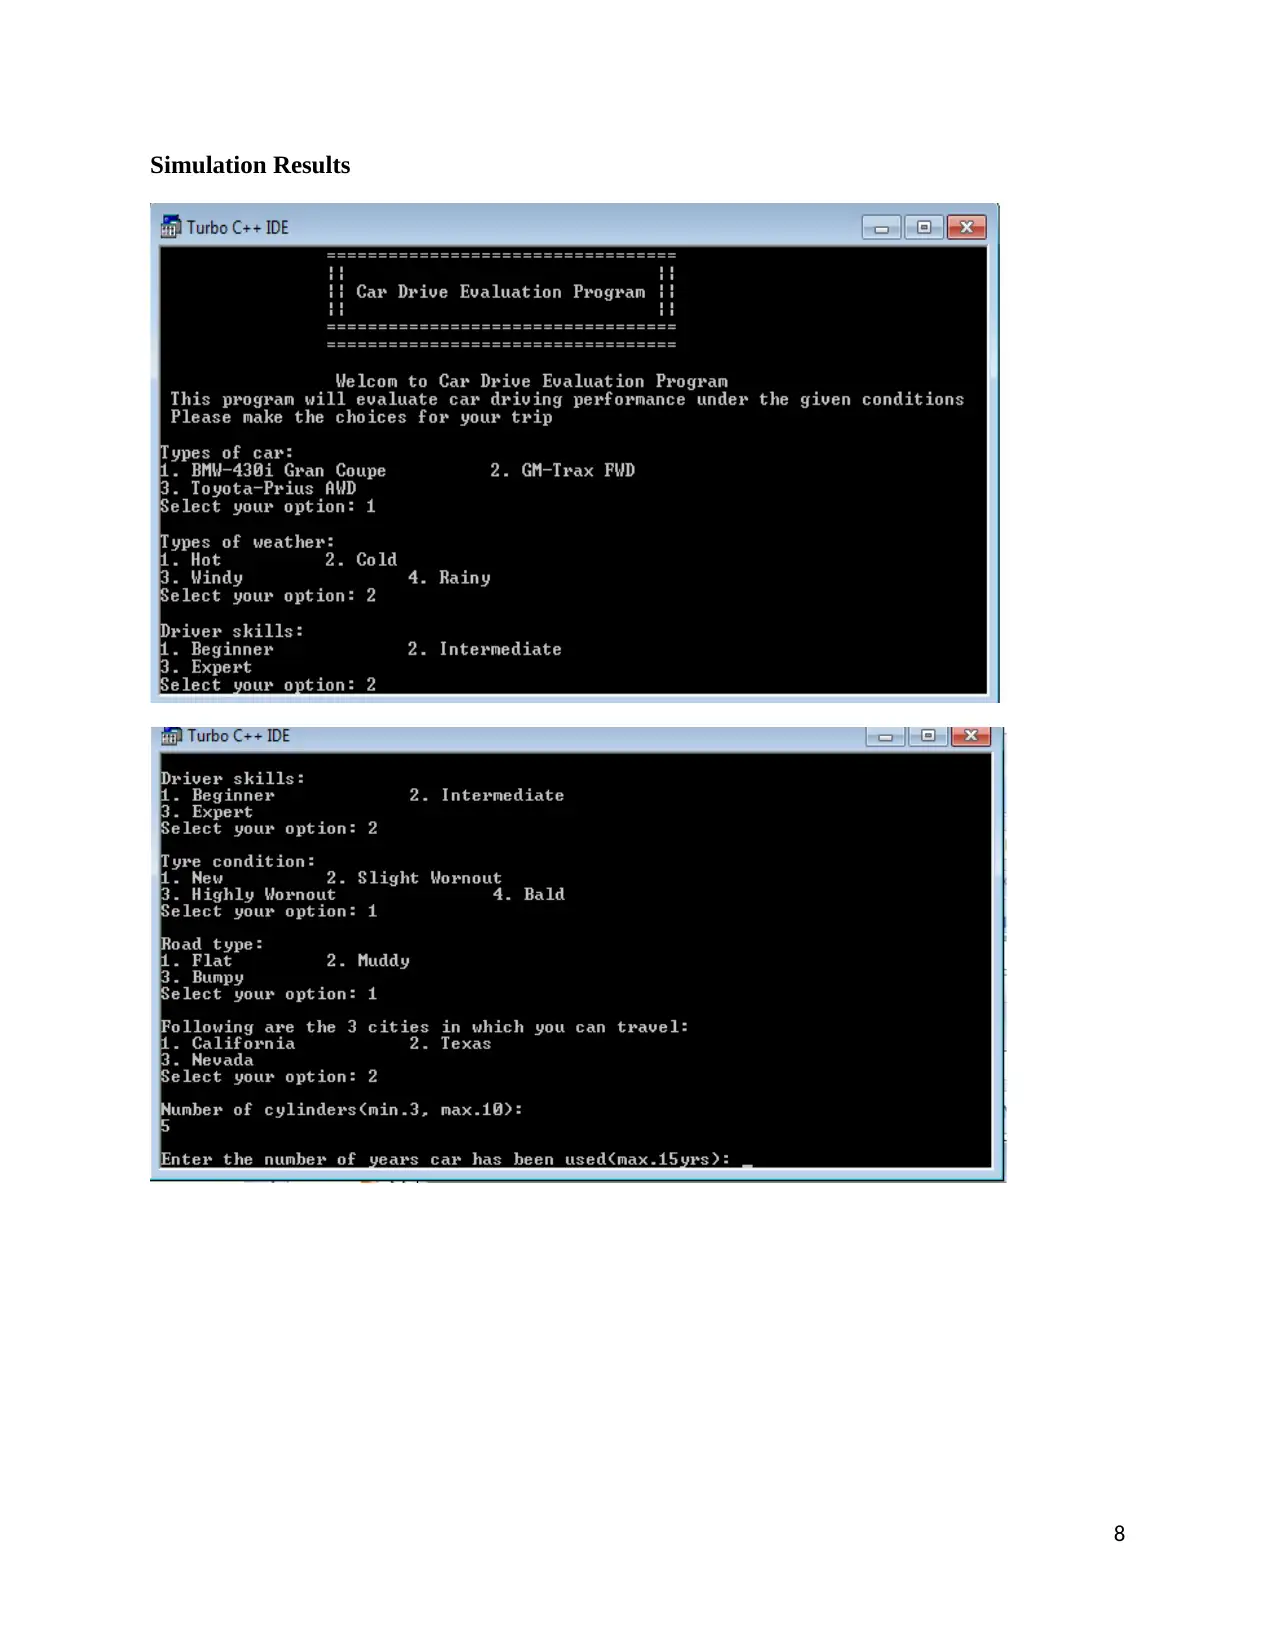
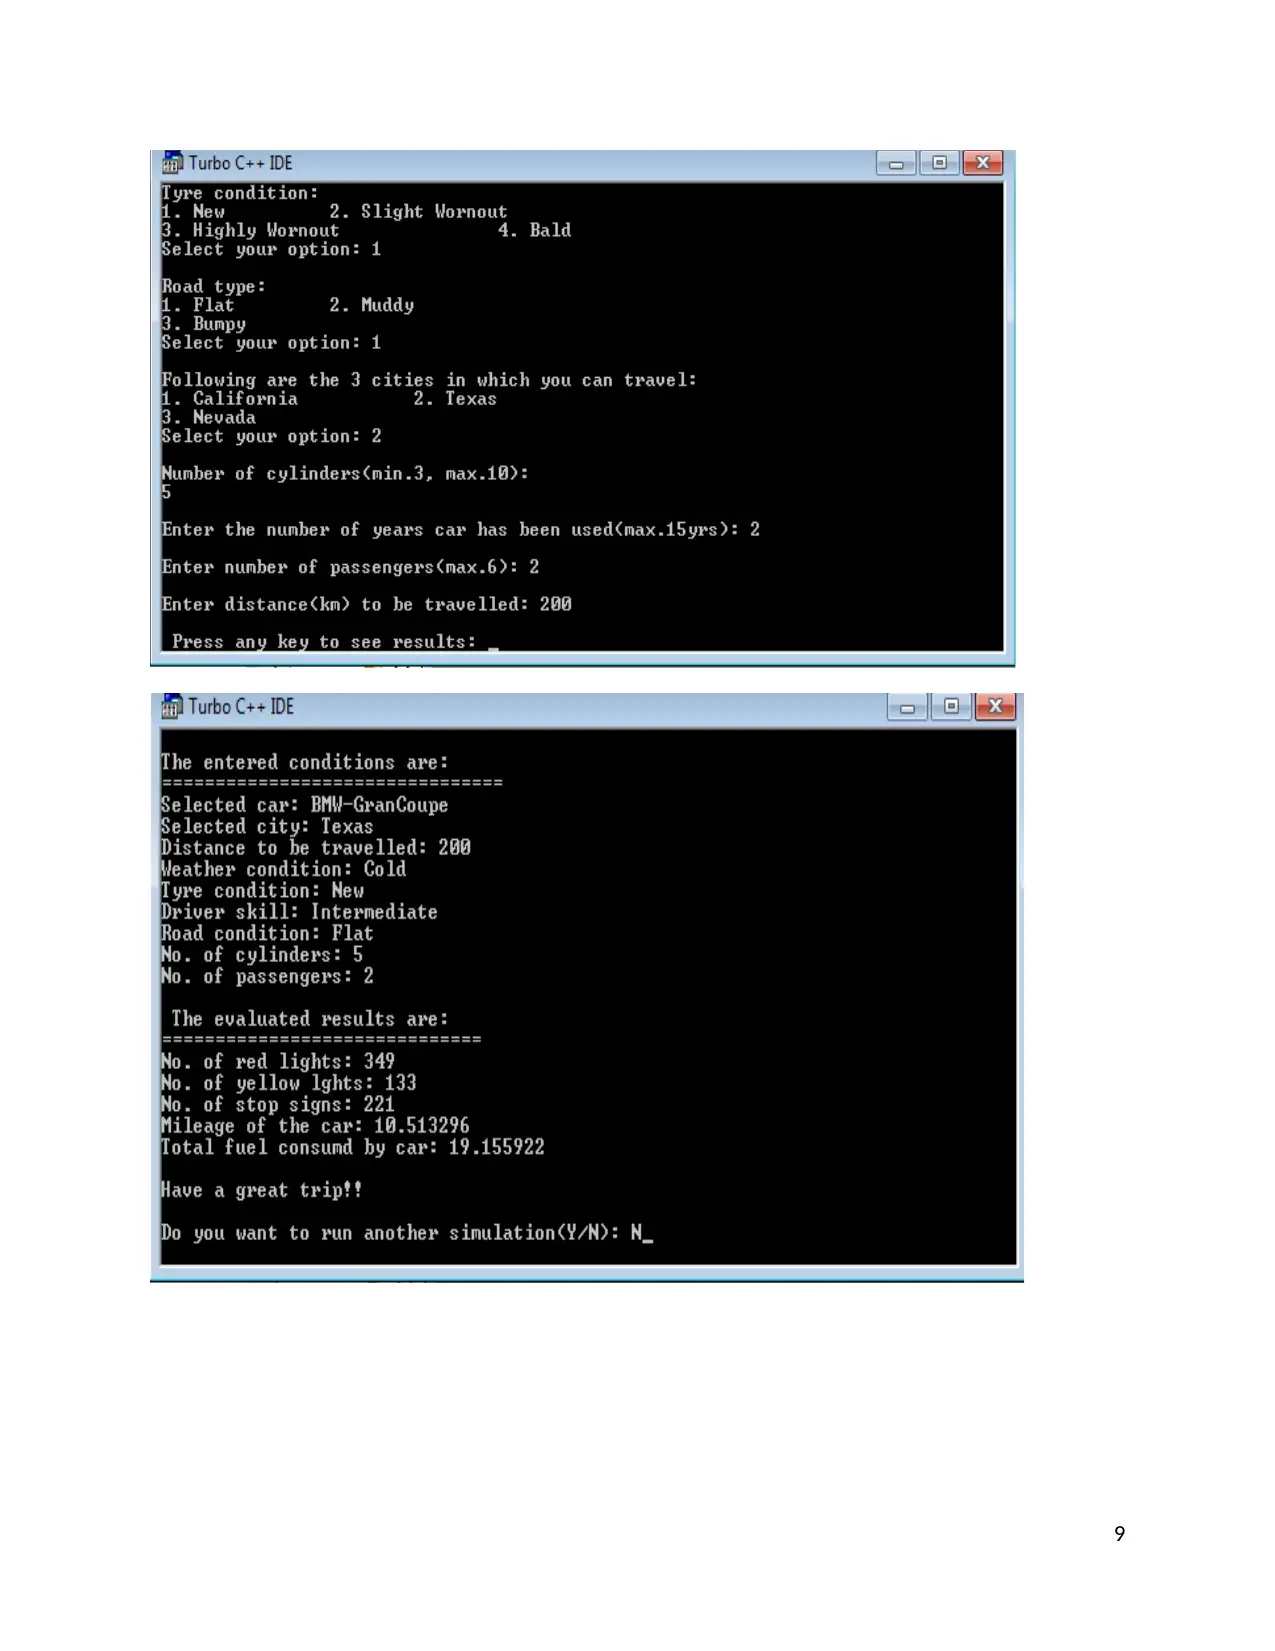
This report details a car driving simulation designed to evaluate fuel consumption and mileage under various conditions. The simulation considers factors such as car specifications (BMW 430i, GM TRAX, Toyota PRIUS), weather conditions (hot, cold, windy, rainy), driver skills, tire condition, road type, number of cylinders, age of the car, and number of passengers. The methodology involves calculating a net mileage by applying multiplying factors to a base condition, which accounts for the impact of each variable on fuel efficiency. The report also calculates total fuel consumption, considering fuel usage at red lights, yellow lights, and stop signs. The simulation algorithm is outlined, including class definitions, data members, and the main function that drives user input and result display. The results provide a comprehensive analysis of how different driving conditions influence fuel consumption and mileage, offering valuable insights for optimizing fuel efficiency. The report concludes with a list of references.
1 out of 10
Your All-in-One AI-Powered Toolkit for Academic Success.
+13062052269
info@desklib.com
Available 24*7 on WhatsApp / Email
![[object Object]](/_next/static/media/star-bottom.7253800d.svg)
Copyright © 2020–2026 A2Z Services. All Rights Reserved. Developed and managed by ZUCOL.