Car Rental Data Analysis & Recommendations: An Excel Project Report

Verified

Added on  2023/05/29

|4
|404
|148
Project
AI Summary
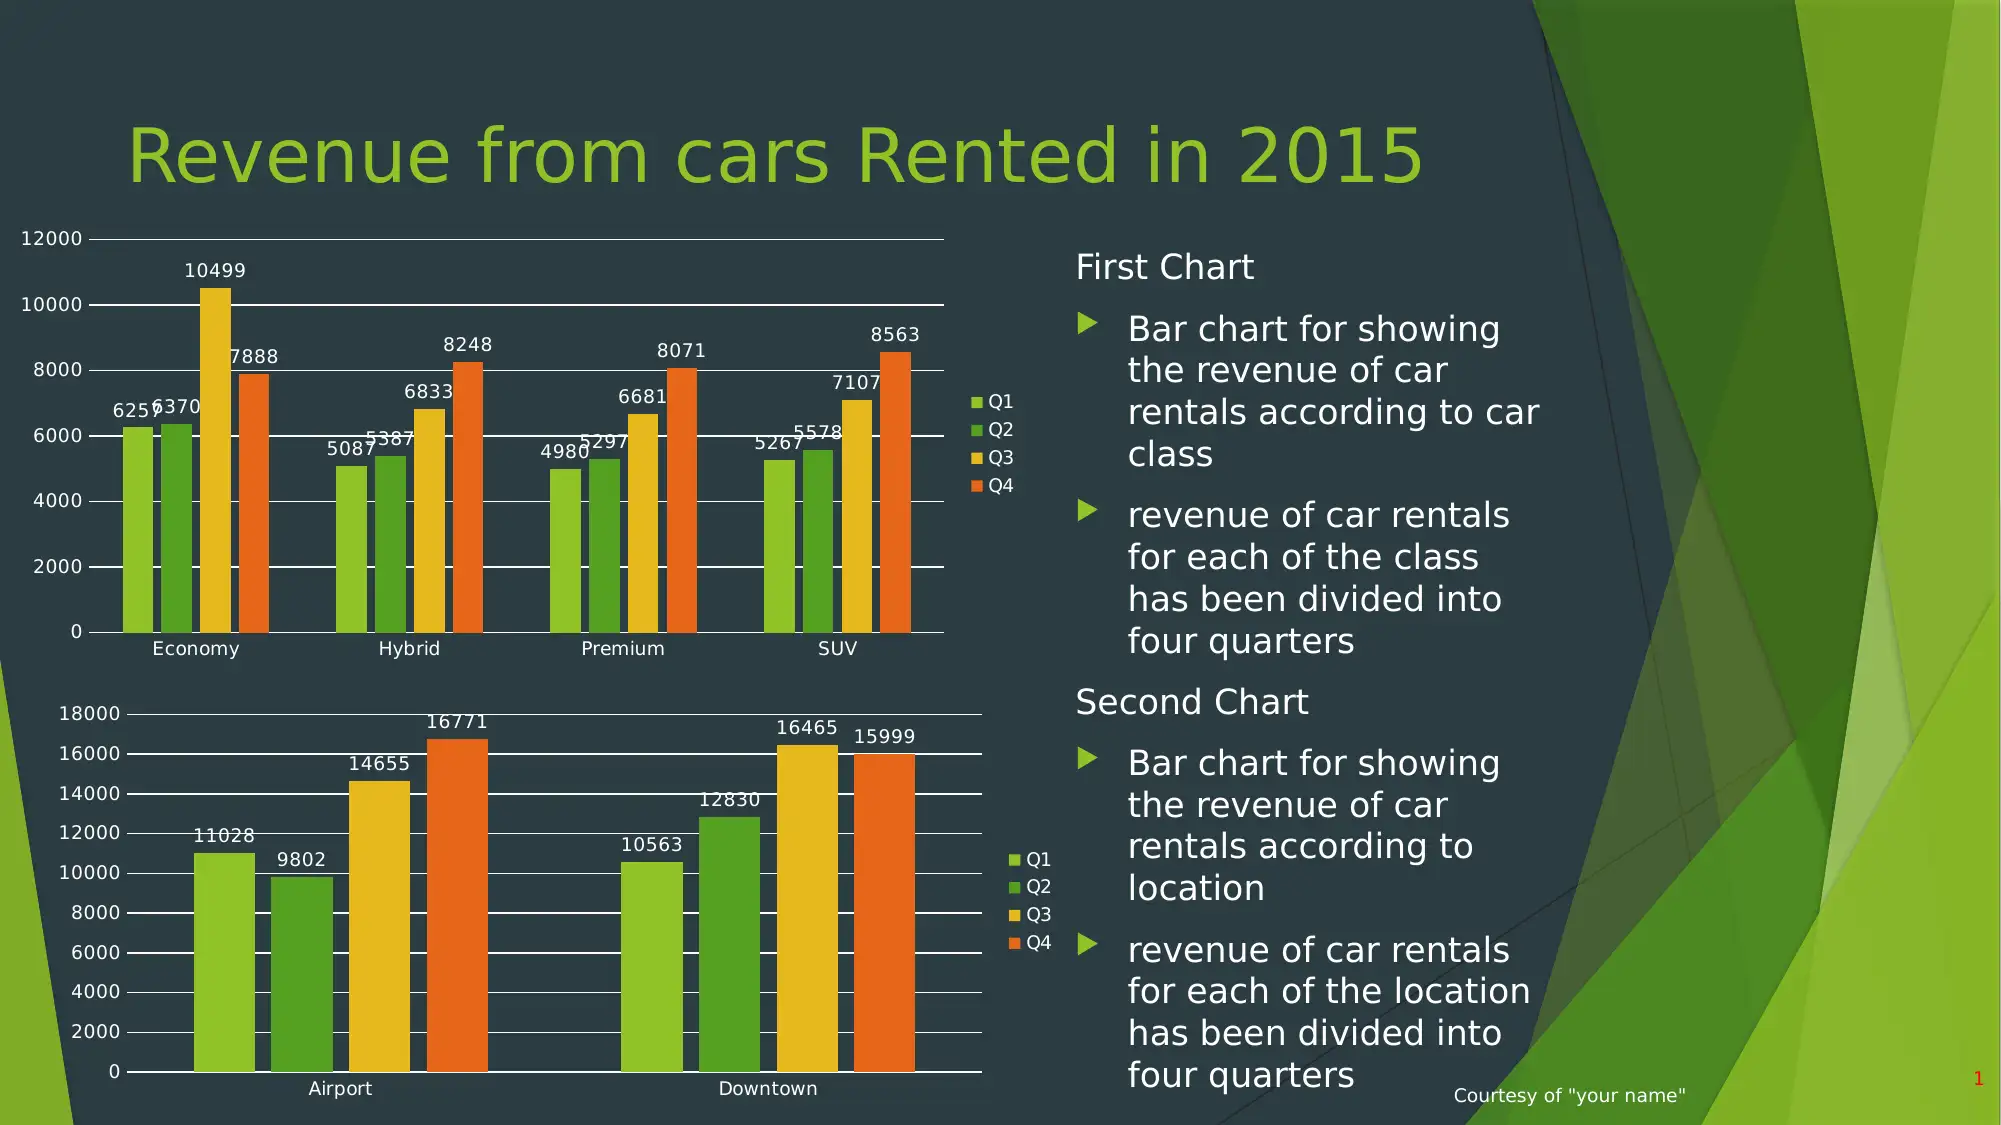
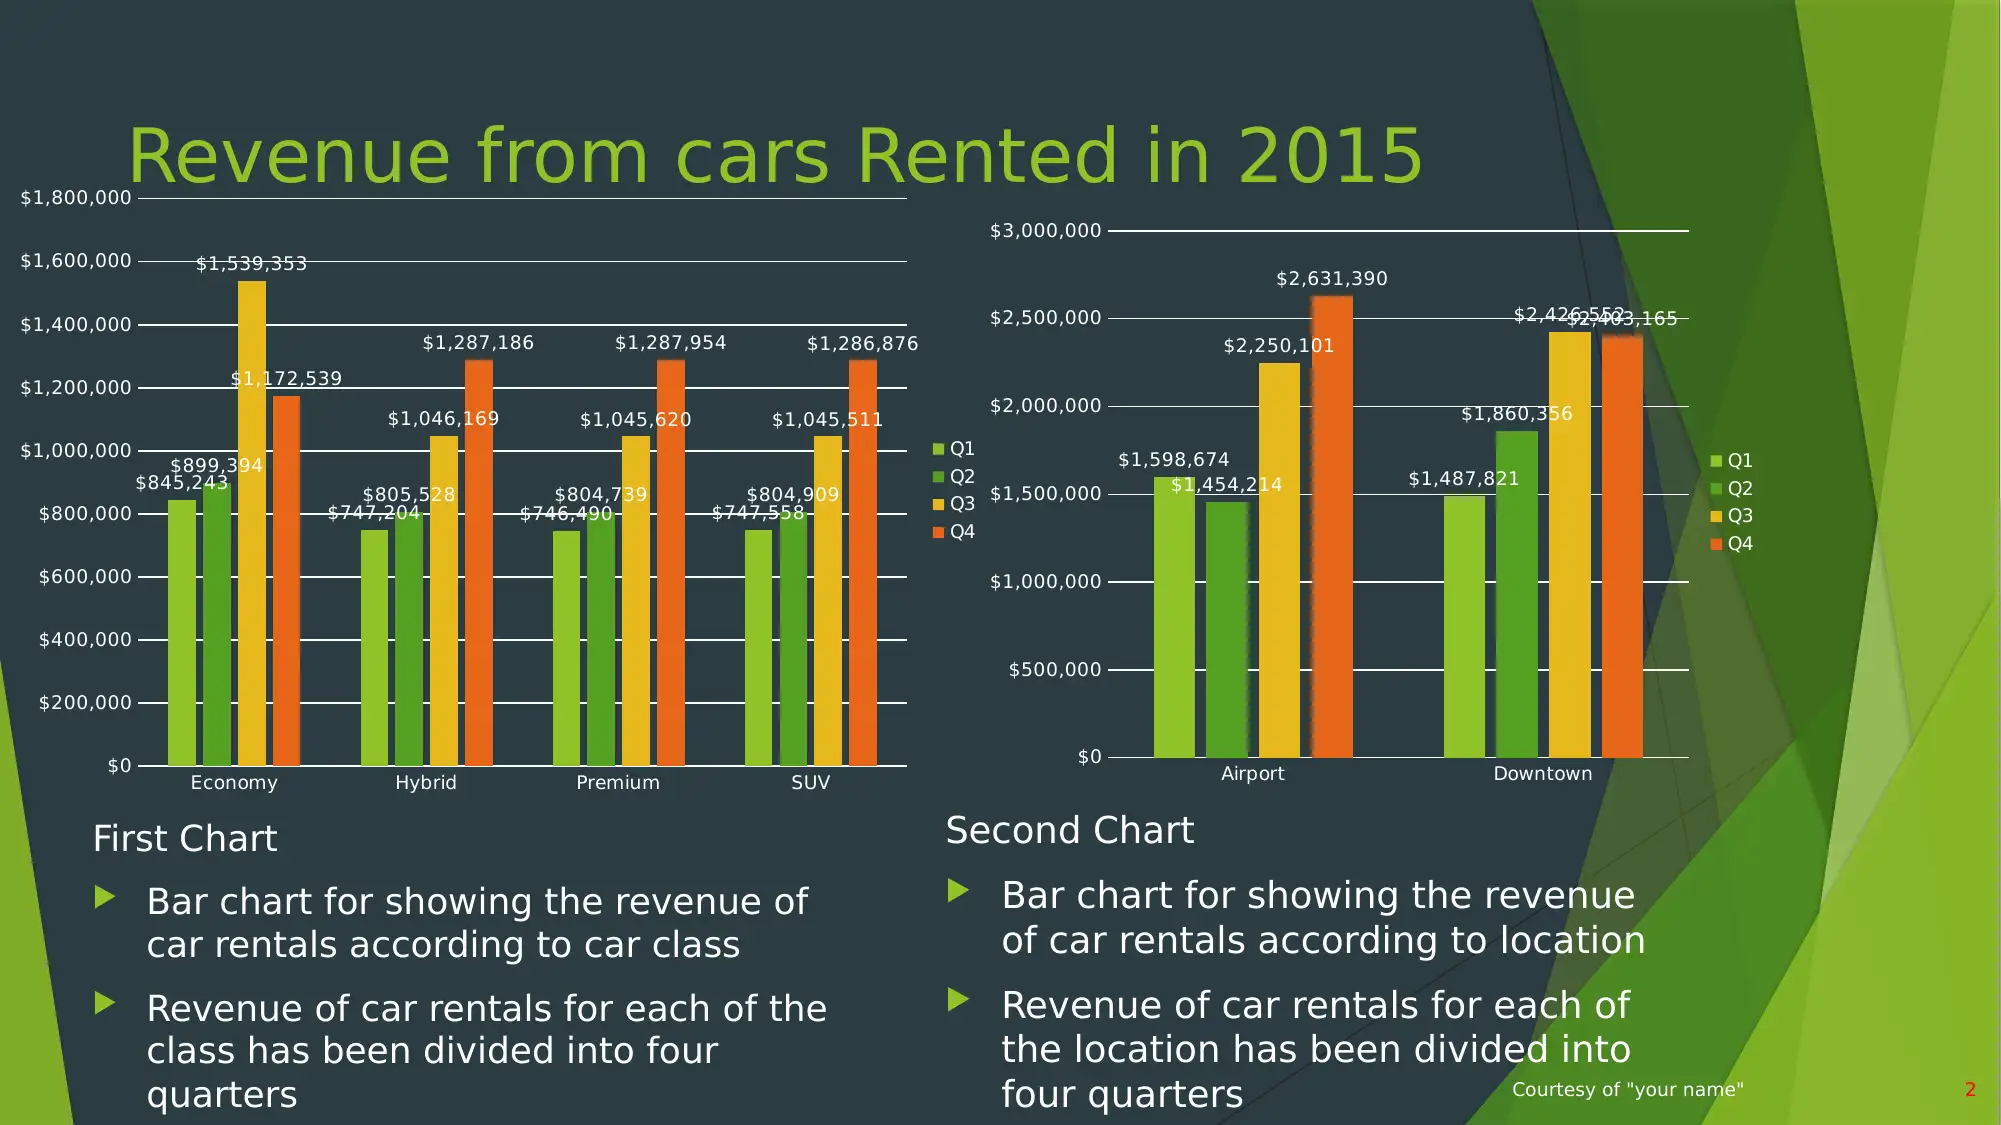
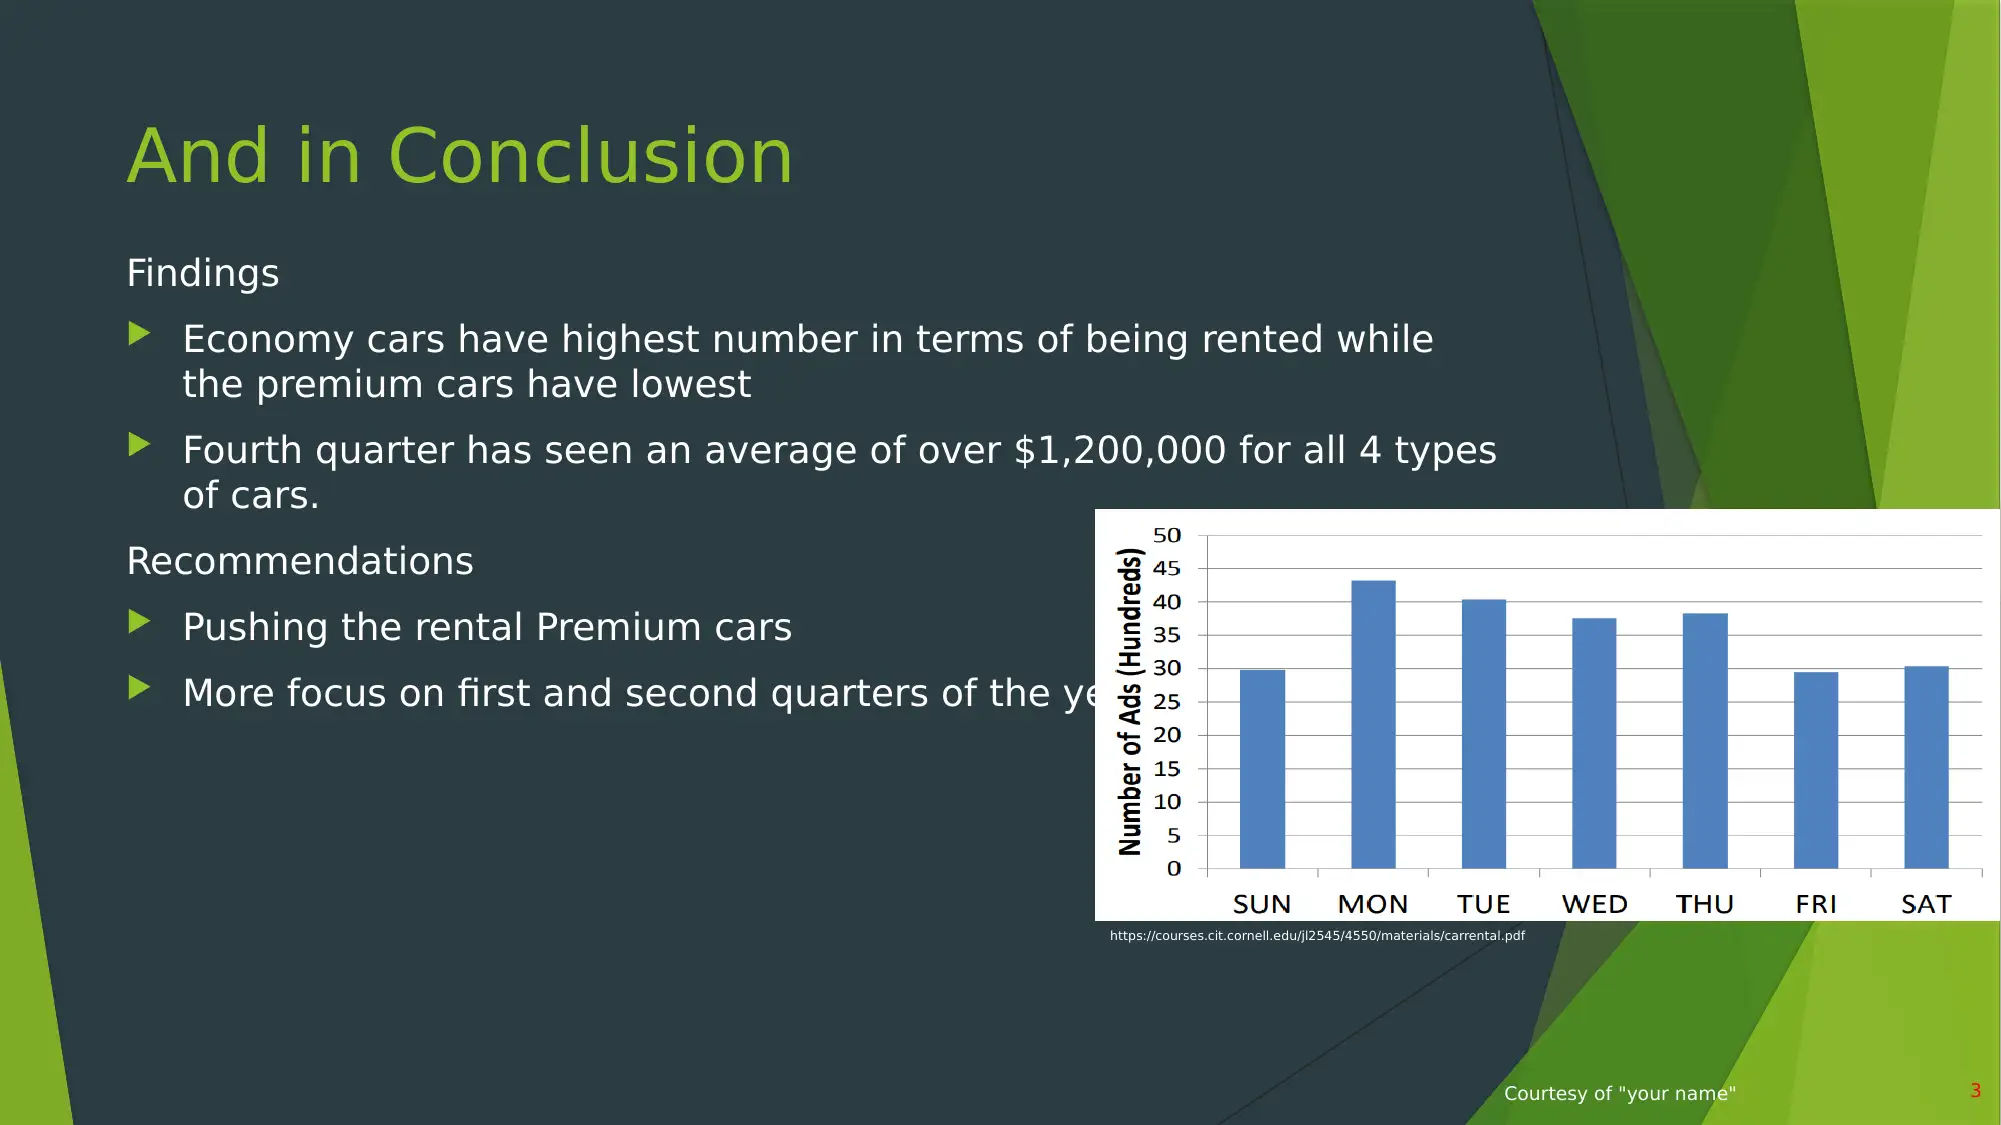
This project involves analyzing car rental data using Microsoft Excel to derive business insights. The analysis focuses on revenue generated from different car classes (Economy, Hybrid, Premium, and SUV) and locations (Airport and Downtown) on a quarterly basis in 2015. The data is visualized using bar charts to compare revenue across car classes and locations, highlighting trends such as the higher rental volume of economy cars and the significant revenue generated in the fourth quarter. The project concludes with recommendations, including focusing on promoting premium car rentals and targeting improvements in the first and second quarters. The source data and additional context are provided, indicating a structured approach to data-driven decision-making in the car rental business.
Document Page
Data Representation
for Car Rental
Company
Pivot Data Representation & Filter
<<student name>>
<<Class>>
<<Due Date>>
Courtesy of "your name"
tabler-icon-diamond-filled.svg

Paraphrase This Document

Need a fresh take? Get an instant paraphrase of this document with our AI Paraphraser
Document Page
Revenue from cars Rented in 2015
First Chart
Bar chart for showing
the revenue of car
rentals according to car
class
revenue of car rentals
for each of the class
has been divided into
four quarters
Second Chart
Bar chart for showing
the revenue of car
rentals according to
location
revenue of car rentals
for each of the location
has been divided into
four quarters
Economy Hybrid Premium SUV
0
2000
4000
6000
8000
10000
12000
6257
5087 4980 5267
6370
5387 5297 5578
10499
6833 6681 7107
7888 8248 8071 8563
Q1
Q2
Q3
Q4
Airport Downtown
0
2000
4000
6000
8000
10000
12000
14000
16000
18000
11028 10563
9802
12830
14655
1646516771 15999
Q1
Q2
Q3
Q4
Courtesy of "your name" 1
Document Page
Revenue from cars Rented in 2015
First Chart
Bar chart for showing the revenue of
car rentals according to car class
Revenue of car rentals for each of the
class has been divided into four
quarters
Economy Hybrid Premium SUV
$0
$200,000
$400,000
$600,000
$800,000
$1,000,000
$1,200,000
$1,400,000
$1,600,000
$1,800,000
$845,243
$747,204 $746,490 $747,558
$899,394
$805,528 $804,739 $804,909
$1,539,353
$1,046,169 $1,045,620 $1,045,511
$1,172,539
$1,287,186 $1,287,954 $1,286,876
Q1
Q2
Q3
Q4
Second Chart
Bar chart for showing the revenue
of car rentals according to location
Revenue of car rentals for each of
the location has been divided into
four quarters
Airport Downtown
$0
$500,000
$1,000,000
$1,500,000
$2,000,000
$2,500,000
$3,000,000
$1,598,674
$1,487,821$1,454,214
$1,860,356
$2,250,101
$2,426,552
$2,631,390
$2,403,165
Q1
Q2
Q3
Q4
Courtesy of "your name" 2
Document Page
And in Conclusion
Findings
Economy cars have highest number in terms of being rented while
the premium cars have lowest
Fourth quarter has seen an average of over $1,200,000 for all 4 types
of cars.
Recommendations
Pushing the rental Premium cars
More focus on first and second quarters of the year
https://courses.cit.cornell.edu/jl2545/4550/materials/carrental.pdf
Courtesy of "your name" 3
chevron_up_icon
1 out of 4
circle_padding
hide_on_mobile
zoom_out_icon
[object Object]