MGT723 Research Project Report: Carbon Emission and Business Strategy
VerifiedAdded on 2023/06/04
|8
|2537
|154
Report
AI Summary
This report presents an inferential analysis of carbon emissions, examining the differences between developed and developing countries, and the impact of business strategies on emission levels. The analysis utilizes t-tests to compare carbon emission reductions, revealing that developing countries show a greater reduction compared to developed nations. The study includes data from the USA, China, India, and Brazil. Further, the report investigates whether firms integrating climate change into their business strategies exhibit different emission levels compared to those that do not. The findings indicate no significant difference between these two groups, which may be due to the sample size. The report discusses the implications of these findings for government policy and business practices, as well as limitations and avenues for future research, including the need for larger sample sizes and qualitative analysis. The report also highlights the ongoing debate between developed and developing nations regarding carbon emission reduction responsibilities and the role of technological advancements.

Data Analysis Inferential
Findings from the inferential analysis have been shown in the current section. The inferential
analysis is used to test the proposed hypothesis and the same has been done in the current
research also. For this research the t- test has been conducted and the results from the t test are
discussed below(Kuada 2012; Rosa1 & Luana Caroline Silva 2017).
The first t test has been conducted to examine whether there is significant difference in the
carbon emission between the developed and the developing countries. As the results indicate the
mean reduction in carbon emission for the developed country was 8.28 % whereas the average
reduction for the developing countries is 17.99 %. This clearly indicates that the developed
country is slow in reducing the carbon emission as compared to the developing countries. For the
current research the USA has been taken as the developed country and the developing countries
includes India, China and Brazil(Müller-Falcke 2002; Panayotou & Sachs 2005).
Group Statistics
Developed or
Developing
N Mean Std.
Deviation
Std. Error
Mean
percentage change in
Co2 emission from
previous year
Developed 53 -8.2811 5.80209 .79698
Developing 53 -17.9940 45.33302 6.22697
Table 1 Results from the group statistics of the t test
Independent Samples Test
Levene's
Test for
Equality
of
Variances
t-test for Equality of Means
F Sig. t df Sig.
(2-
tailed
Mean
Differenc
e
Std. Error
Differenc
e
95% Confidence
Interval of the
Difference
Paraphrase This Document
Need a fresh take? Get an instant paraphrase of this document with our AI Paraphraser

) Lower Upper
percentag
e change
in Co2
emission
from
previous
year
Equal
variance
s
assumed
4.05
2
.04
7
1.54
7
104 .125 9.71283 6.27776 -
2.7362
1
22.1618
7
Equal
variance
s not
assumed
1.54
7
53.70
3
.128 9.71283 6.27776 -
2.8749
2
22.3005
8
Table 2 Results from the independent sample t test
The t test has been conducted to examine whether there is significant difference in the carbon
emission for the firms who have integrated climate change into their business strategy from those
who have not taken into consideration the climate change while preparing their business
strategies. Results from t test are shown in the table below.
Group Statistics
climate change
integrated into your
business strategy?
N Mean Std.
Deviation
Std. Error
Mean
percentage change in
Co2 emission from
previous year
Yes 95 -13.7219 34.27817 3.51687
No 11 -8.0909 5.94062 1.79116
Table 3 Results from the group statistics of the t test
Independent Samples Test
Levene's
Test for
Equality
of
Variance
s
t-test for Equality of Means
F Sig. t df Sig.
(2-
tailed
)
Mean
Differenc
e
Std. Error
Differenc
e
95% Confidence
Interval of the
Difference
Lower Upper
percentag
e change
in Co2
emission
from
previous
year
Equal
variance
s
assumed
.49
0
.48
6
-.542 104 .589 -5.63099 10.39567 -
26.2459
8
14.9840
1
Equal
variance
s not
assumed
-
1.42
7
91.32
8
.157 -5.63099 3.94672 -
13.4702
8
2.20831
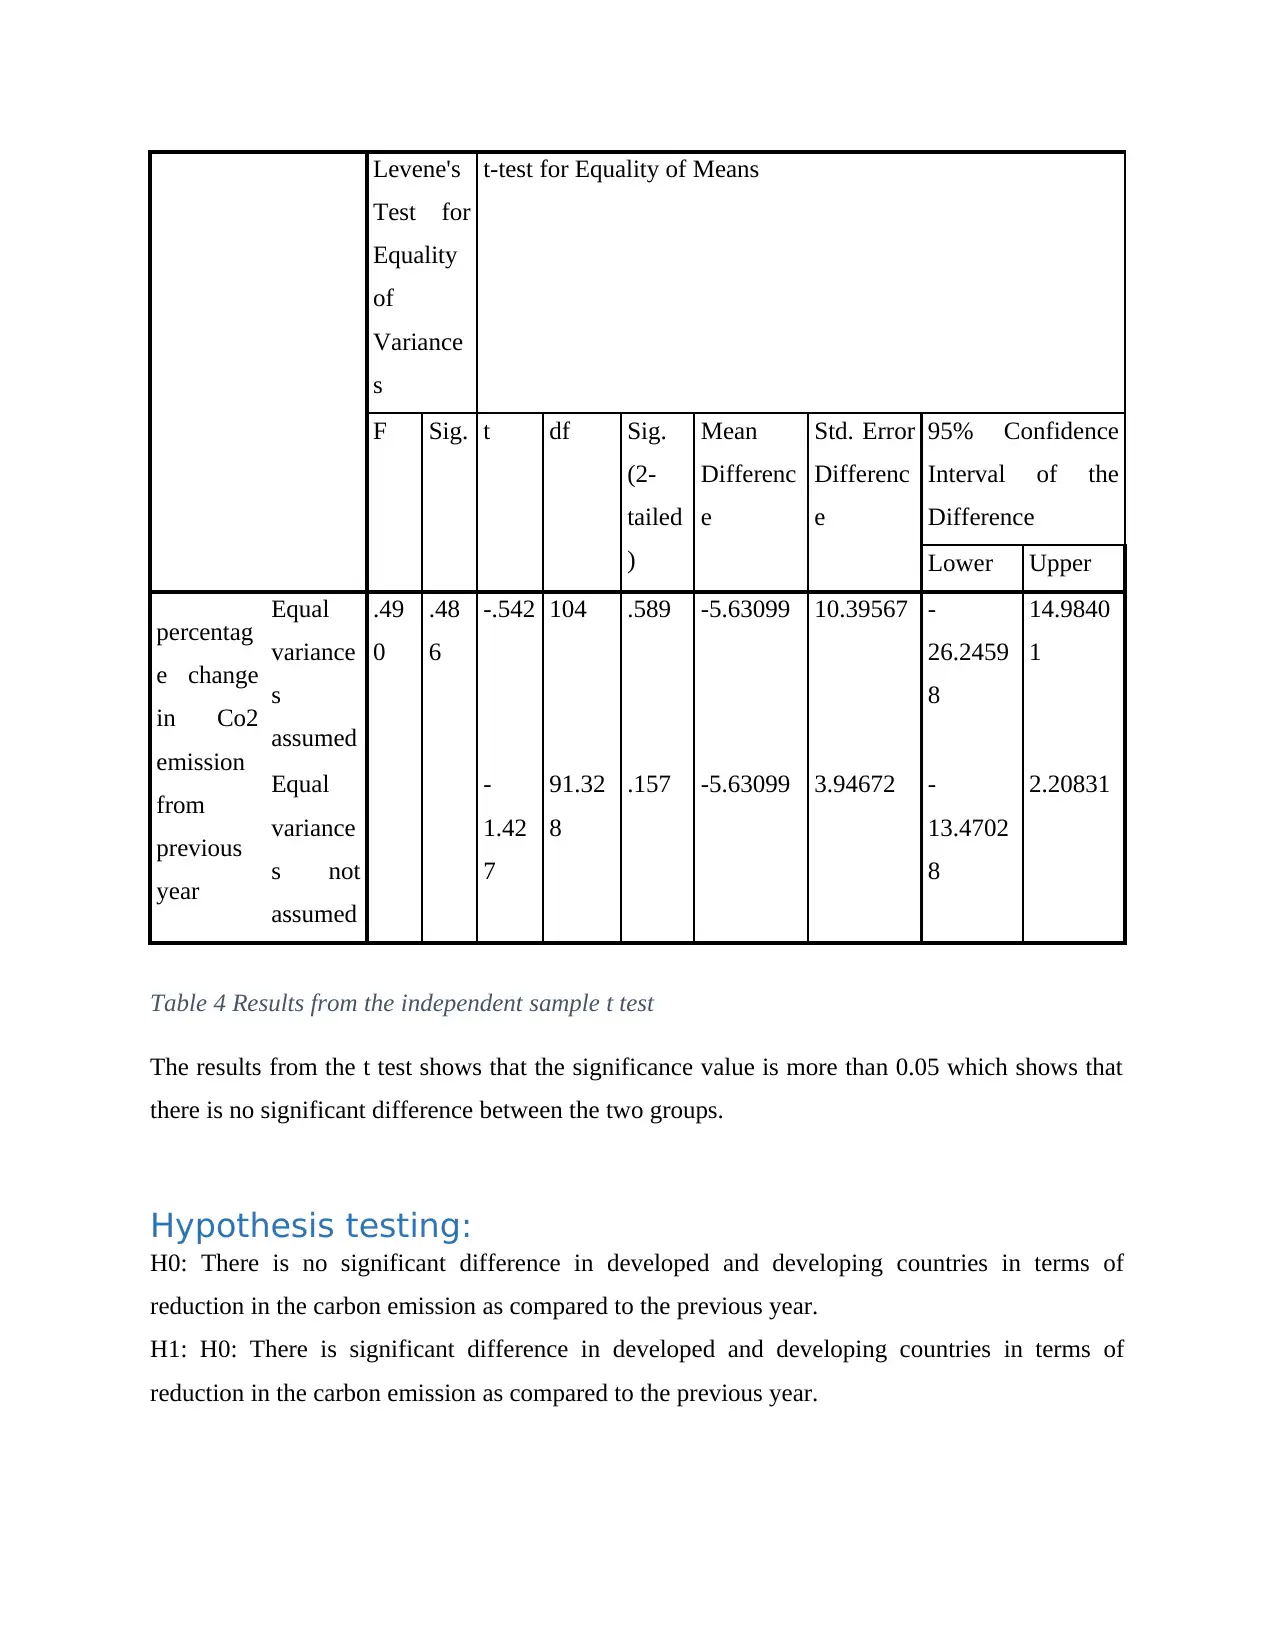
Table 4 Results from the independent sample t test
The results from the t test shows that the significance value is more than 0.05 which shows that
there is no significant difference between the two groups.
Hypothesis testing:
H0: There is no significant difference in developed and developing countries in terms of
reduction in the carbon emission as compared to the previous year.
H1: H0: There is significant difference in developed and developing countries in terms of
reduction in the carbon emission as compared to the previous year.
Test for
Equality
of
Variance
s
t-test for Equality of Means
F Sig. t df Sig.
(2-
tailed
)
Mean
Differenc
e
Std. Error
Differenc
e
95% Confidence
Interval of the
Difference
Lower Upper
percentag
e change
in Co2
emission
from
previous
year
Equal
variance
s
assumed
.49
0
.48
6
-.542 104 .589 -5.63099 10.39567 -
26.2459
8
14.9840
1
Equal
variance
s not
assumed
-
1.42
7
91.32
8
.157 -5.63099 3.94672 -
13.4702
8
2.20831
Table 4 Results from the independent sample t test
The results from the t test shows that the significance value is more than 0.05 which shows that
there is no significant difference between the two groups.
Hypothesis testing:
H0: There is no significant difference in developed and developing countries in terms of
reduction in the carbon emission as compared to the previous year.
H1: H0: There is significant difference in developed and developing countries in terms of
reduction in the carbon emission as compared to the previous year.
⊘ This is a preview!⊘
Do you want full access?
Subscribe today to unlock all pages.
Trusted by 1+ million students worldwide

To test the above hypothesis the t- test has been conducted and the results from the test show that
the significance value is less than 0.05. Since the current research is based on the 95 %
confidence interval, the null hypothesis can be rejected in favor of the alternative hypothesis.
Discussion
The results from the first t- test shows that the Levene's Test for Equality of Variances is
significant as the significance value is less than the critical value of 0.05. For the current research
the significance level of 95 % has been taken into consideration. On the basis of the results it can
be concluded that there is significant difference in reduction in the carbon emission among the
developing and the developed countries. One of the main reason for such results may be the role
of the government in developed and developing countries. The developed countries have already
achieved the higher growth and the per capita income in these countries are very high. It has
been argued my many scholars that the clean environment is the luxury goods and only with the
higher income one can afford the luxury products. So, the people in the developed countries can
afford the clean environment which is not the case for the developing countries(Chakraborty &
Reagle 2003; Vivarelli 2014).
Another important factor is the role of government. In the developed countries, the government
are more concerned about the environment, so the rule and regulations related to pollution are
stricter and the projects are not passed if they do not pass the environmental regulations. Also the
people are more concerned about their environment in the developed countries. On the other
hand the developing countries are still trying to achieve the higher growth which is expected to
bring down the poverty through the trickledown effect and increase the per capita income of the
people. So, the government rules and the regulation related to the environment are less strict as
compared to the developed countries. The high number of manufacturing firms in the developing
countries such as China and India are due to the less strict environmental regulations. Some of
the researchers have even tested the pollution haven hypothesis for these two countries and most
of the researchers have found that the developing countries have lax environmental policies so
that the higher foreign direct investment can be attracted(Heckscher 2012; Antonio et al. 2013;
He & Fu 2011; UNCTAD 2011). However some of the studies do not find such evidences in
Paraphrase This Document
Need a fresh take? Get an instant paraphrase of this document with our AI Paraphraser

these countries. Overall, when the government is supportive for the environmental degradation
and carbon emission, the firms are expected to produce more products which means more carbon
emission in the environment. In the recent time there has been a debate going on about curbing
the carbon emission from the developing countries as the developing countries are producing
more carbon as compared to the developed countries. However, the developing countries are
arguing that the now developed countries were more producing much larger carbon when they
were in the developing phase and this is the strategy of the developed countries to stop the high
growth in the developing countries. On the other hand the developed countries argues that it is
high time we should think about the climate change and start immediate actions to reduce the
carbon emission. This is ongoing debate between the developing and the developed countries
which is also related to the globalization.
Another important factors which leads to higher carbon emission in the developing countries is
due to lack of the technological advancement which are more environment friendly and produce
less carbon. In the developed countries there is huge investment in research and development and
also a huge support from the government to develop the technologies which produce less carbon.
With the use of such technologies and process the manufacturing firms are producing less carbon
with same amount output. On the other hand, most of the firms in the developing countries are
using the old techniques. The adoption of the new technologies in the developing countries is
less because the new technologies are either too expensive which the firms cannot afford or such
technologies are not available due to patent and the copy right issues. Also the government
support is very less in terms of the research and development of new process and
techniques(Phimphanthavong 2013; Lo´pez-Gamero, Molina-Azorı´n & S 2009; Honglei,
Xiaorong & Qiufeng 2010; Thompson 2014).
Another t- test was conducted to test whether there is significant difference in the carbon
emission for the firms which taken into consideration the climate change while making their
business strategies from those firms who do not take into consideration climate change. As
shown in the table 4, the Levene's Test for Equality of Variances is 0.49. However the
significance value is more than the critical value of 0.05. So, it can be concluded that there is no
significant difference in the carbon reduction for these two types of the firms. However it was

expected that reduction in the carbon emission is higher for those firms who thinks about the
climate change as compared to the firms who makes their business strategies without taking the
climate change into account. The different in the current research is may be because of the
sample included for the analysis. The issues of climate change has been one of the serious
concern of the global world and there has been various steps taken by national and international
organisations in the recent time. The Paris agreement is one of the latest example to show, how
important climate change has become. However, the recent decision of USA to withdraw from
the agreement has made the entire agreement in danger. This is because USA is one of the
highest producer of carbon emission in the entire world. Now, the time has come that all the
countries come together to think seriously about the climate change and start making the planet
more livable for all the species.
Apart from the above results, the current research can be of great importance in terms of both the
managerial and the academic usage. In terms of the managerial implication, the results from the
study can be used by various government organization and the environmental institutes to frame
policies related to environmental regulations. This will also help the managers in the firms to
know about their carbon emission and start preparing strategies to reduce the carbon emission.
On the other hand this research have theoretical implications also. The research methods and the
analysis techniques used in this paper can be used to build model and theories in other research.
Also the current research is expected to contribute to existing environmental theories.
Limitations of the research
Some of the major limitations of the current research are as follows:
The sample size included in this study is only 106 which is very less. Also the sample
includes the data only from the four countries.
Another limitation was related to the data processing. Since the data was collected from
the CDP data base a lot of data cleaning was required.
Since the sample is very less and only few countries are involved, it will be very difficult
to generalize the results from the current research to entire population.
The analysis techniques used for the current research are only the quantitative methods,
whereas the qualitative methods were not used.
Only the t-test was conducted, no other techniques was used.
⊘ This is a preview!⊘
Do you want full access?
Subscribe today to unlock all pages.
Trusted by 1+ million students worldwide

Limitations related to the cost and the time devoted to the research.
Future research
Future research can be conducted using following points:
A large sample size can be used which will make the results more robust.
Data from other sources can also be used which will give more clear picture.
Similar research can be conducted taking into account more countries which will help to
generalize the results from the study.
Also, further research can be conducted using other statistical techniques such as the
correlation analysis, chi square test, regression analysis etc.
Qualitative analysis can be conducted on the similar area which will provide more in-
depth knowledge about the topic.
References
Antonio, L, Lopez, Arce, Guadalupe, Kronenberg & Tobias 2013, ‘Pollution haven hypothesis in
emissions embodied in world trade: The relevance of global value chains’, The wealth of nations
in a globalizing world, pp. 18–19.
Chakraborty, C & Reagle, D 2003, ‘Liberalization, FDI, and Growth in Developing Countries: A
Panel Cointegration Approach’, Economic Inquiry, vol. 8, pp. 510–566.
He, J & Fu, J 2011, Is « Pollution Haven » Hypothesis valid for China’s manufacture sectors?
An empirical analysis based on carbon embodied in trade,.
Heckscher, T 2012, ‘Pollution Haven Hypothesis’,.
Honglei, C, Xiaorong, Z & Qiufeng, C 2010, ‘Export-oriented Economy & Environmental
Pollution in China: the Empirical Study by Simultaneous Equation Model’, Energy Procedia,
vol. 5, pp. 884–889.
Kuada, J 2012, Research Methodology: A Project Guide for University Students,
Samfundslitteratur.
Paraphrase This Document
Need a fresh take? Get an instant paraphrase of this document with our AI Paraphraser

Lo´pez-Gamero, MD, Molina-Azorı´n, JF & S, EC-C 2009, ‘The whole relationship between
environmental variables and firm performance: Competitive advantage and firm resources as
mediator variables’, Journal of Environmental Management, vol. 30, pp. 1–12.
Müller-Falcke, D 2002, ‘Use and Impact of Information and Communication Technologies in
Developing Countries’ Small Businesses’, Development Economics and Policy, vol. 27.
Panayotou, T & Sachs, J 2005, ., Developing Countries and the Control of Climate Change: A
Theoretical Perspective and Policy Implications, Madrid.
Phimphanthavong, H 2013, ‘The Impacts of Economic Growth on Environmental Conditions in
Laos’, International Journal of Business Management and Economic Research, vol. 4, pp. 766–
774.
Rosa1, FS da & Luana Caroline Silva 2017, ‘Environmental sustainability in hotels, theoretical
and methodological contribution’, Brazilian Journal of Tourism Research, vol. 11, no. 1, pp. 39–
60.
Thompson, A 2014, ‘Environmental Kuznets Curve for Water Pollution : The Case of Border
Countries’, Modern Economy, vol. 1, no. 5, pp. 66–69.
UNCTAD 2011, World Investment Report 2011: Non-Equity Modes of International Production
and Development, New York and Geneva.
Vivarelli, M 2014, ‘Innovation, employment and skills in advanced and developing countries: A
survey of economic literature.’, ournal of Economic Issues, vol. 48, no. 1, pp. 123–154.
1 out of 8
Related Documents


Your All-in-One AI-Powered Toolkit for Academic Success.
+13062052269
info@desklib.com
Available 24*7 on WhatsApp / Email
![[object Object]](/_next/static/media/star-bottom.7253800d.svg)
Unlock your academic potential
Copyright © 2020–2026 A2Z Services. All Rights Reserved. Developed and managed by ZUCOL.