Research Management: Carbon Emissions Analysis & Country Data
VerifiedAdded on 2023/06/07
|11
|1957
|333
Report
AI Summary
This research management report analyzes carbon emissions data from Australia, Belgium, and Brazil in 2012, utilizing descriptive and inferential statistics to investigate carbon intensity and percentage changes in emissions. The study examines the distribution of companies across countries, the responsibility levels for climate change decisions within organizations, and the integration of climate change policies into business strategies. The report tests hypotheses related to differences in carbon intensity and percentage changes across countries and responsibility levels, as well as the impact of incentives on carbon emissions. One-way ANOVA and independent samples t-tests are employed, revealing no significant differences in carbon emissions based on country or responsibility level. The findings suggest that incentives related to climate change management do not significantly affect carbon intensity emissions. The report includes detailed statistical tables, frequency distributions, and references to relevant literature, offering a comprehensive analysis of carbon emissions management.

RESEARCH MANAGEMENT
By Name
Course
Instructor
Institution
Location
Date
By Name
Course
Instructor
Institution
Location
Date
Paraphrase This Document
Need a fresh take? Get an instant paraphrase of this document with our AI Paraphraser
Data collection
Data was obtained from a database that contain all the carbon emissions data for all the countries
around the globe. The dataset are categorized for the different industries in different countries
working on different sectors of economy. We considered the 2012 data set for three countries;
Australia, Belgium and Brazil. There were a total of 218 observations (industries) considered for
this study with 80 companies from Australia, 11 companies from Belgium and 127 companies
from Brazil. A separate excel file is submitted together with this report.
Data Analysis
Descriptive Statistics
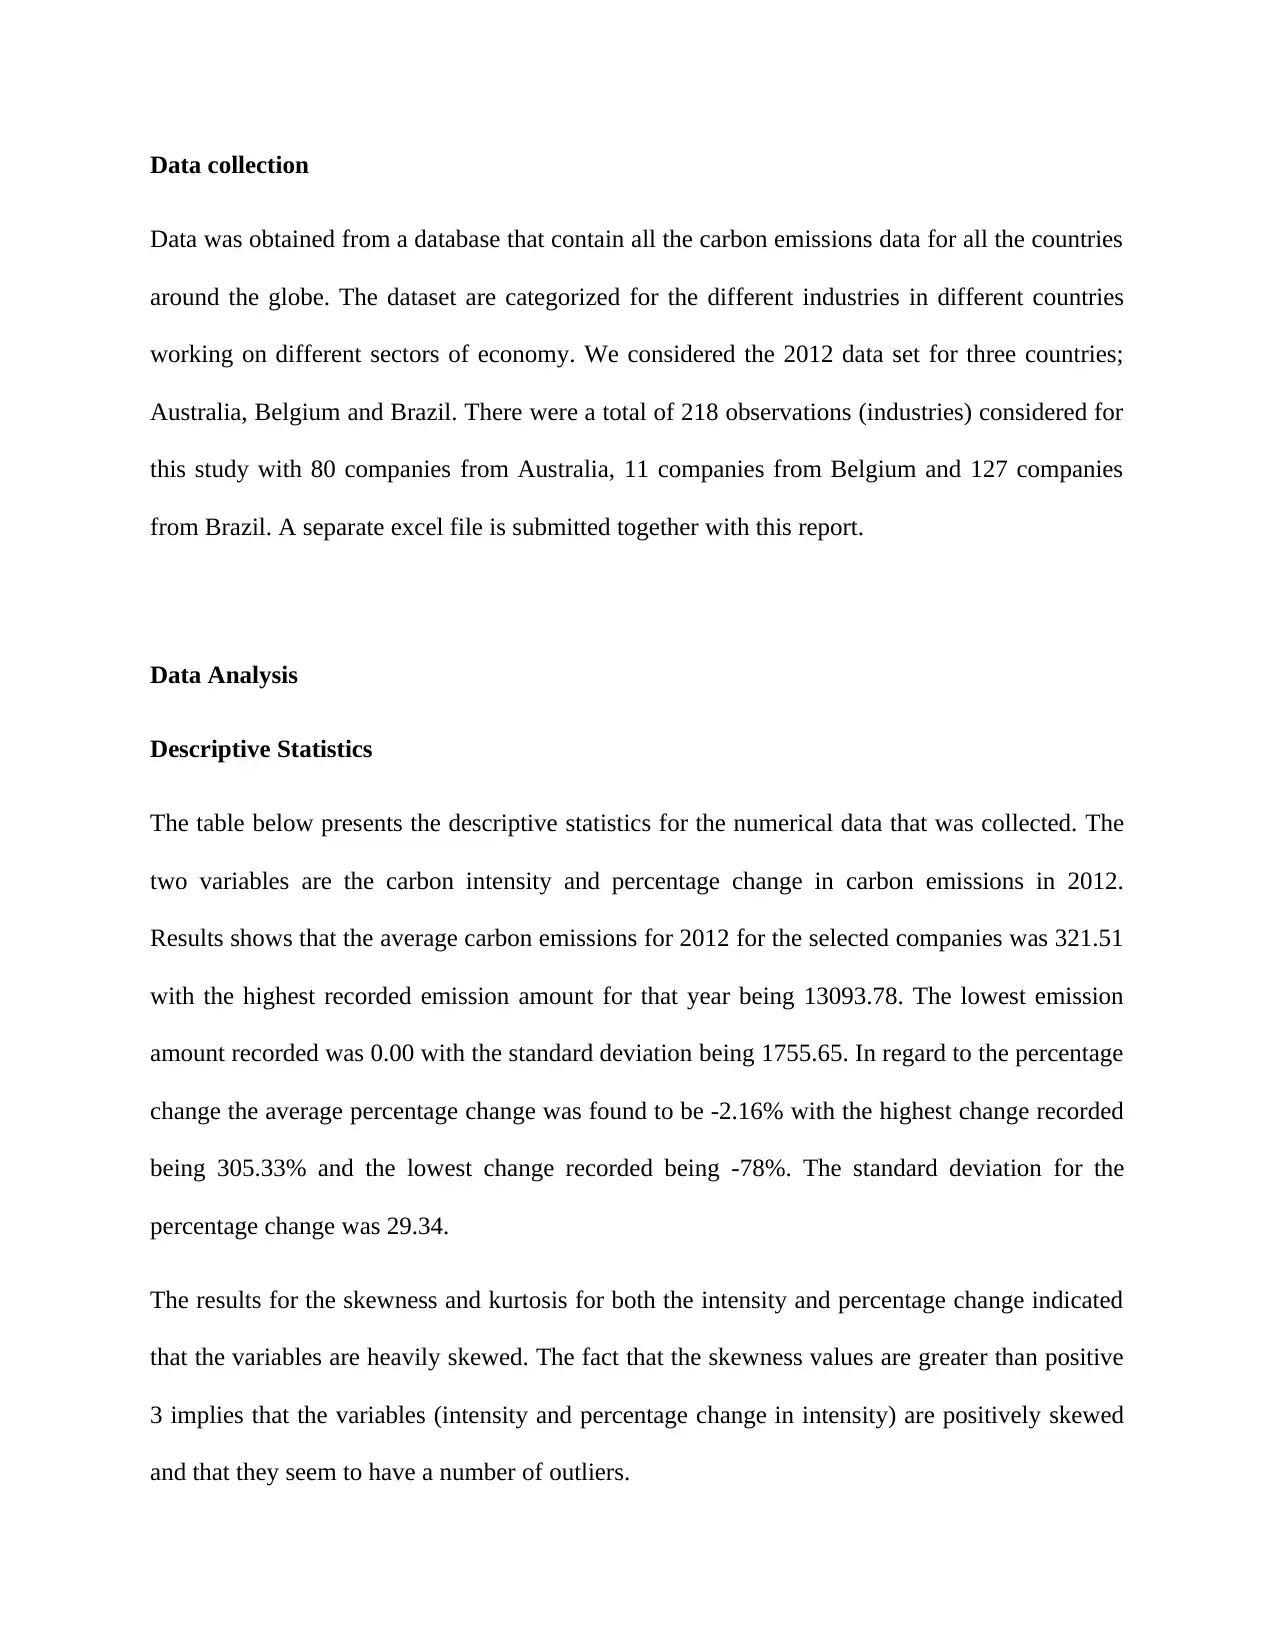
The table below presents the descriptive statistics for the numerical data that was collected. The
two variables are the carbon intensity and percentage change in carbon emissions in 2012.
Results shows that the average carbon emissions for 2012 for the selected companies was 321.51
with the highest recorded emission amount for that year being 13093.78. The lowest emission
amount recorded was 0.00 with the standard deviation being 1755.65. In regard to the percentage
change the average percentage change was found to be -2.16% with the highest change recorded
being 305.33% and the lowest change recorded being -78%. The standard deviation for the
percentage change was 29.34.
The results for the skewness and kurtosis for both the intensity and percentage change indicated
that the variables are heavily skewed. The fact that the skewness values are greater than positive
3 implies that the variables (intensity and percentage change in intensity) are positively skewed
and that they seem to have a number of outliers.
Data was obtained from a database that contain all the carbon emissions data for all the countries
around the globe. The dataset are categorized for the different industries in different countries
working on different sectors of economy. We considered the 2012 data set for three countries;
Australia, Belgium and Brazil. There were a total of 218 observations (industries) considered for
this study with 80 companies from Australia, 11 companies from Belgium and 127 companies
from Brazil. A separate excel file is submitted together with this report.
Data Analysis
Descriptive Statistics
The table below presents the descriptive statistics for the numerical data that was collected. The
two variables are the carbon intensity and percentage change in carbon emissions in 2012.
Results shows that the average carbon emissions for 2012 for the selected companies was 321.51
with the highest recorded emission amount for that year being 13093.78. The lowest emission
amount recorded was 0.00 with the standard deviation being 1755.65. In regard to the percentage
change the average percentage change was found to be -2.16% with the highest change recorded
being 305.33% and the lowest change recorded being -78%. The standard deviation for the
percentage change was 29.34.
The results for the skewness and kurtosis for both the intensity and percentage change indicated
that the variables are heavily skewed. The fact that the skewness values are greater than positive
3 implies that the variables (intensity and percentage change in intensity) are positively skewed
and that they seem to have a number of outliers.
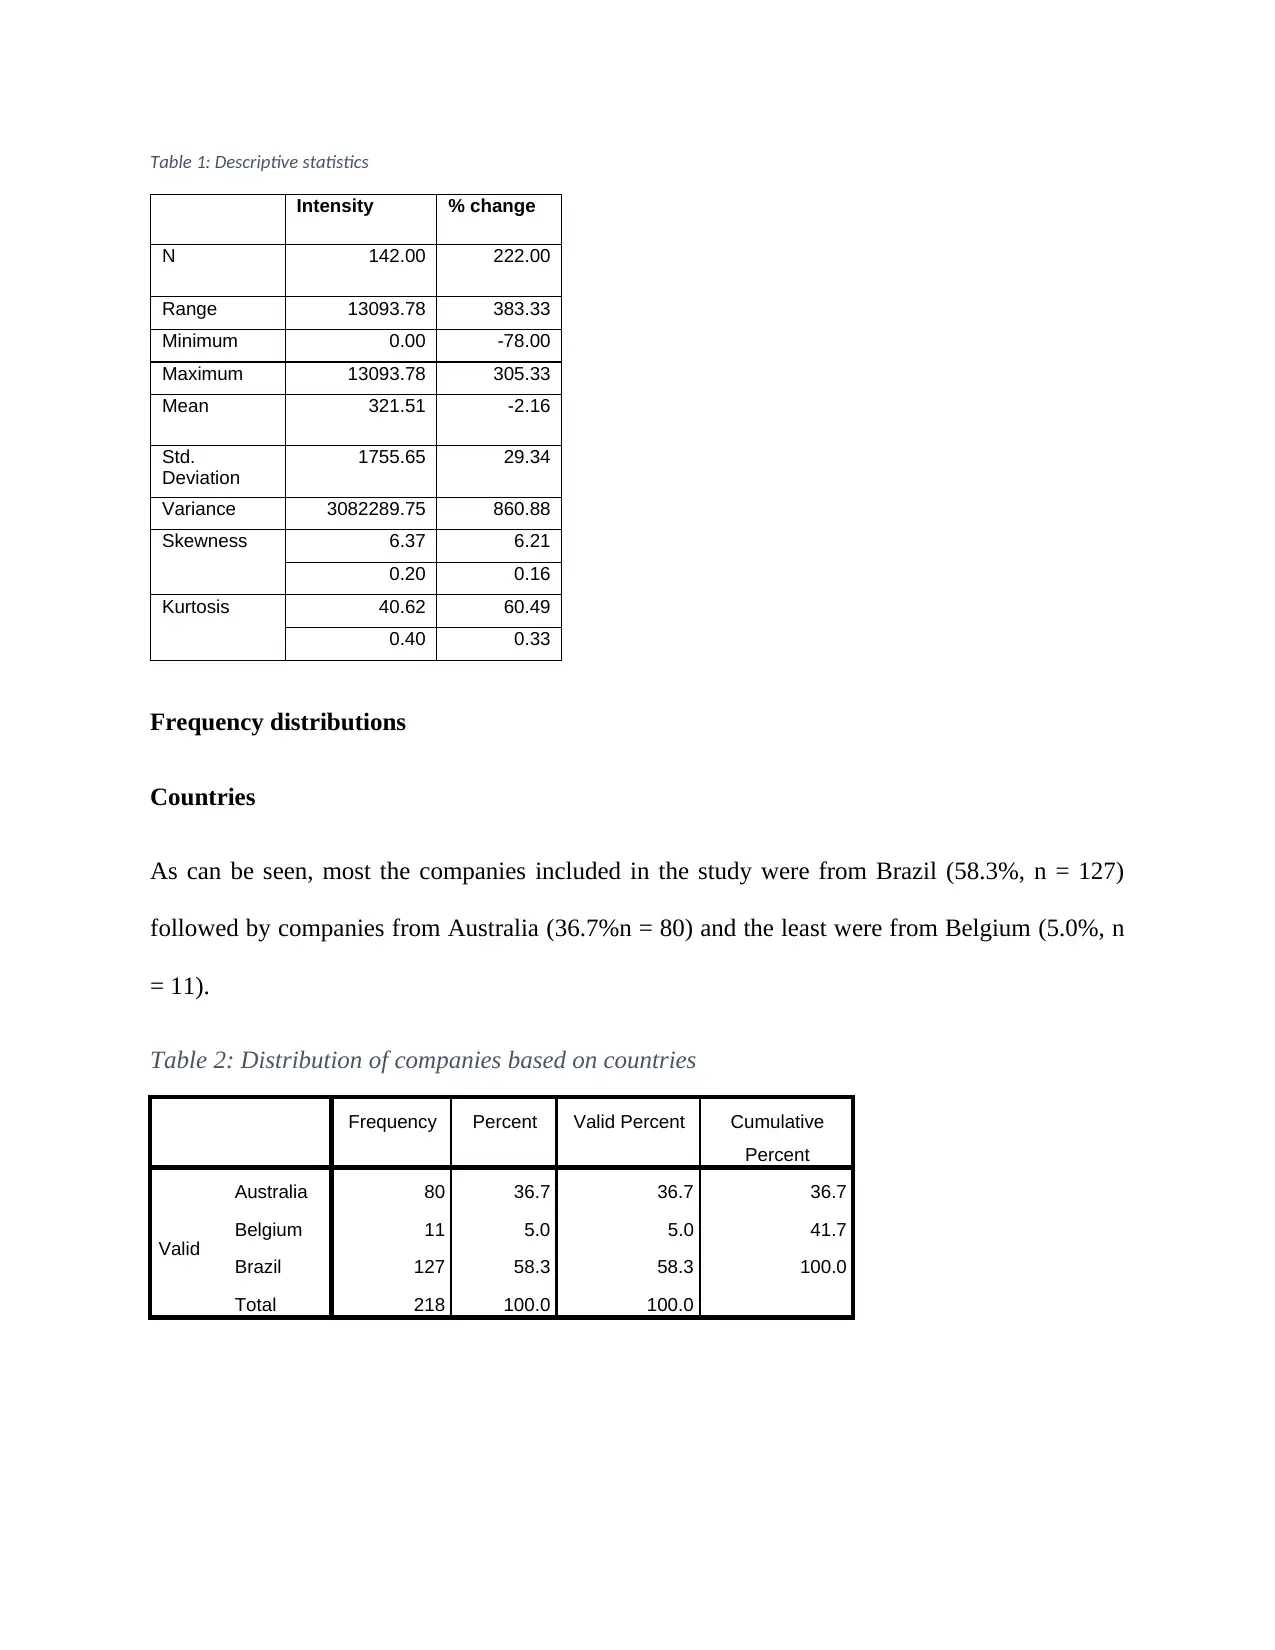
Table 1: Descriptive statistics
Intensity % change
N 142.00 222.00
Range 13093.78 383.33
Minimum 0.00 -78.00
Maximum 13093.78 305.33
Mean 321.51 -2.16
Std.
Deviation
1755.65 29.34
Variance 3082289.75 860.88
Skewness 6.37 6.21
0.20 0.16
Kurtosis 40.62 60.49
0.40 0.33
Frequency distributions
Countries
As can be seen, most the companies included in the study were from Brazil (58.3%, n = 127)
followed by companies from Australia (36.7%n = 80) and the least were from Belgium (5.0%, n
= 11).
Table 2: Distribution of companies based on countries
Frequency Percent Valid Percent Cumulative
Percent
Valid
Australia 80 36.7 36.7 36.7
Belgium 11 5.0 5.0 41.7
Brazil 127 58.3 58.3 100.0
Total 218 100.0 100.0
⊘ This is a preview!⊘
Do you want full access?
Subscribe today to unlock all pages.
Trusted by 1+ million students worldwide
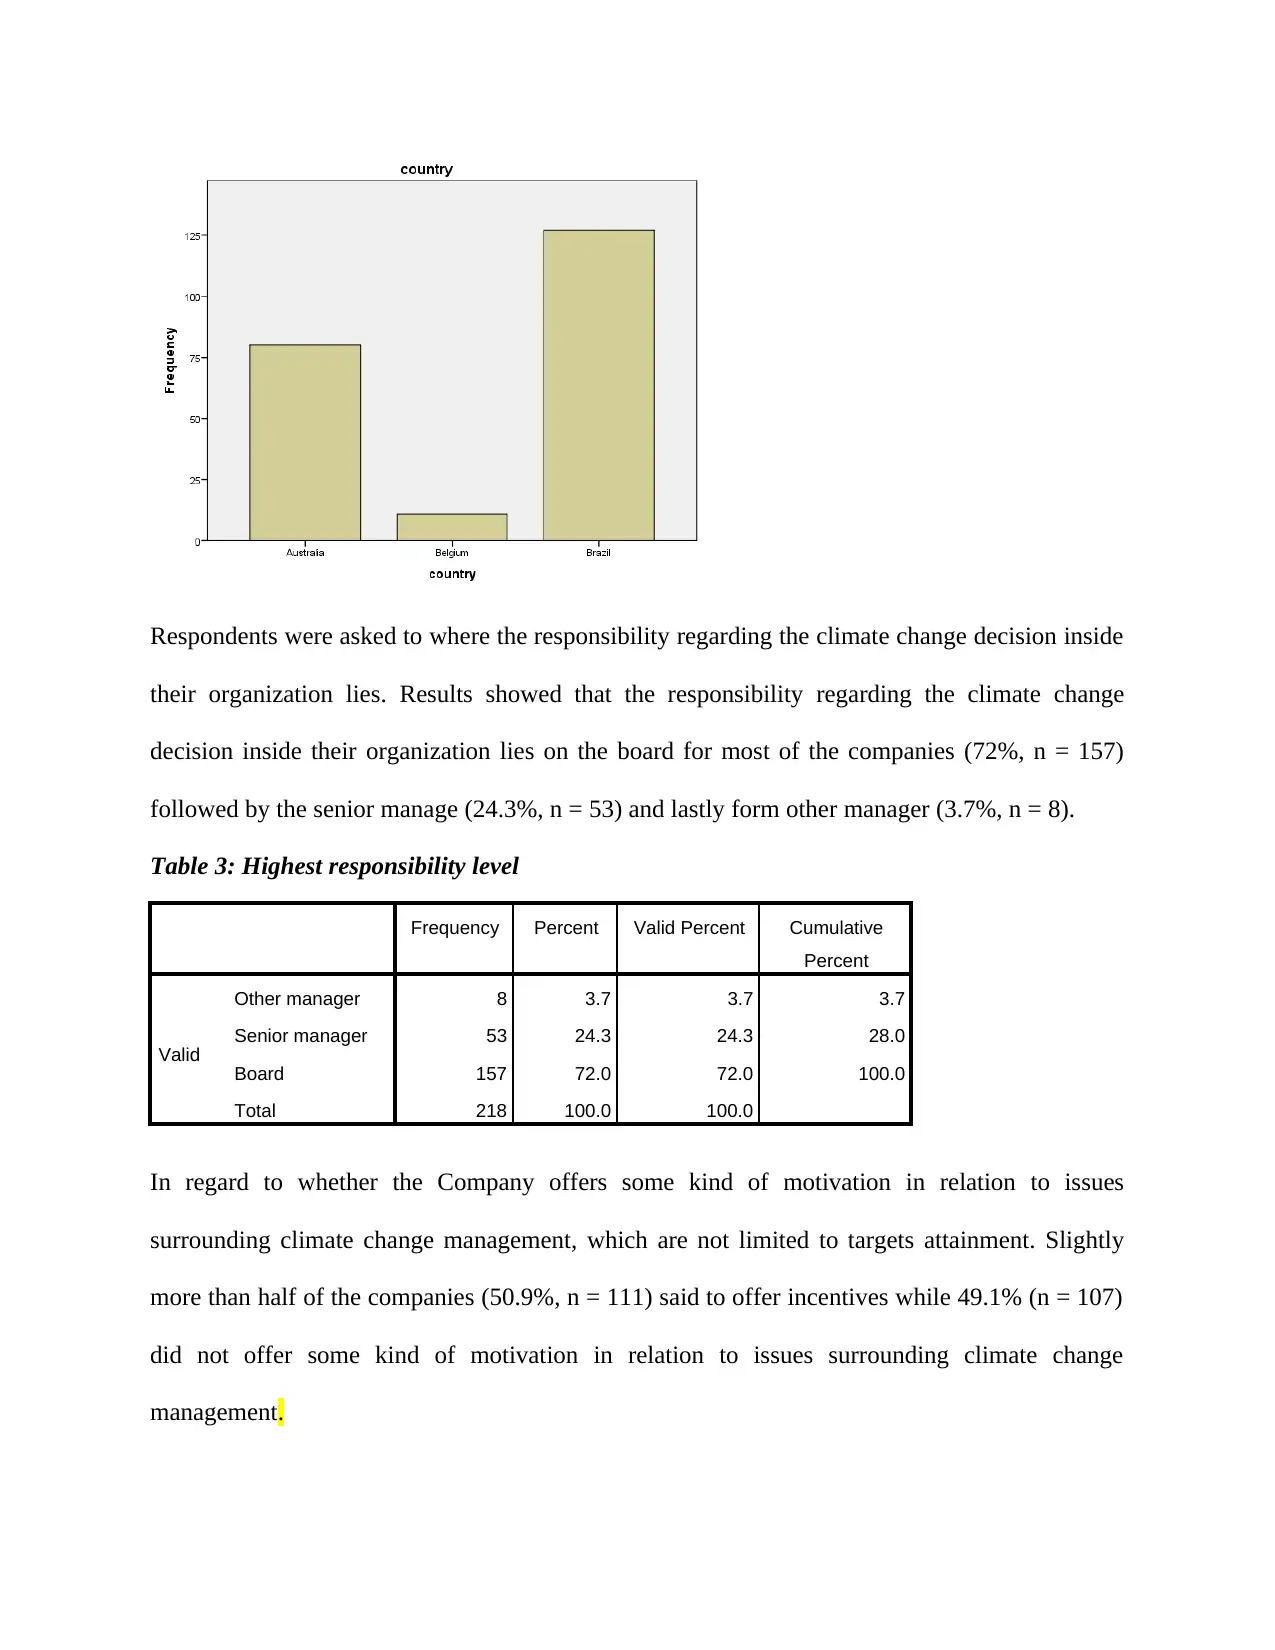
Respondents were asked to where the responsibility regarding the climate change decision inside
their organization lies. Results showed that the responsibility regarding the climate change
decision inside their organization lies on the board for most of the companies (72%, n = 157)
followed by the senior manage (24.3%, n = 53) and lastly form other manager (3.7%, n = 8).
Table 3: Highest responsibility level
Frequency Percent Valid Percent Cumulative
Percent
Valid
Other manager 8 3.7 3.7 3.7
Senior manager 53 24.3 24.3 28.0
Board 157 72.0 72.0 100.0
Total 218 100.0 100.0
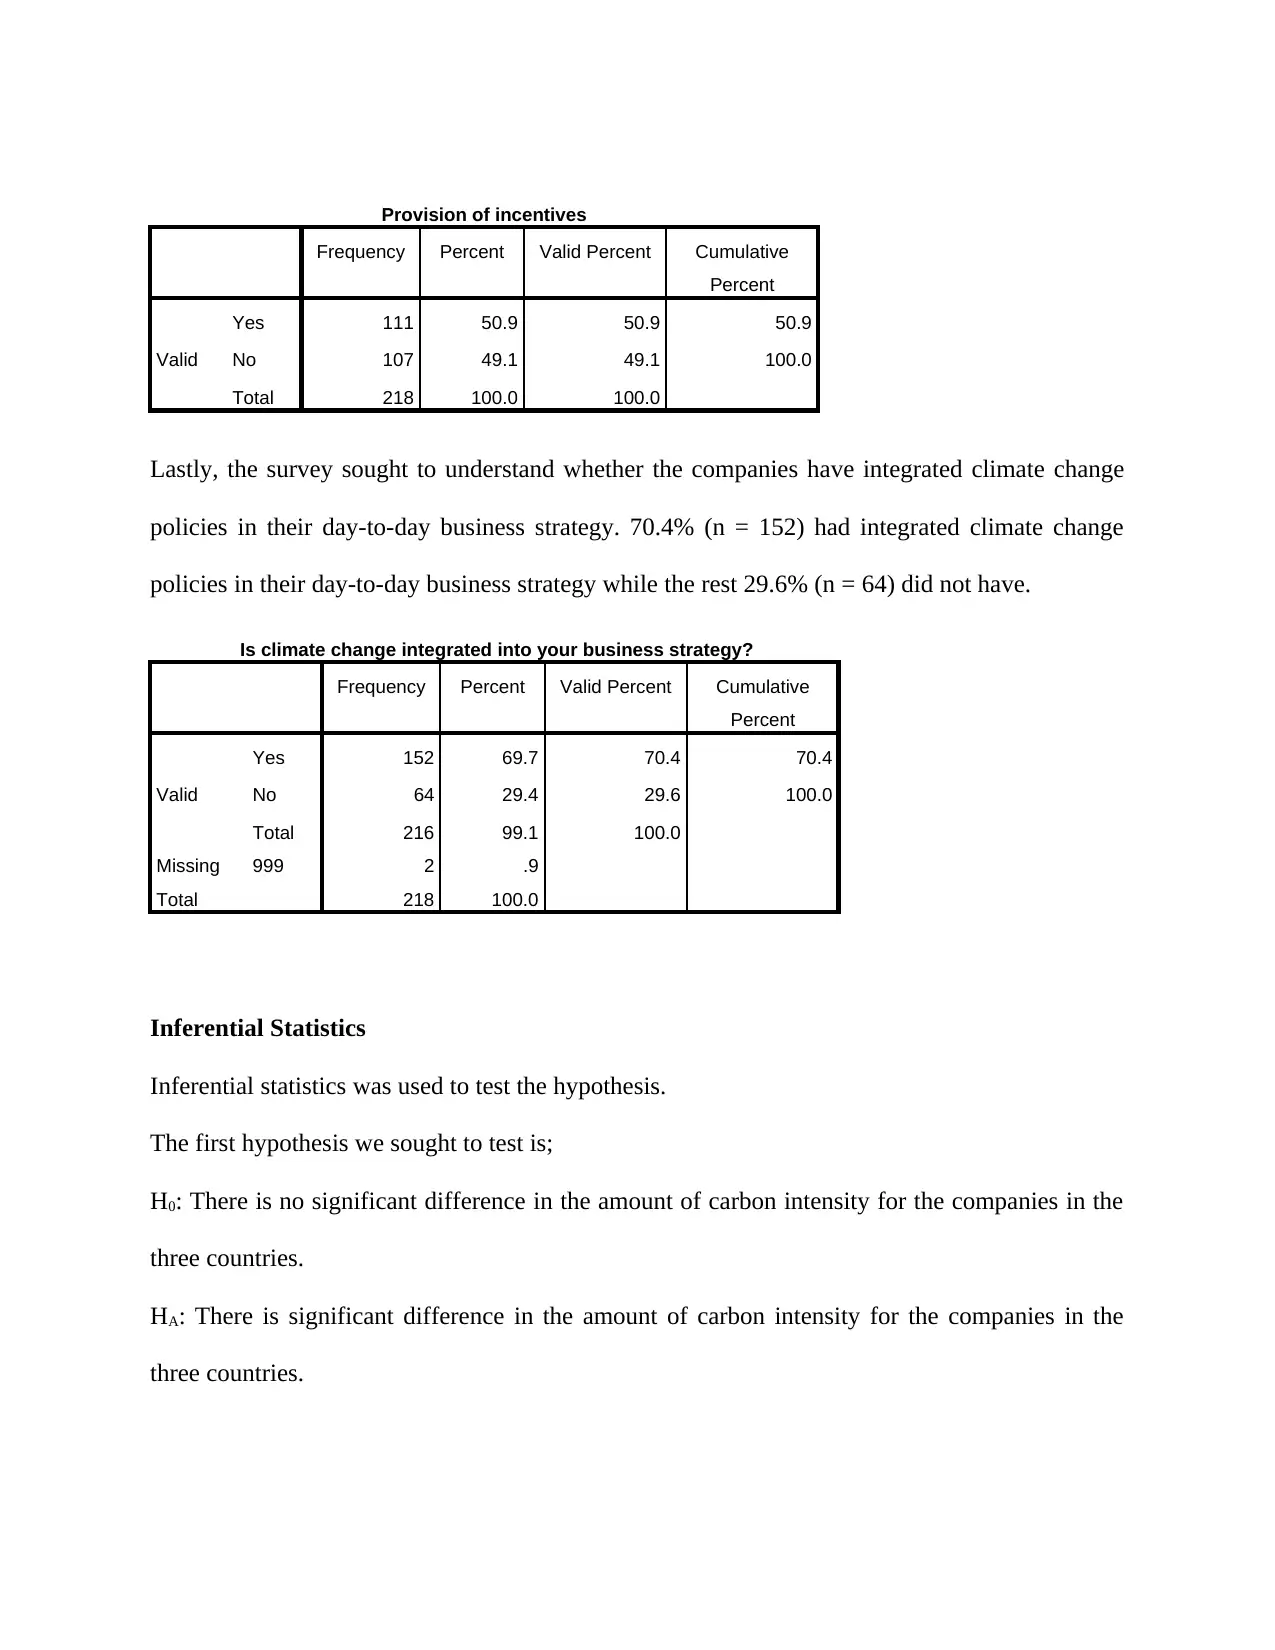
In regard to whether the Company offers some kind of motivation in relation to issues
surrounding climate change management, which are not limited to targets attainment. Slightly
more than half of the companies (50.9%, n = 111) said to offer incentives while 49.1% (n = 107)
did not offer some kind of motivation in relation to issues surrounding climate change
management.
their organization lies. Results showed that the responsibility regarding the climate change
decision inside their organization lies on the board for most of the companies (72%, n = 157)
followed by the senior manage (24.3%, n = 53) and lastly form other manager (3.7%, n = 8).
Table 3: Highest responsibility level
Frequency Percent Valid Percent Cumulative
Percent
Valid
Other manager 8 3.7 3.7 3.7
Senior manager 53 24.3 24.3 28.0
Board 157 72.0 72.0 100.0
Total 218 100.0 100.0
In regard to whether the Company offers some kind of motivation in relation to issues
surrounding climate change management, which are not limited to targets attainment. Slightly
more than half of the companies (50.9%, n = 111) said to offer incentives while 49.1% (n = 107)
did not offer some kind of motivation in relation to issues surrounding climate change
management.
Paraphrase This Document
Need a fresh take? Get an instant paraphrase of this document with our AI Paraphraser
Provision of incentives
Frequency Percent Valid Percent Cumulative
Percent
Valid
Yes 111 50.9 50.9 50.9
No 107 49.1 49.1 100.0
Total 218 100.0 100.0
Lastly, the survey sought to understand whether the companies have integrated climate change
policies in their day-to-day business strategy. 70.4% (n = 152) had integrated climate change
policies in their day-to-day business strategy while the rest 29.6% (n = 64) did not have.
Is climate change integrated into your business strategy?
Frequency Percent Valid Percent Cumulative
Percent
Valid
Yes 152 69.7 70.4 70.4
No 64 29.4 29.6 100.0
Total 216 99.1 100.0
Missing 999 2 .9
Total 218 100.0
Inferential Statistics
Inferential statistics was used to test the hypothesis.
The first hypothesis we sought to test is;
H0: There is no significant difference in the amount of carbon intensity for the companies in the
three countries.
HA: There is significant difference in the amount of carbon intensity for the companies in the
three countries.
Frequency Percent Valid Percent Cumulative
Percent
Valid
Yes 111 50.9 50.9 50.9
No 107 49.1 49.1 100.0
Total 218 100.0 100.0
Lastly, the survey sought to understand whether the companies have integrated climate change
policies in their day-to-day business strategy. 70.4% (n = 152) had integrated climate change
policies in their day-to-day business strategy while the rest 29.6% (n = 64) did not have.
Is climate change integrated into your business strategy?
Frequency Percent Valid Percent Cumulative
Percent
Valid
Yes 152 69.7 70.4 70.4
No 64 29.4 29.6 100.0
Total 216 99.1 100.0
Missing 999 2 .9
Total 218 100.0
Inferential Statistics
Inferential statistics was used to test the hypothesis.
The first hypothesis we sought to test is;
H0: There is no significant difference in the amount of carbon intensity for the companies in the
three countries.
HA: There is significant difference in the amount of carbon intensity for the companies in the
three countries.
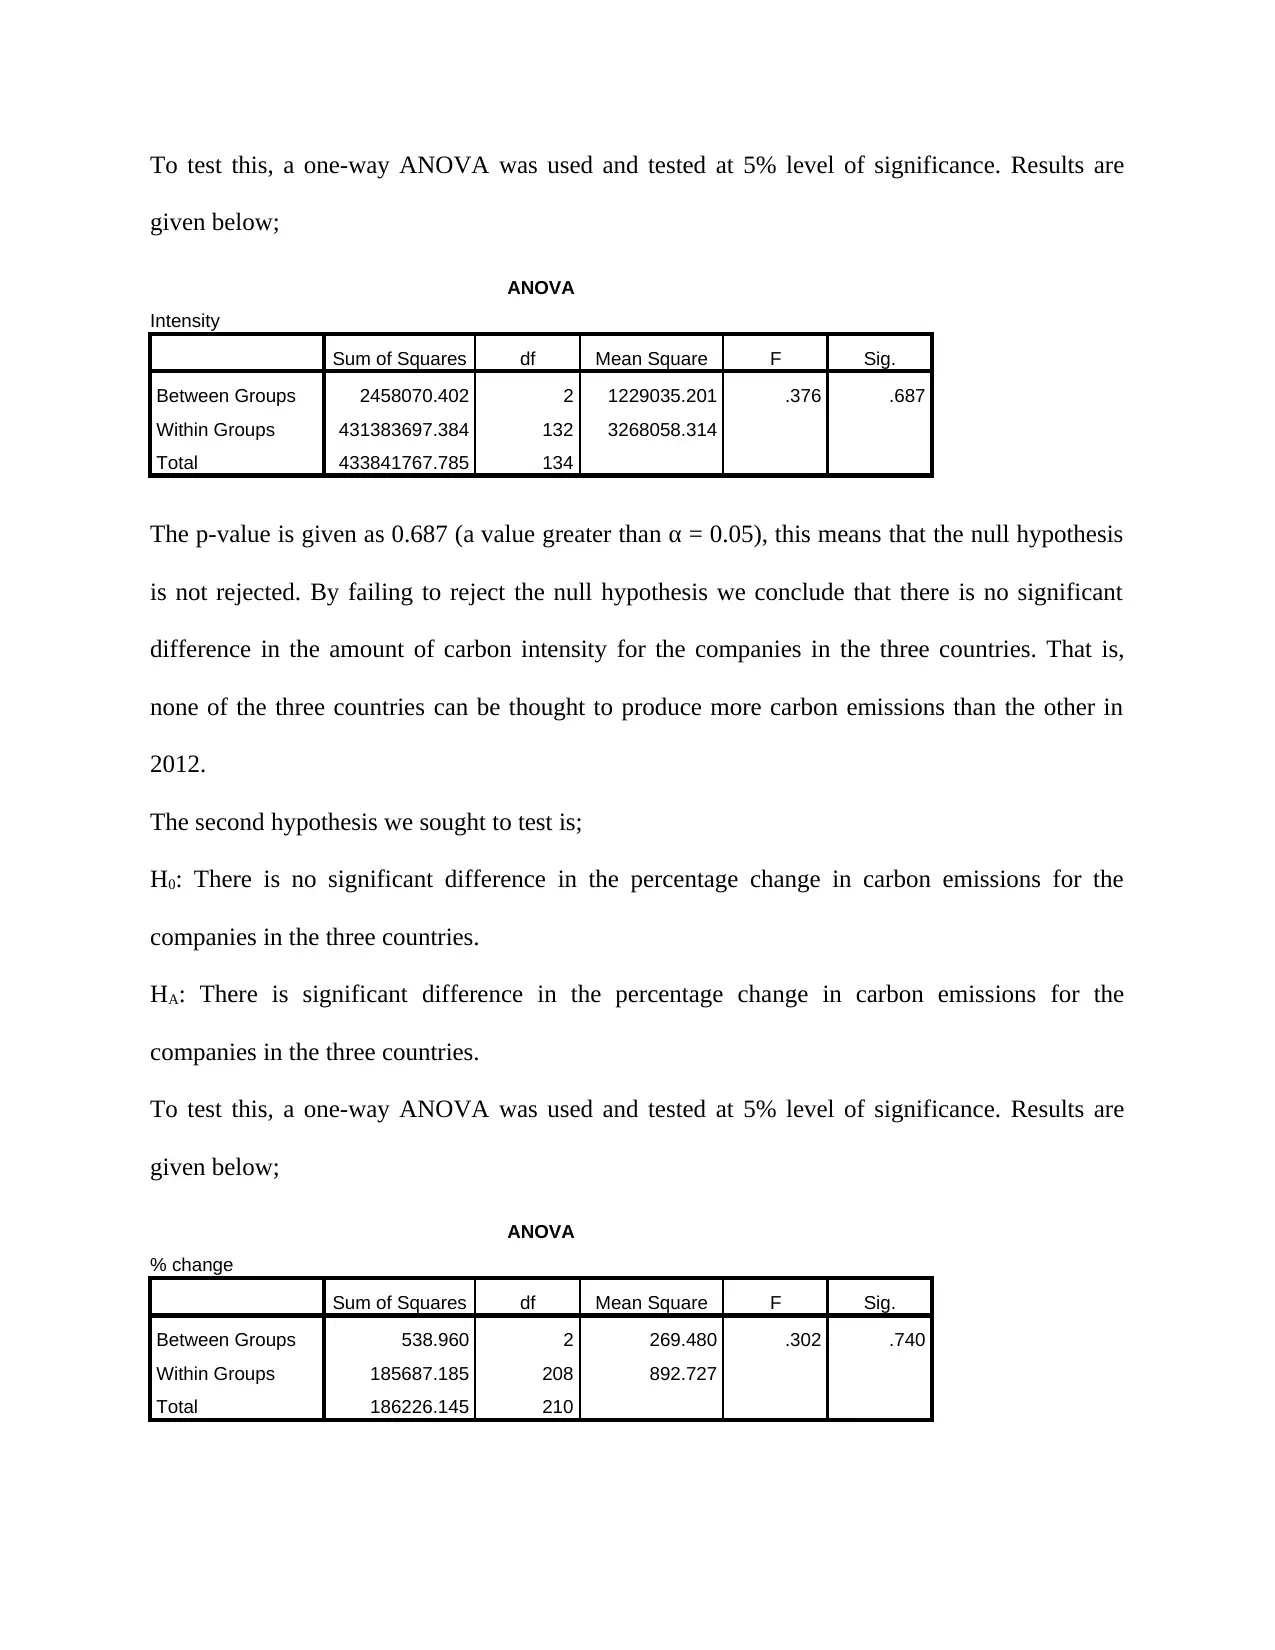
To test this, a one-way ANOVA was used and tested at 5% level of significance. Results are
given below;
ANOVA
Intensity
Sum of Squares df Mean Square F Sig.
Between Groups 2458070.402 2 1229035.201 .376 .687
Within Groups 431383697.384 132 3268058.314
Total 433841767.785 134
The p-value is given as 0.687 (a value greater than α = 0.05), this means that the null hypothesis
is not rejected. By failing to reject the null hypothesis we conclude that there is no significant
difference in the amount of carbon intensity for the companies in the three countries. That is,
none of the three countries can be thought to produce more carbon emissions than the other in
2012.
The second hypothesis we sought to test is;
H0: There is no significant difference in the percentage change in carbon emissions for the
companies in the three countries.
HA: There is significant difference in the percentage change in carbon emissions for the
companies in the three countries.
To test this, a one-way ANOVA was used and tested at 5% level of significance. Results are
given below;
ANOVA
% change
Sum of Squares df Mean Square F Sig.
Between Groups 538.960 2 269.480 .302 .740
Within Groups 185687.185 208 892.727
Total 186226.145 210
given below;
ANOVA
Intensity
Sum of Squares df Mean Square F Sig.
Between Groups 2458070.402 2 1229035.201 .376 .687
Within Groups 431383697.384 132 3268058.314
Total 433841767.785 134
The p-value is given as 0.687 (a value greater than α = 0.05), this means that the null hypothesis
is not rejected. By failing to reject the null hypothesis we conclude that there is no significant
difference in the amount of carbon intensity for the companies in the three countries. That is,
none of the three countries can be thought to produce more carbon emissions than the other in
2012.
The second hypothesis we sought to test is;
H0: There is no significant difference in the percentage change in carbon emissions for the
companies in the three countries.
HA: There is significant difference in the percentage change in carbon emissions for the
companies in the three countries.
To test this, a one-way ANOVA was used and tested at 5% level of significance. Results are
given below;
ANOVA
% change
Sum of Squares df Mean Square F Sig.
Between Groups 538.960 2 269.480 .302 .740
Within Groups 185687.185 208 892.727
Total 186226.145 210
⊘ This is a preview!⊘
Do you want full access?
Subscribe today to unlock all pages.
Trusted by 1+ million students worldwide
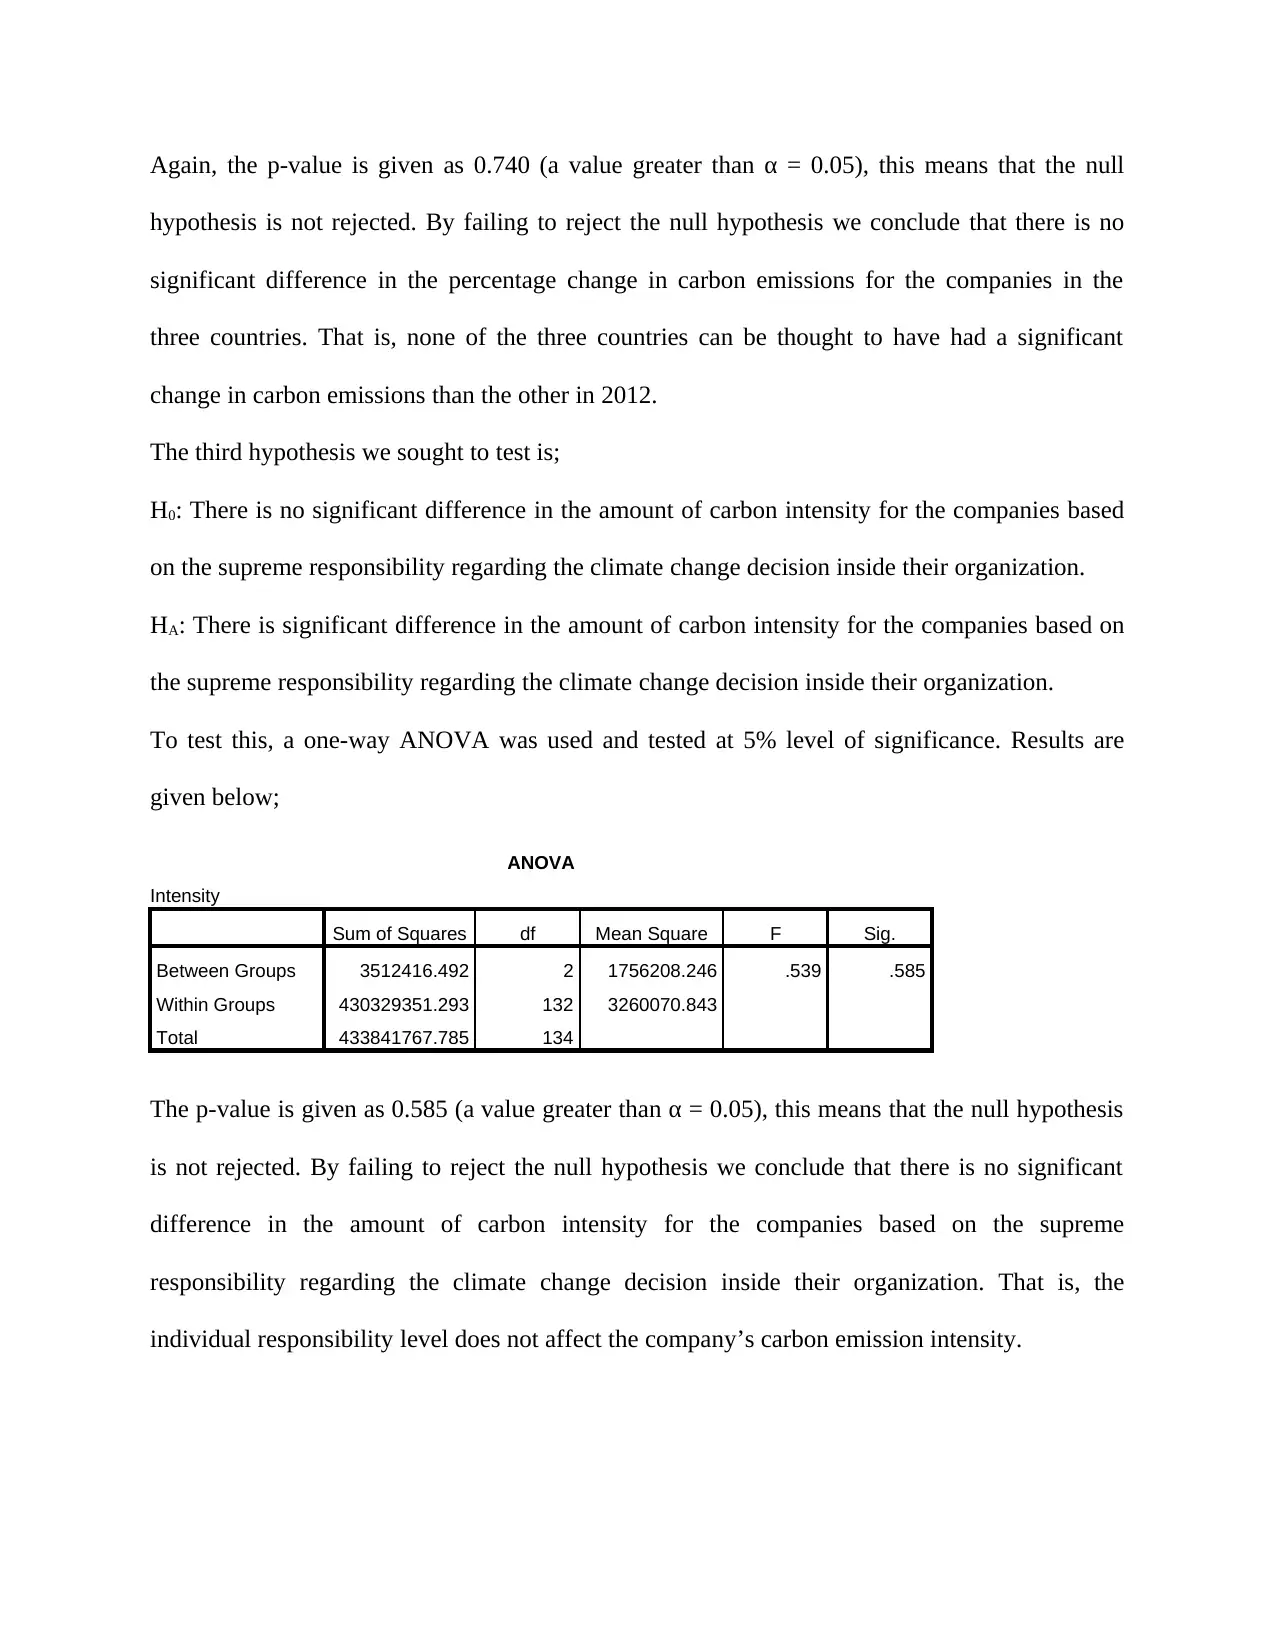
Again, the p-value is given as 0.740 (a value greater than α = 0.05), this means that the null
hypothesis is not rejected. By failing to reject the null hypothesis we conclude that there is no
significant difference in the percentage change in carbon emissions for the companies in the
three countries. That is, none of the three countries can be thought to have had a significant
change in carbon emissions than the other in 2012.
The third hypothesis we sought to test is;
H0: There is no significant difference in the amount of carbon intensity for the companies based
on the supreme responsibility regarding the climate change decision inside their organization.
HA: There is significant difference in the amount of carbon intensity for the companies based on
the supreme responsibility regarding the climate change decision inside their organization.
To test this, a one-way ANOVA was used and tested at 5% level of significance. Results are
given below;
ANOVA
Intensity
Sum of Squares df Mean Square F Sig.
Between Groups 3512416.492 2 1756208.246 .539 .585
Within Groups 430329351.293 132 3260070.843
Total 433841767.785 134
The p-value is given as 0.585 (a value greater than α = 0.05), this means that the null hypothesis
is not rejected. By failing to reject the null hypothesis we conclude that there is no significant
difference in the amount of carbon intensity for the companies based on the supreme
responsibility regarding the climate change decision inside their organization. That is, the
individual responsibility level does not affect the company’s carbon emission intensity.
Paraphrase This Document
Need a fresh take? Get an instant paraphrase of this document with our AI Paraphraser
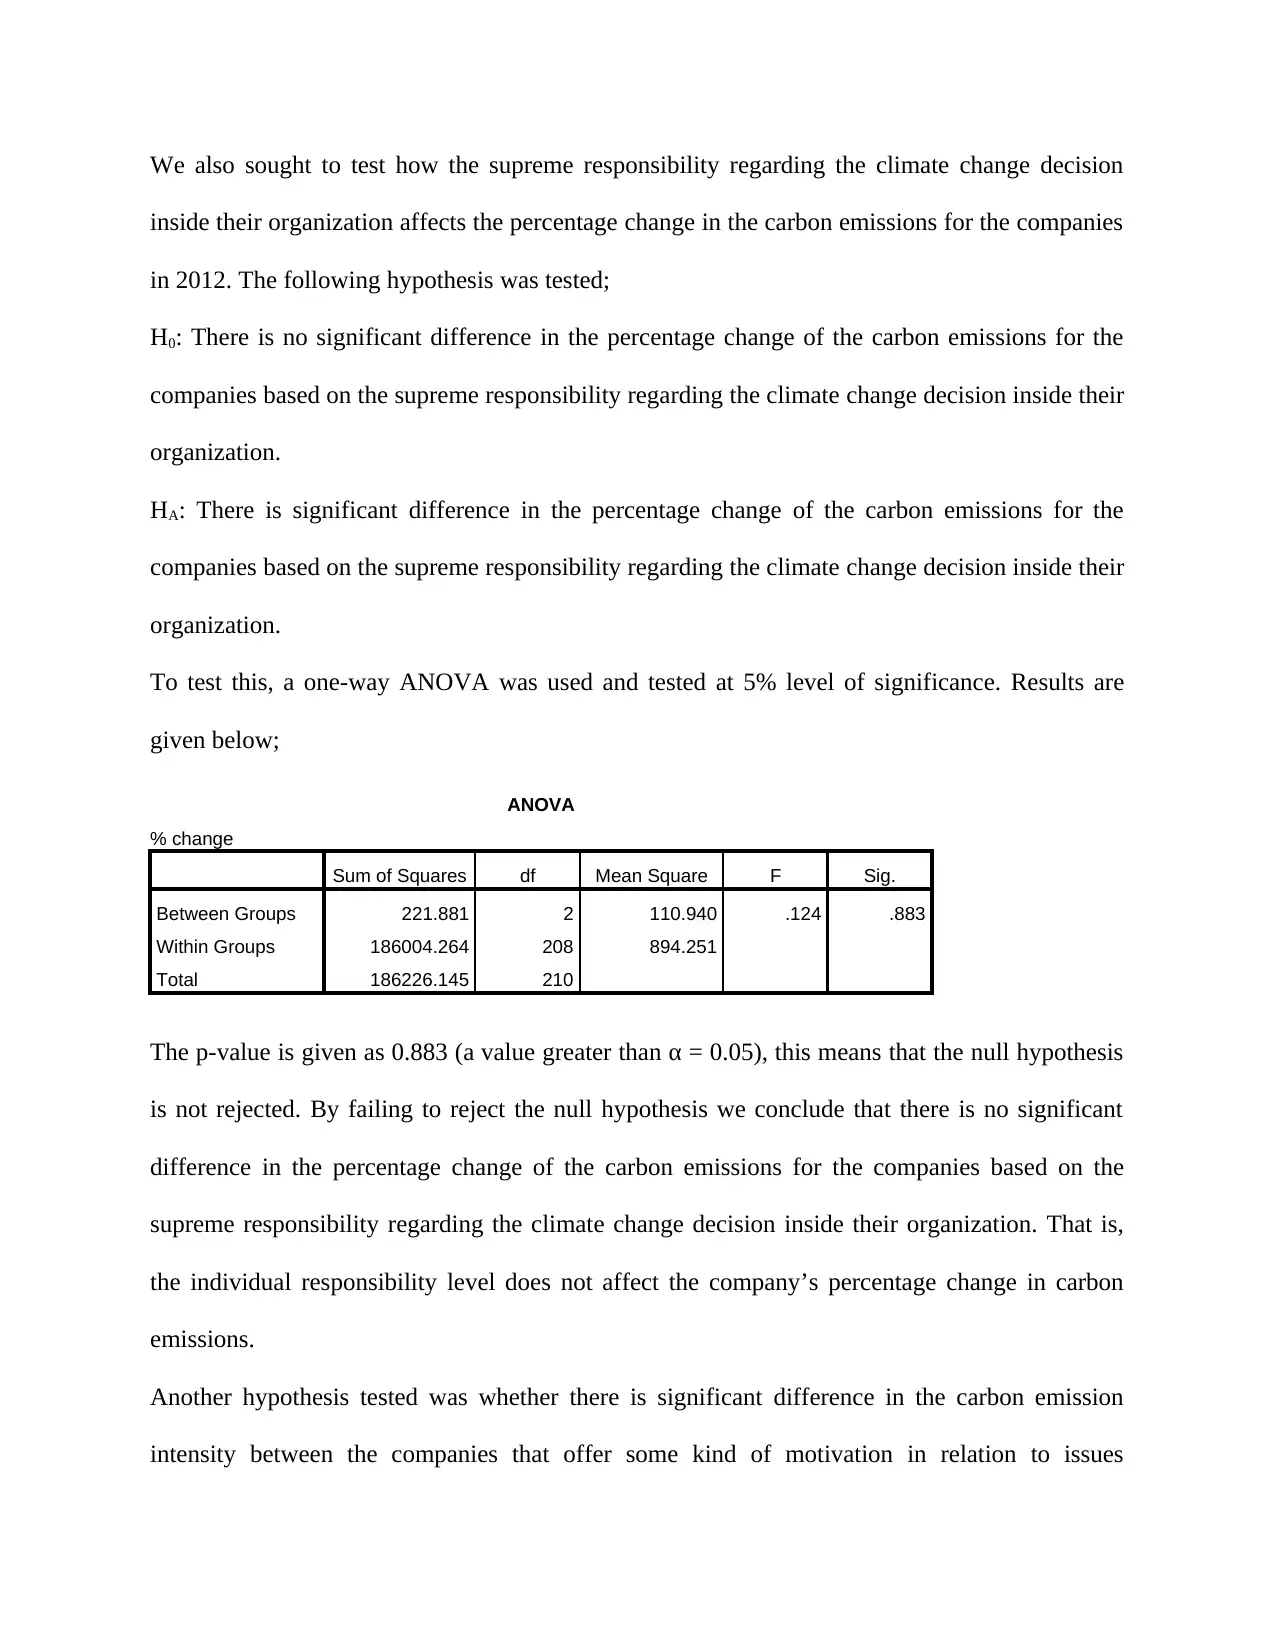
We also sought to test how the supreme responsibility regarding the climate change decision
inside their organization affects the percentage change in the carbon emissions for the companies
in 2012. The following hypothesis was tested;
H0: There is no significant difference in the percentage change of the carbon emissions for the
companies based on the supreme responsibility regarding the climate change decision inside their
organization.
HA: There is significant difference in the percentage change of the carbon emissions for the
companies based on the supreme responsibility regarding the climate change decision inside their
organization.
To test this, a one-way ANOVA was used and tested at 5% level of significance. Results are
given below;
ANOVA
% change
Sum of Squares df Mean Square F Sig.
Between Groups 221.881 2 110.940 .124 .883
Within Groups 186004.264 208 894.251
Total 186226.145 210
The p-value is given as 0.883 (a value greater than α = 0.05), this means that the null hypothesis
is not rejected. By failing to reject the null hypothesis we conclude that there is no significant
difference in the percentage change of the carbon emissions for the companies based on the
supreme responsibility regarding the climate change decision inside their organization. That is,
the individual responsibility level does not affect the company’s percentage change in carbon
emissions.
Another hypothesis tested was whether there is significant difference in the carbon emission
intensity between the companies that offer some kind of motivation in relation to issues
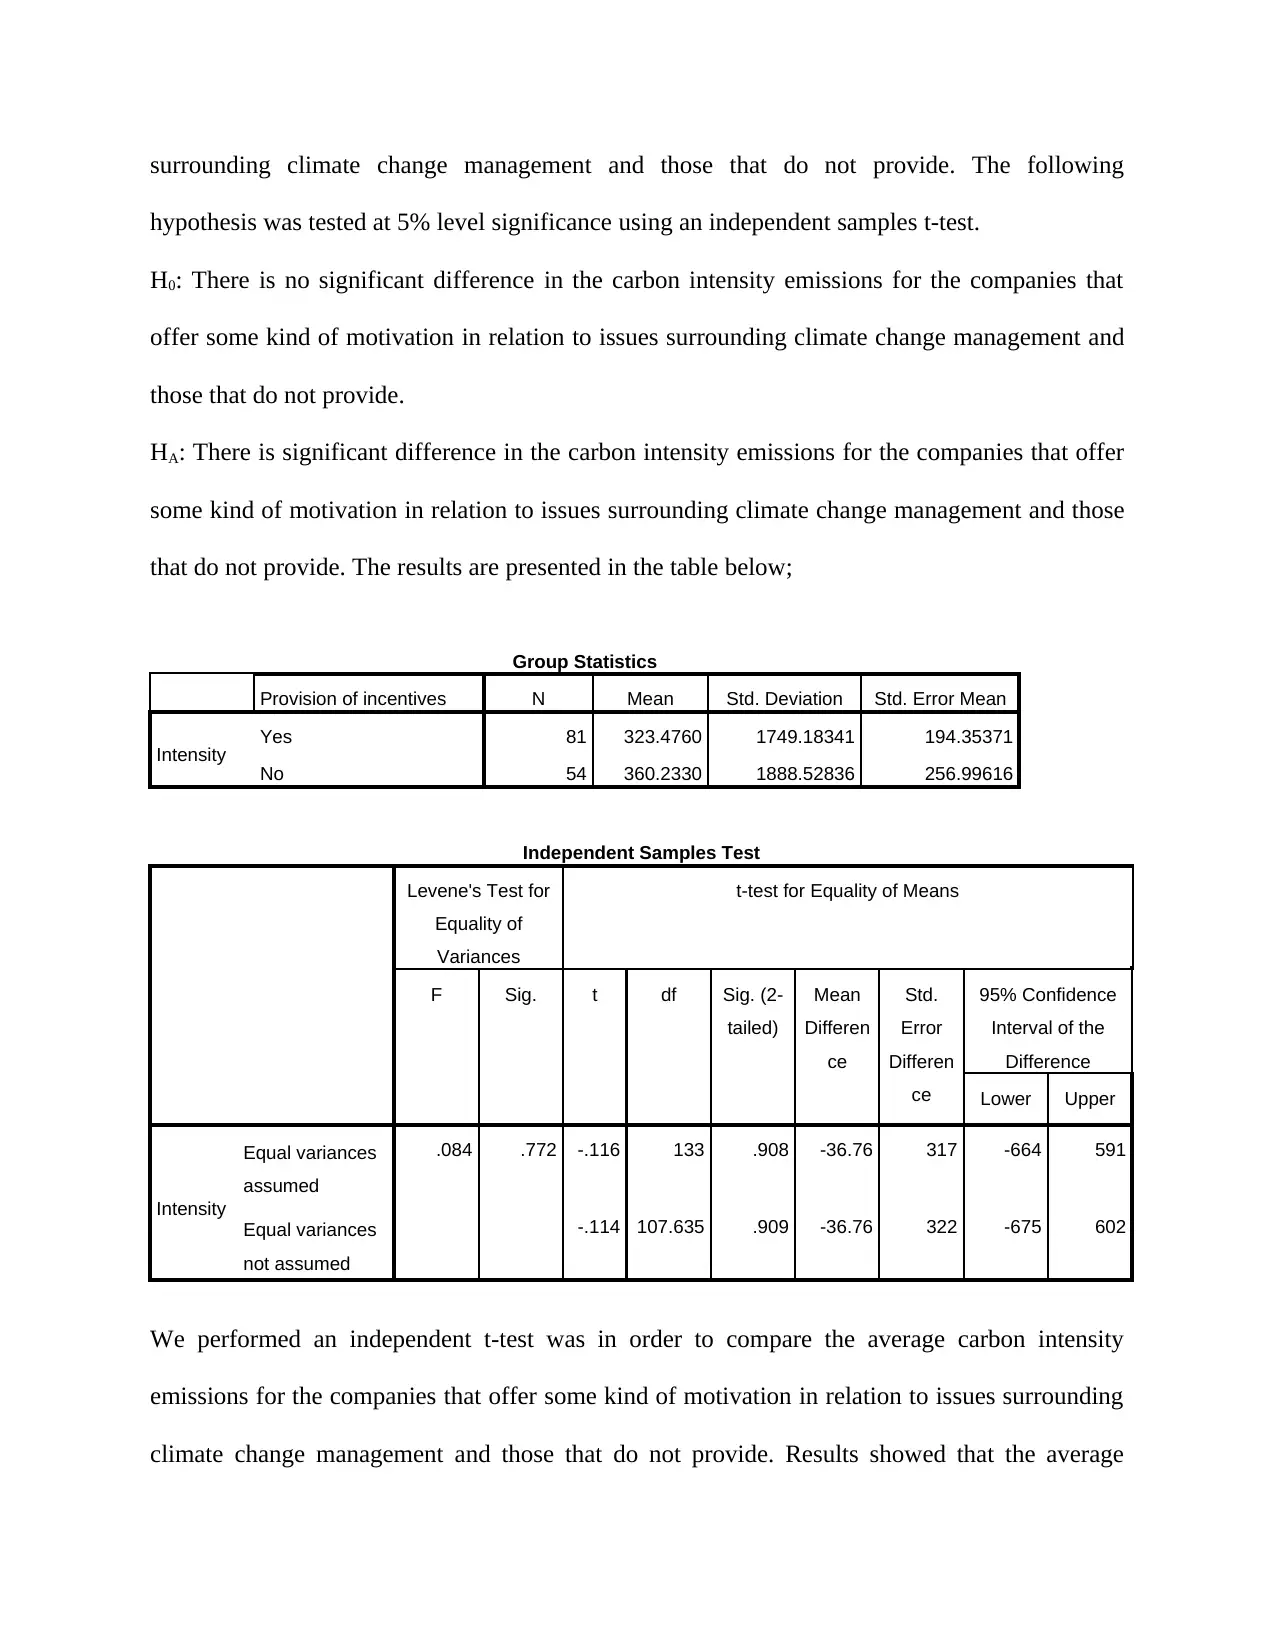
surrounding climate change management and those that do not provide. The following
hypothesis was tested at 5% level significance using an independent samples t-test.
H0: There is no significant difference in the carbon intensity emissions for the companies that
offer some kind of motivation in relation to issues surrounding climate change management and
those that do not provide.
HA: There is significant difference in the carbon intensity emissions for the companies that offer
some kind of motivation in relation to issues surrounding climate change management and those
that do not provide. The results are presented in the table below;
Group Statistics
Provision of incentives N Mean Std. Deviation Std. Error Mean
Intensity Yes 81 323.4760 1749.18341 194.35371
No 54 360.2330 1888.52836 256.99616
Independent Samples Test
Levene's Test for
Equality of
Variances
t-test for Equality of Means
F Sig. t df Sig. (2-
tailed)
Mean
Differen
ce
Std.
Error
Differen
ce
95% Confidence
Interval of the
Difference
Lower Upper
Intensity
Equal variances
assumed
.084 .772 -.116 133 .908 -36.76 317 -664 591
Equal variances
not assumed
-.114 107.635 .909 -36.76 322 -675 602
We performed an independent t-test was in order to compare the average carbon intensity
emissions for the companies that offer some kind of motivation in relation to issues surrounding
climate change management and those that do not provide. Results showed that the average
⊘ This is a preview!⊘
Do you want full access?
Subscribe today to unlock all pages.
Trusted by 1+ million students worldwide
carbon intensity emissions for the companies that offer some kind of motivation in relation to
issues surrounding climate change management and those that do not provide (M = 323.48, SD =
1749.18, N = 81) did not significantly different with the average carbon intensity emissions for
the companies that did not offer some kind of motivation in relation to issues surrounding
climate change management (M = 360.23, SD = 1888.53, N = 54), t (133) = -0.116, p > .05, two-
tailed.
Paraphrase This Document
Need a fresh take? Get an instant paraphrase of this document with our AI Paraphraser
References
Ahuja, R.K., 2017. Network flows: theory, algorithms, and applications. Pearson Education
El-Nasr, M.S., Drachen, A. and Canossa, A., 2016. Game analytics. Springer London Limited
Sharp, J.A., Peters, J. and Howard, K., 2017. The management of a student research project.
Routledge
McNabb, D.E., 2015. Research methods in public administration and nonprofit management.
Routledge
1 out of 11
Your All-in-One AI-Powered Toolkit for Academic Success.
+13062052269
info@desklib.com
Available 24*7 on WhatsApp / Email
![[object Object]](/_next/static/media/star-bottom.7253800d.svg)
Unlock your academic potential
Copyright © 2020–2026 A2Z Services. All Rights Reserved. Developed and managed by ZUCOL.