Analysis of Carbon Emissions and Policy Scenarios
Added on 2023-06-14
11 Pages2660 Words240 Views
1. Explore the historical (pre-2010) data with a few simple calculations
1980
1982
1984
1986
1988
1990
1992
1994
1996
1998
2000
2002
2004
2006
2008
2010
0
500
1000
1500
2000
2500
Carbon emmitted
United States European Union Russian Federation
Other "Annex1" Countries* China India
LDCs** Other Non-Annex1
YEar
Carbon emmitted in million tonnes
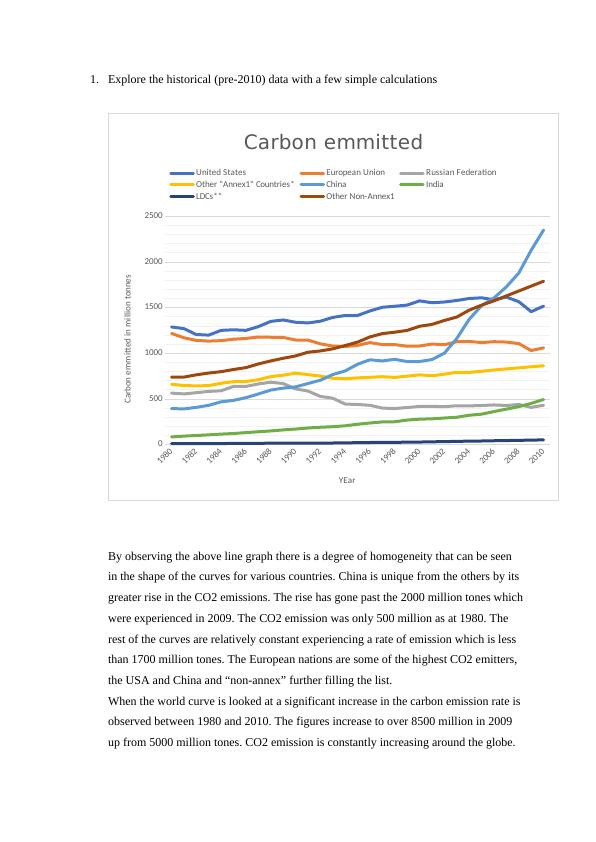
By observing the above line graph there is a degree of homogeneity that can be seen
in the shape of the curves for various countries. China is unique from the others by its
greater rise in the CO2 emissions. The rise has gone past the 2000 million tones which
were experienced in 2009. The CO2 emission was only 500 million as at 1980. The
rest of the curves are relatively constant experiencing a rate of emission which is less
than 1700 million tones. The European nations are some of the highest CO2 emitters,
the USA and China and “non-annex” further filling the list.
When the world curve is looked at a significant increase in the carbon emission rate is
observed between 1980 and 2010. The figures increase to over 8500 million in 2009
up from 5000 million tones. CO2 emission is constantly increasing around the globe.
1980
1982
1984
1986
1988
1990
1992
1994
1996
1998
2000
2002
2004
2006
2008
2010
0
500
1000
1500
2000
2500
Carbon emmitted
United States European Union Russian Federation
Other "Annex1" Countries* China India
LDCs** Other Non-Annex1
YEar
Carbon emmitted in million tonnes
By observing the above line graph there is a degree of homogeneity that can be seen
in the shape of the curves for various countries. China is unique from the others by its
greater rise in the CO2 emissions. The rise has gone past the 2000 million tones which
were experienced in 2009. The CO2 emission was only 500 million as at 1980. The
rest of the curves are relatively constant experiencing a rate of emission which is less
than 1700 million tones. The European nations are some of the highest CO2 emitters,
the USA and China and “non-annex” further filling the list.
When the world curve is looked at a significant increase in the carbon emission rate is
observed between 1980 and 2010. The figures increase to over 8500 million in 2009
up from 5000 million tones. CO2 emission is constantly increasing around the globe.
1980
1982
1984
1986
1988
1990
1992
1994
1996
1998
2000
2002
2004
2006
2008
2010
0
1
2
3
4
5
6
7
8
9
10
Emission per capita in Millions of tons
United States European Union Russian Federation
Other "Annex1" Countries* China India
LDCs** Other Non-Annex1
Year
Emmission/capita
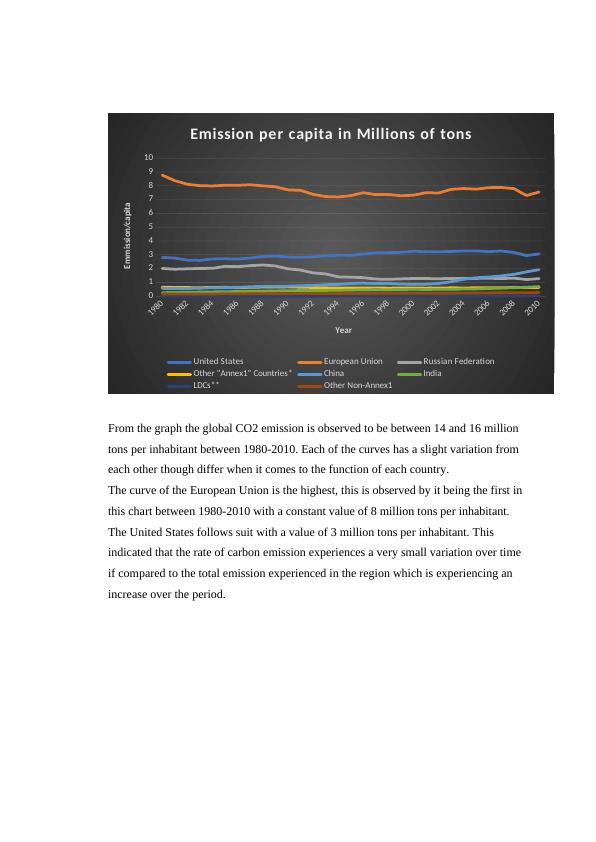
From the graph the global CO2 emission is observed to be between 14 and 16 million
tons per inhabitant between 1980-2010. Each of the curves has a slight variation from
each other though differ when it comes to the function of each country.
The curve of the European Union is the highest, this is observed by it being the first in
this chart between 1980-2010 with a constant value of 8 million tons per inhabitant.
The United States follows suit with a value of 3 million tons per inhabitant. This
indicated that the rate of carbon emission experiences a very small variation over time
if compared to the total emission experienced in the region which is experiencing an
increase over the period.
1982
1984
1986
1988
1990
1992
1994
1996
1998
2000
2002
2004
2006
2008
2010
0
1
2
3
4
5
6
7
8
9
10
Emission per capita in Millions of tons
United States European Union Russian Federation
Other "Annex1" Countries* China India
LDCs** Other Non-Annex1
Year
Emmission/capita
From the graph the global CO2 emission is observed to be between 14 and 16 million
tons per inhabitant between 1980-2010. Each of the curves has a slight variation from
each other though differ when it comes to the function of each country.
The curve of the European Union is the highest, this is observed by it being the first in
this chart between 1980-2010 with a constant value of 8 million tons per inhabitant.
The United States follows suit with a value of 3 million tons per inhabitant. This
indicated that the rate of carbon emission experiences a very small variation over time
if compared to the total emission experienced in the region which is experiencing an
increase over the period.
1989
1990
1991
1992
1993
1994
1995
1996
1997
1998
1999
2000
2001
2002
2003
2004
2005
2006
2007
2008
2009
2010
0
5
10
15
20
25
30
35
40
GDP/capita (Billion constant 2000 US$)
United States European Union Russian Federation
Other "Annex1" Countries* China India
LDCs** Other Non-Annex1
YEar
GDP/capita
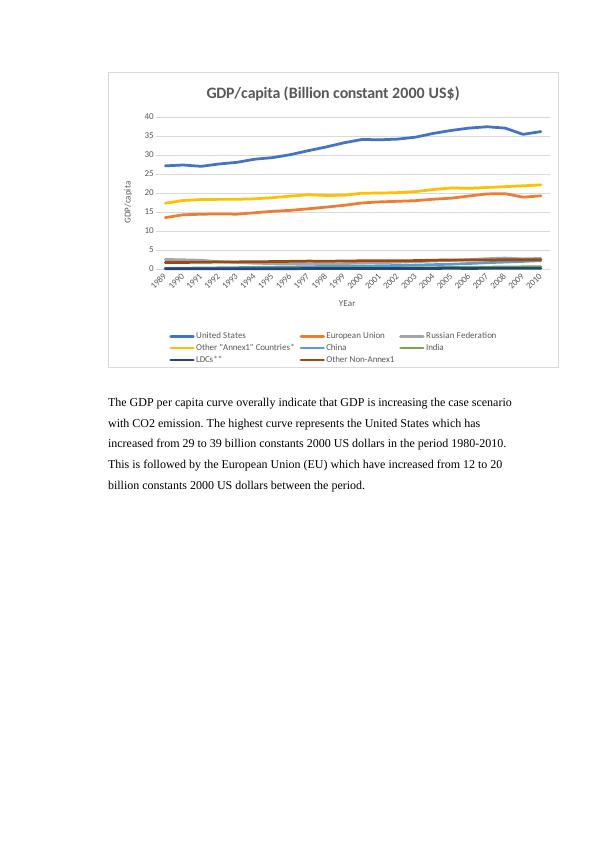
The GDP per capita curve overally indicate that GDP is increasing the case scenario
with CO2 emission. The highest curve represents the United States which has
increased from 29 to 39 billion constants 2000 US dollars in the period 1980-2010.
This is followed by the European Union (EU) which have increased from 12 to 20
billion constants 2000 US dollars between the period.
1990
1991
1992
1993
1994
1995
1996
1997
1998
1999
2000
2001
2002
2003
2004
2005
2006
2007
2008
2009
2010
0
5
10
15
20
25
30
35
40
GDP/capita (Billion constant 2000 US$)
United States European Union Russian Federation
Other "Annex1" Countries* China India
LDCs** Other Non-Annex1
YEar
GDP/capita
The GDP per capita curve overally indicate that GDP is increasing the case scenario
with CO2 emission. The highest curve represents the United States which has
increased from 29 to 39 billion constants 2000 US dollars in the period 1980-2010.
This is followed by the European Union (EU) which have increased from 12 to 20
billion constants 2000 US dollars between the period.
1989
1990
1991
1992
1993
1994
1995
1996
1997
1998
1999
2000
2001
2002
2003
2004
2005
2006
2007
2008
2009
2010
0
0.2
0.4
0.6
0.8
1
1.2
1.4
1.6
1.8
2
Emission Intensity
United States European Union Russian Federation
Other "Annex1" Countries* China India
LDCs** Other Non-Annex1
Year
Intensity of Emmission
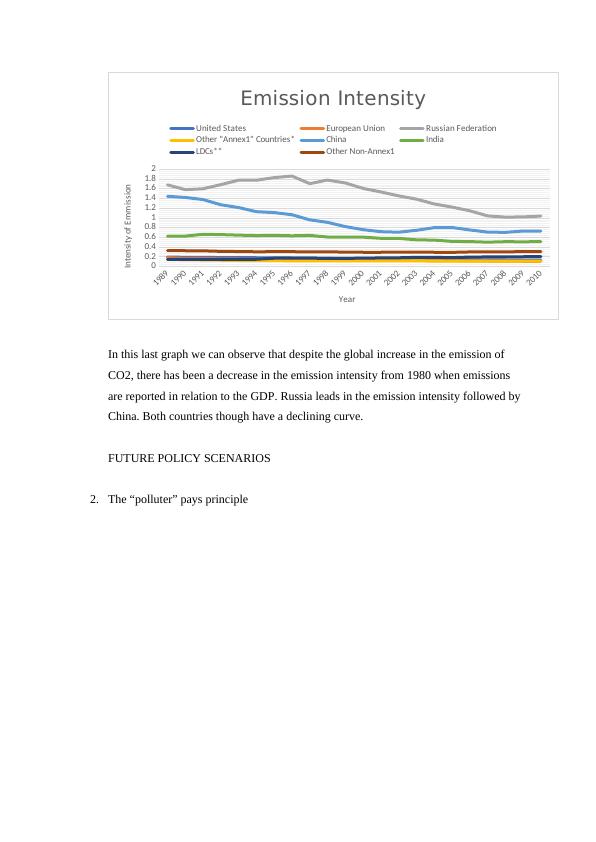
In this last graph we can observe that despite the global increase in the emission of
CO2, there has been a decrease in the emission intensity from 1980 when emissions
are reported in relation to the GDP. Russia leads in the emission intensity followed by
China. Both countries though have a declining curve.
FUTURE POLICY SCENARIOS
2. The “polluter” pays principle
1990
1991
1992
1993
1994
1995
1996
1997
1998
1999
2000
2001
2002
2003
2004
2005
2006
2007
2008
2009
2010
0
0.2
0.4
0.6
0.8
1
1.2
1.4
1.6
1.8
2
Emission Intensity
United States European Union Russian Federation
Other "Annex1" Countries* China India
LDCs** Other Non-Annex1
Year
Intensity of Emmission
In this last graph we can observe that despite the global increase in the emission of
CO2, there has been a decrease in the emission intensity from 1980 when emissions
are reported in relation to the GDP. Russia leads in the emission intensity followed by
China. Both countries though have a declining curve.
FUTURE POLICY SCENARIOS
2. The “polluter” pays principle
End of preview
Want to access all the pages? Upload your documents or become a member.
Related Documents
An Analysis of South Africa Economylg...
|10
|1883
|165
Economics of Israel: GDP, Per Capita GDP, GDP Growth, Inflation, Unemployment Ratelg...
|13
|793
|261
Macroeconomics: Current Events, GDP, Labor Market and Price Movementslg...
|8
|1018
|94