Cartography 1. CARTOGRAPHY By Name. Course Instructor I
VerifiedAdded on 2023/04/04
|4
|340
|345
AI Summary
The assignment brief is attached. Basically i need a good quality map and a design rationale as well :)
Contribute Materials
Your contribution can guide someone’s learning journey. Share your
documents today.

Cartography 1
CARTOGRAPHY
By Name
Course
Instructor
Institution
Location
Date
CARTOGRAPHY
By Name
Course
Instructor
Institution
Location
Date
Secure Best Marks with AI Grader
Need help grading? Try our AI Grader for instant feedback on your assignments.

Cartography 2
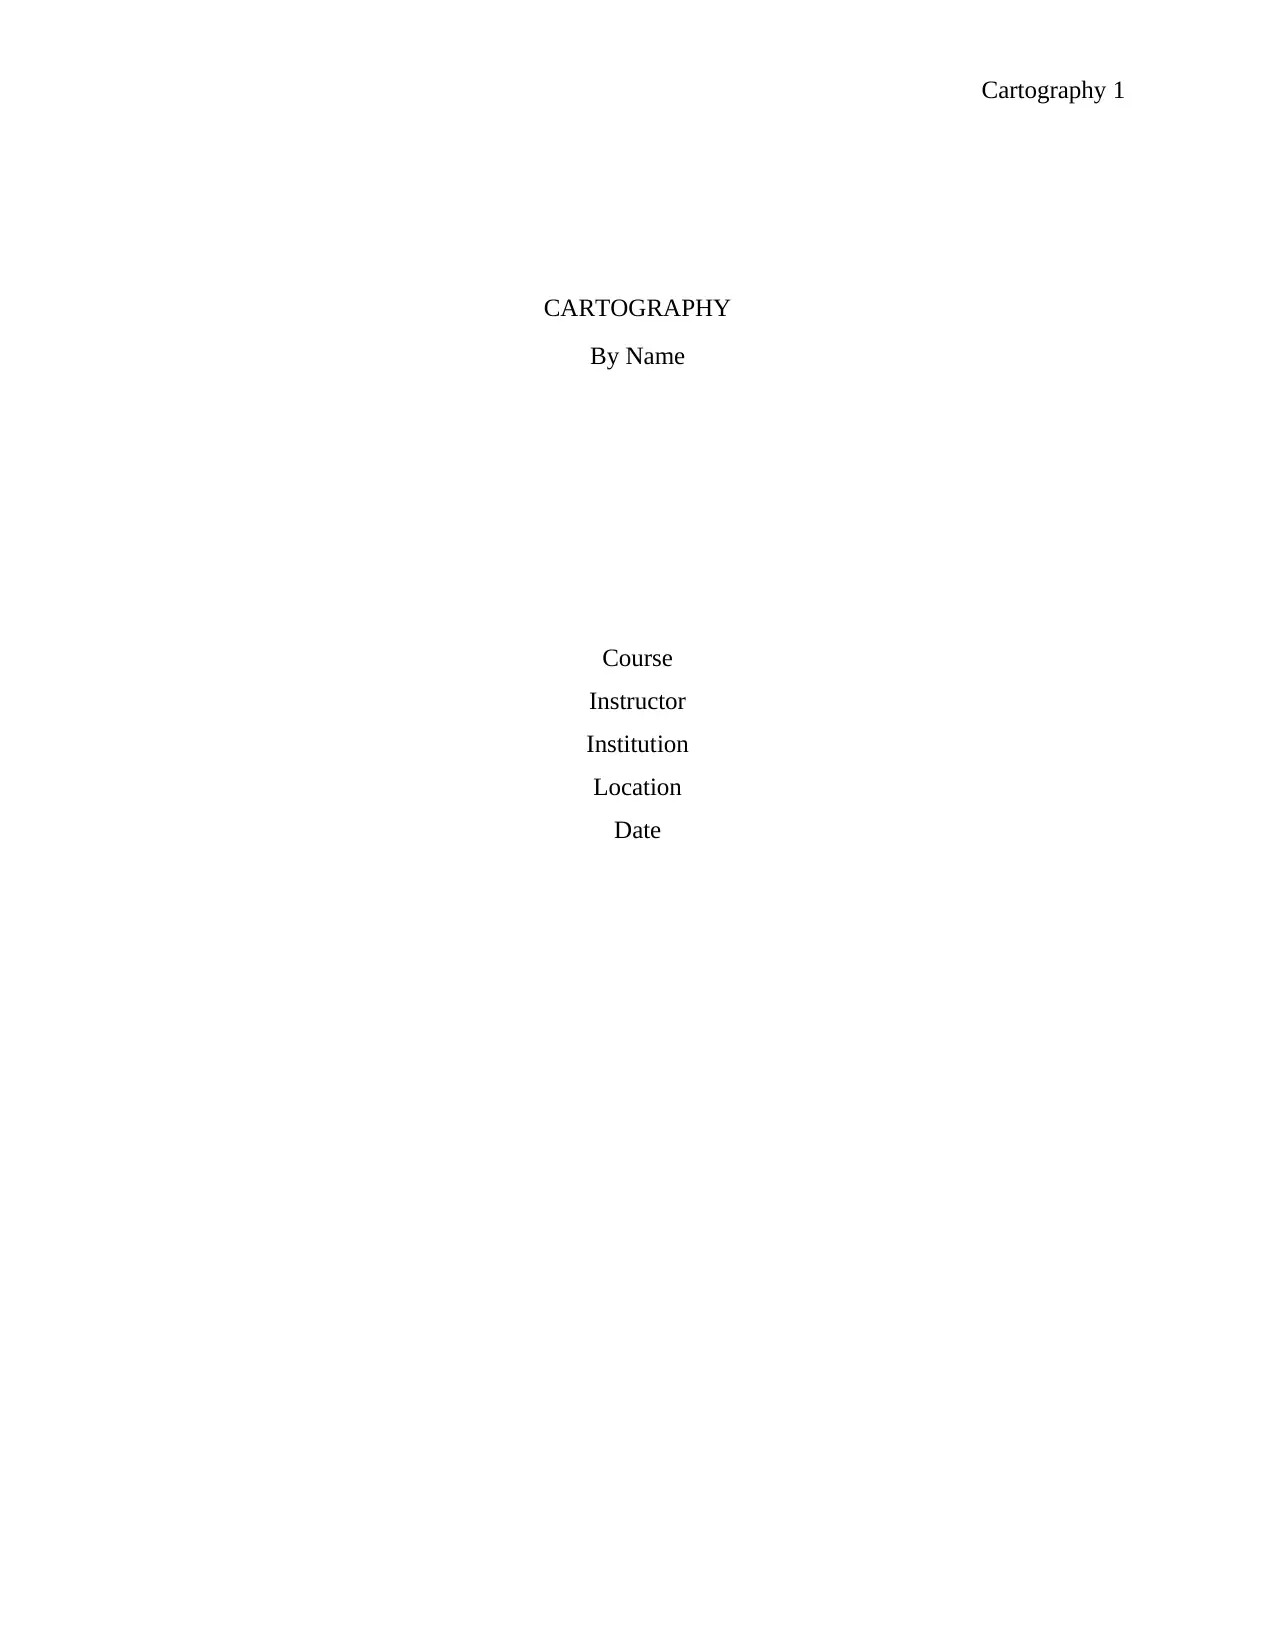
This map is taken in a region between Nikenbah and the Coral Sea in Queensland
Australia. The map basically shows the geographical feature, therefore, the title of this map is the
National Geographic, thus this map´s intended users are the explorers as well as the tourists who
want to explore the region. The description of these maps as which this map supports are
discussed below; the red lines with arrows illustrates the rivers in the maps with their respective
direction. All the rivers as seen in the diagram flows from highlands in the region to the lowland
area into the Coral Sea. Example of these rivers includes Mary River and Burnetti River. The
yellow line illustrates the distance between two airports in the regions (from Maryborough
Airport to Hervey Bay airport).
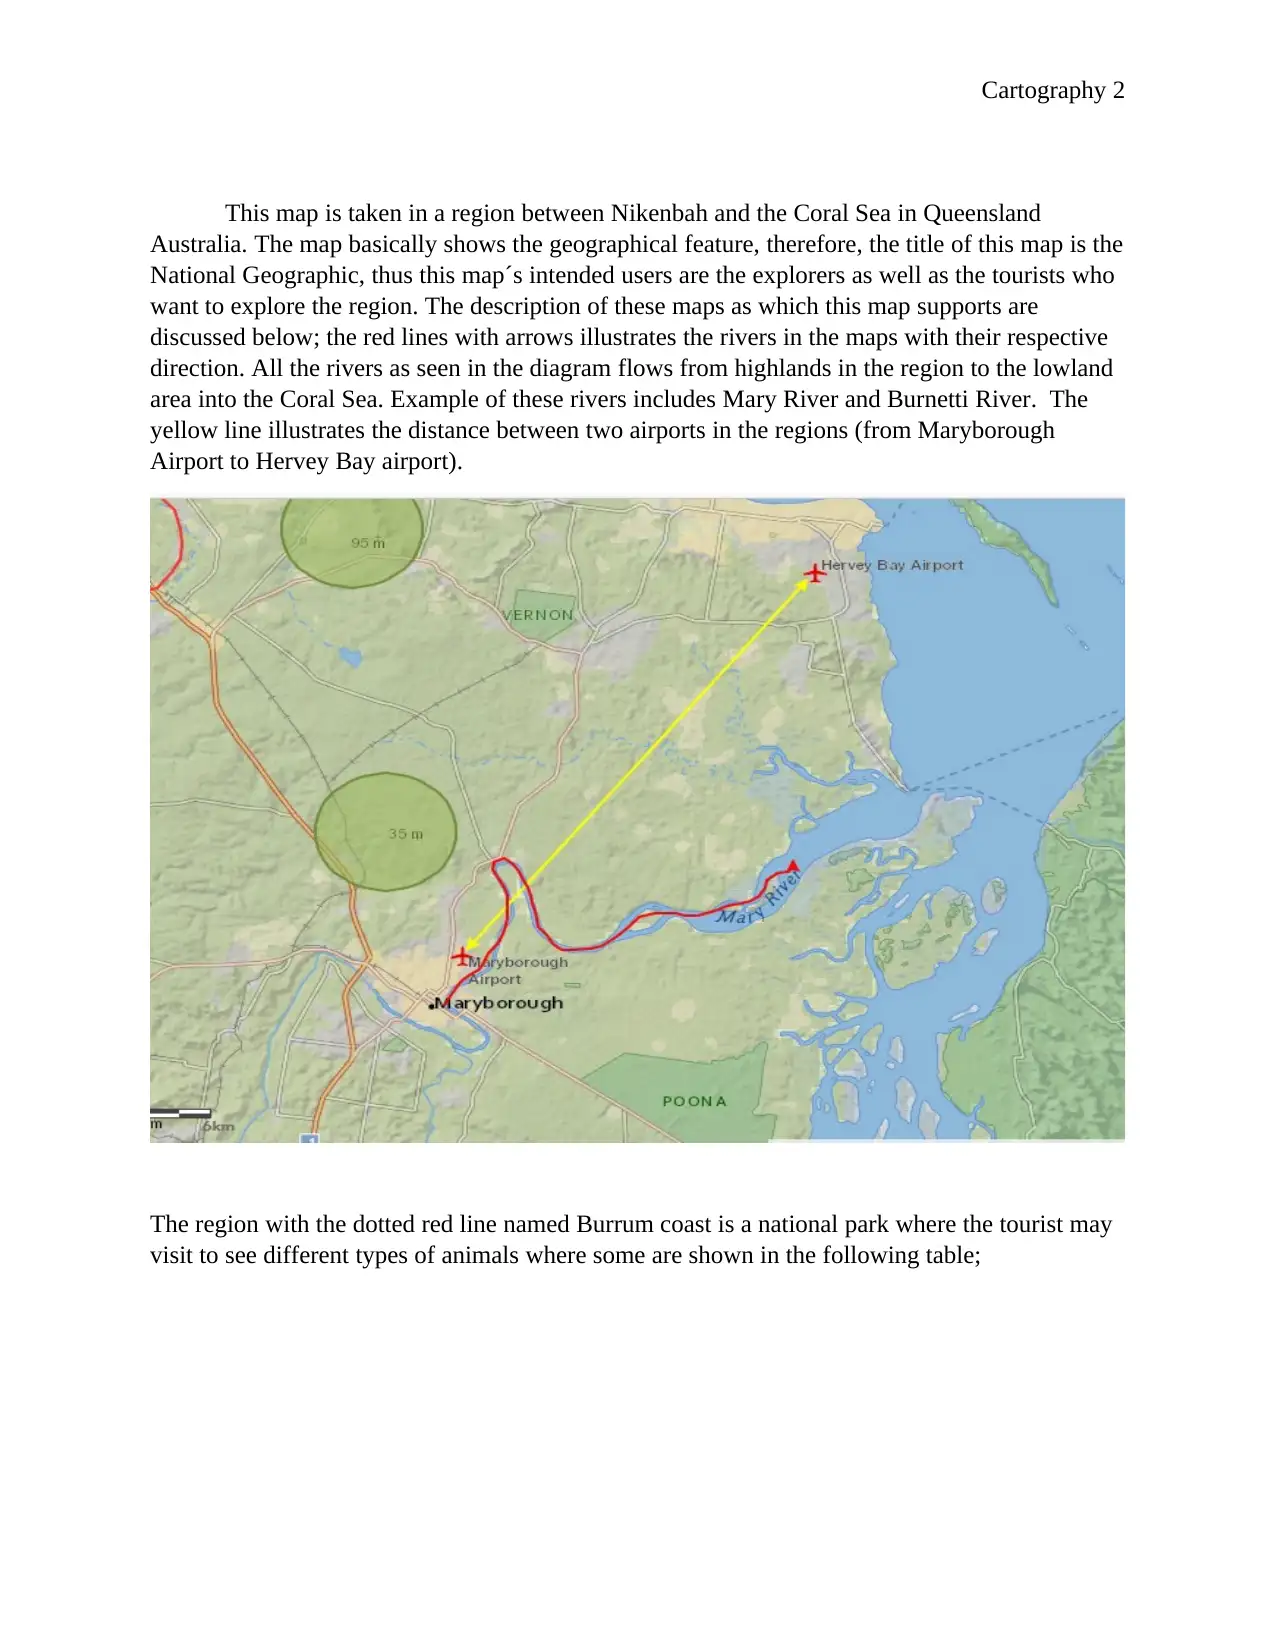
The region with the dotted red line named Burrum coast is a national park where the tourist may
visit to see different types of animals where some are shown in the following table;

Cartography 3
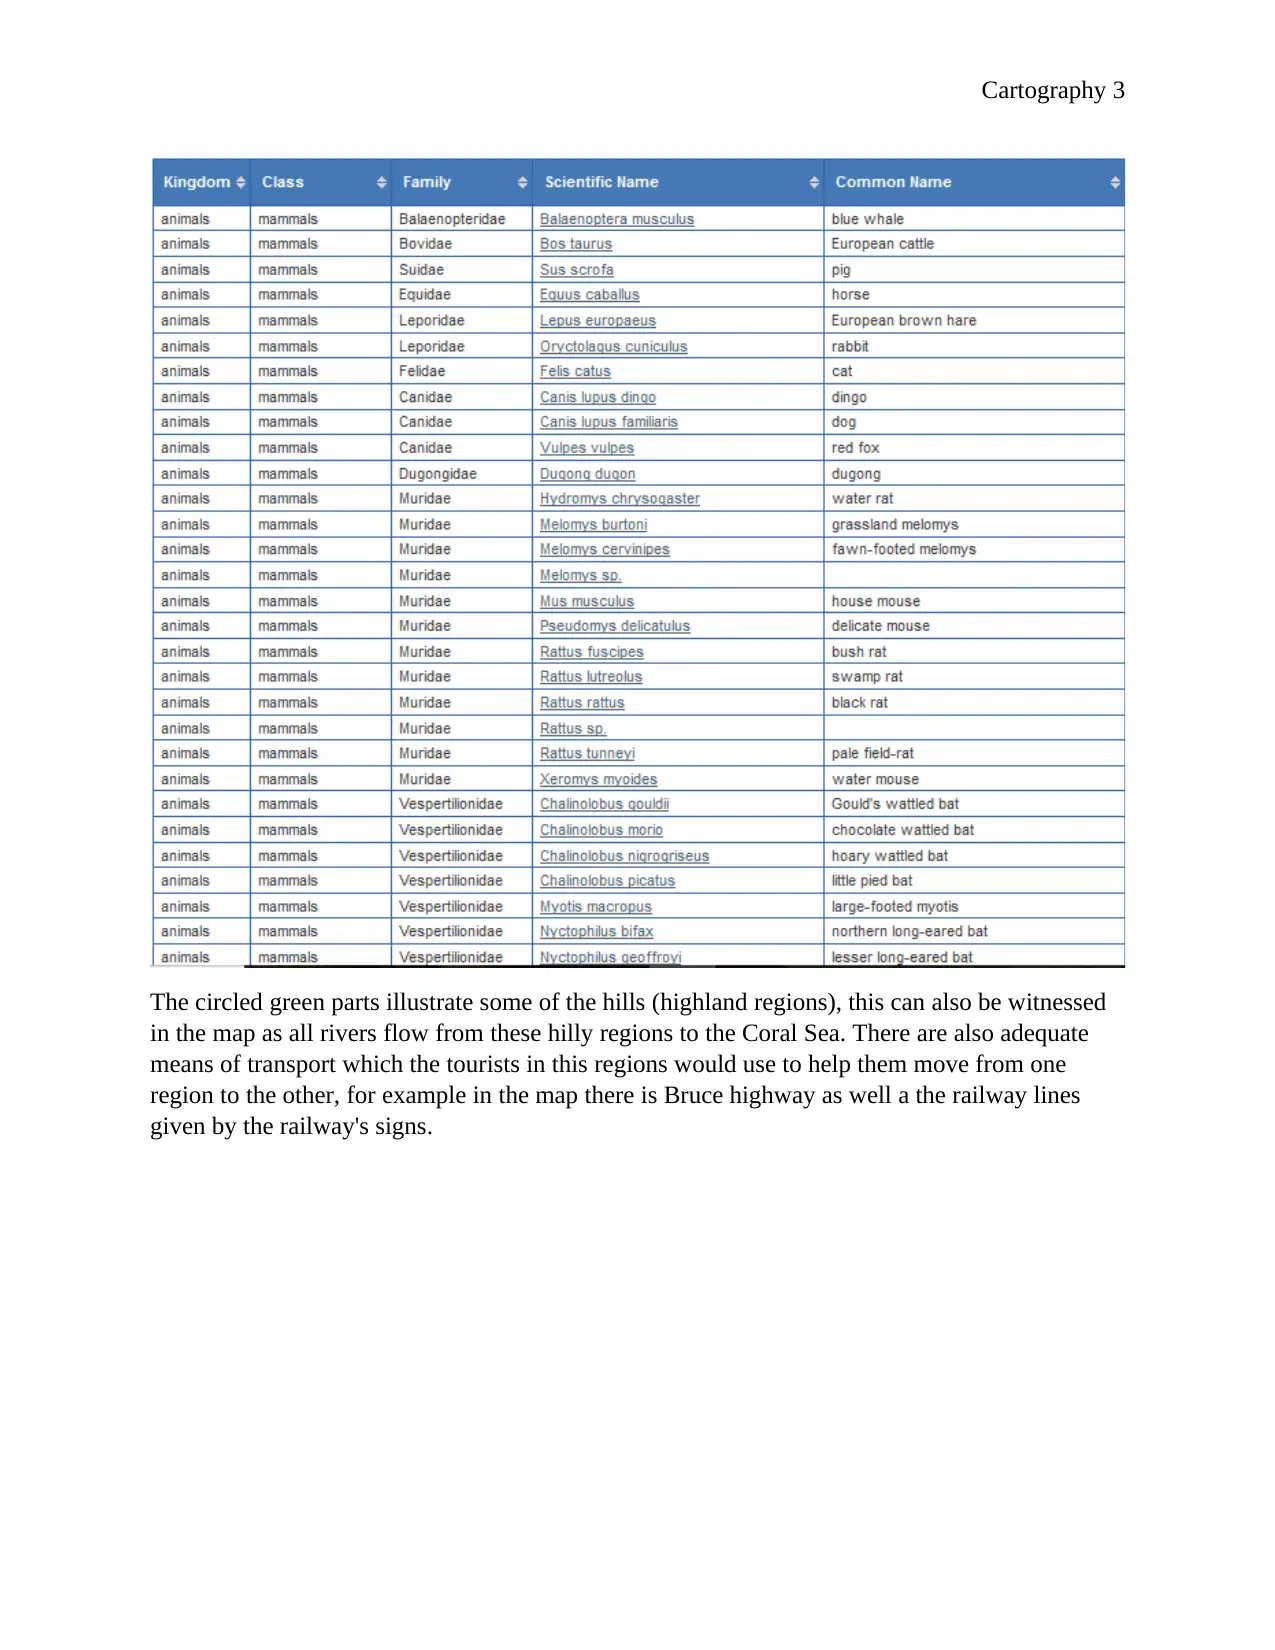
The circled green parts illustrate some of the hills (highland regions), this can also be witnessed
in the map as all rivers flow from these hilly regions to the Coral Sea. There are also adequate
means of transport which the tourists in this regions would use to help them move from one
region to the other, for example in the map there is Bruce highway as well a the railway lines
given by the railway's signs.

Cartography 4
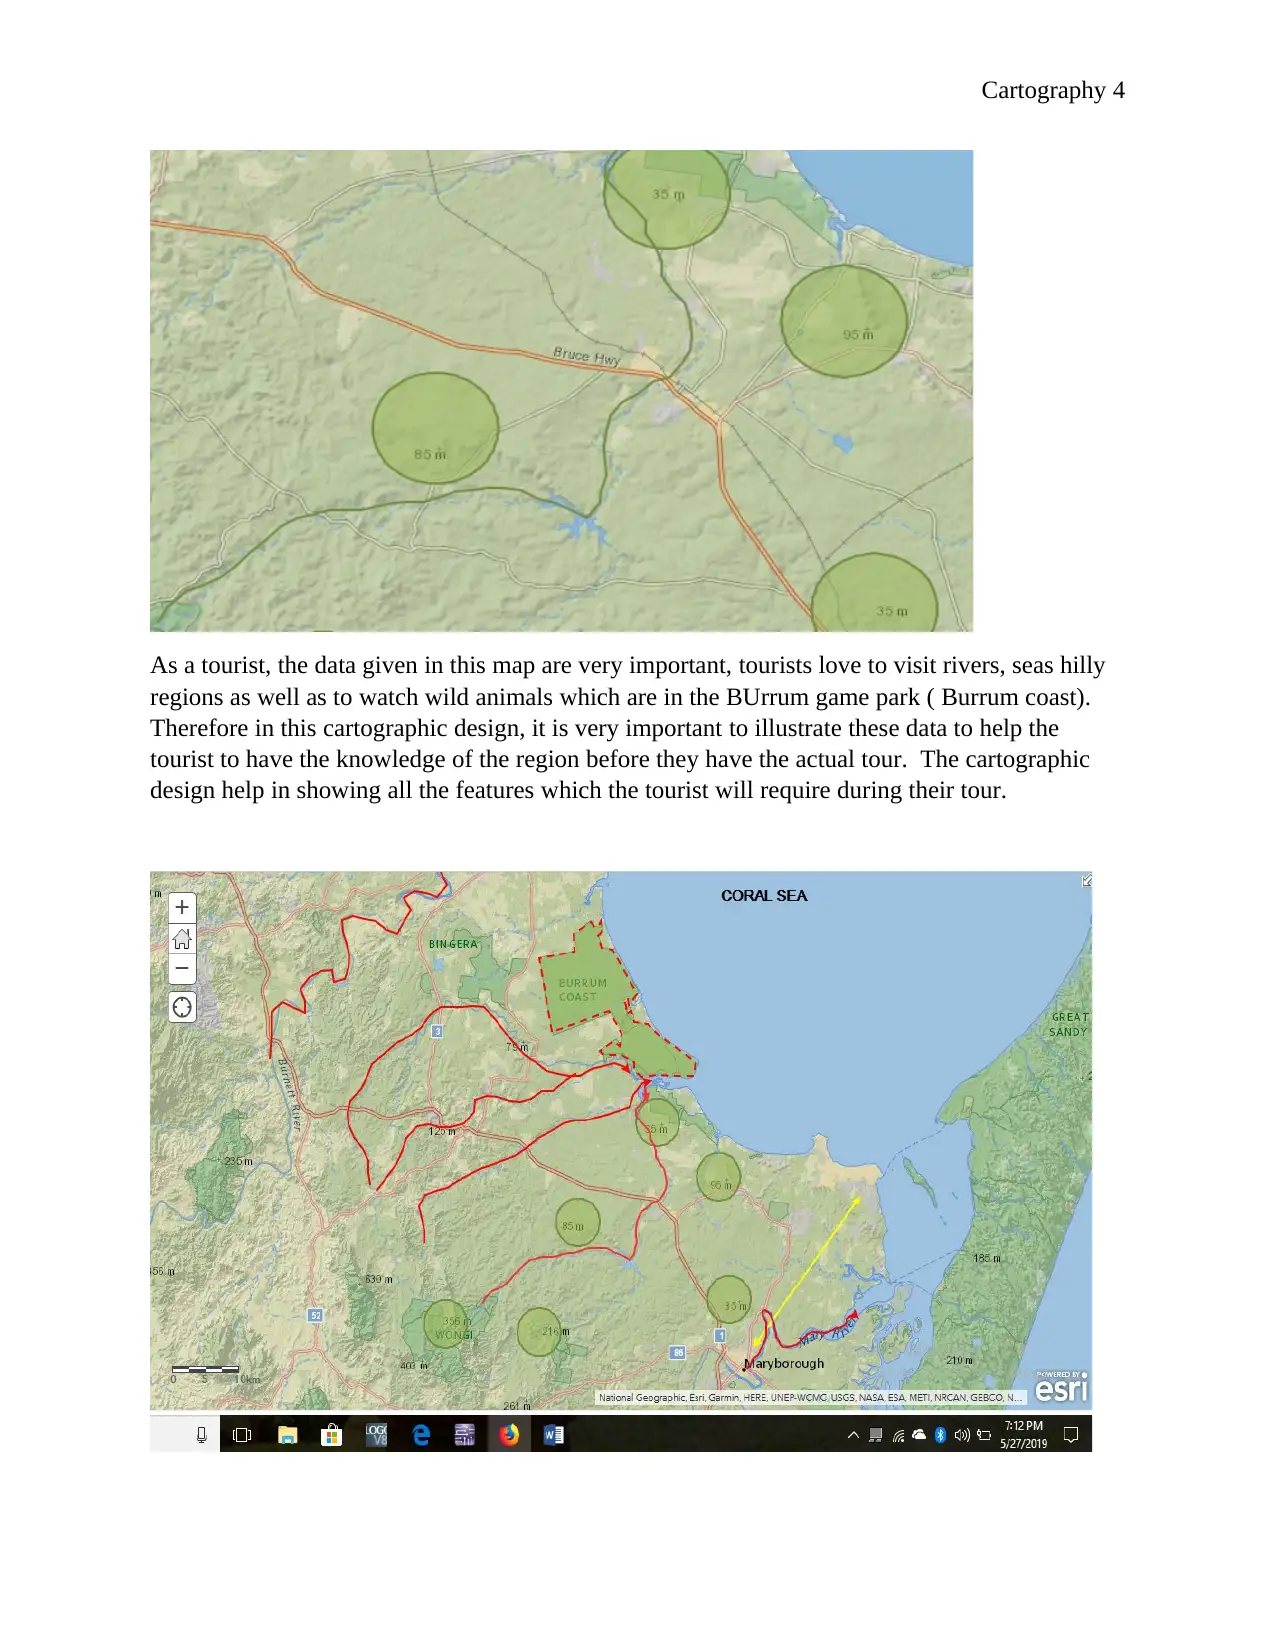
As a tourist, the data given in this map are very important, tourists love to visit rivers, seas hilly
regions as well as to watch wild animals which are in the BUrrum game park ( Burrum coast).
Therefore in this cartographic design, it is very important to illustrate these data to help the
tourist to have the knowledge of the region before they have the actual tour. The cartographic
design help in showing all the features which the tourist will require during their tour.
1 out of 4
Your All-in-One AI-Powered Toolkit for Academic Success.
+13062052269
info@desklib.com
Available 24*7 on WhatsApp / Email
![[object Object]](/_next/static/media/star-bottom.7253800d.svg)
Unlock your academic potential
© 2024 | Zucol Services PVT LTD | All rights reserved.