Case Of Qantas Firm - Analysis Of Financial Ratios
Added on 2020-02-05
15 Pages1613 Words30 Views
ACCOUNTING
EXECUTIVE SUMMARY
The study is about the Qantas Airways Limited which operating in the transportation and
logistics industry and having third position in the world on the basis of largeness. Main activities
of the company is to provide effectual and higher quality of the transportation services through
flights in the world. In the current case, performance of the Qantas firm is to be analysed by
considering the financial ratios on the basis of annual report. It can be said that, the company
performs well in the industry for generating net profit but unable to enhance liquidity position.
For this it needs to take the corrective actions and make strategies for control cost and increase
the number of consumers.
INTRODUCTION
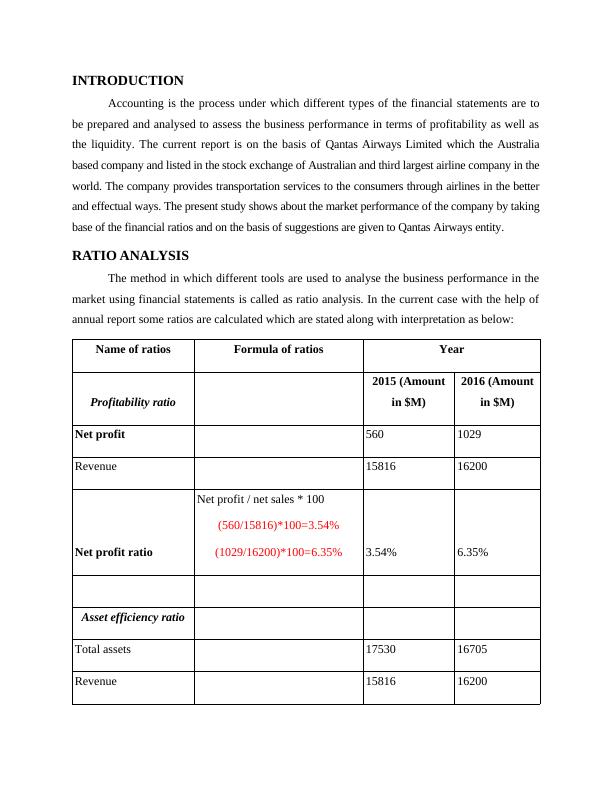
Accounting is the process under which different types of the financial statements are to
be prepared and analysed to assess the business performance in terms of profitability as well as
the liquidity. The current report is on the basis of Qantas Airways Limited which the Australia
based company and listed in the stock exchange of Australian and third largest airline company in the
world. The company provides transportation services to the consumers through airlines in the better
and effectual ways. The present study shows about the market performance of the company by taking
base of the financial ratios and on the basis of suggestions are given to Qantas Airways entity.
RATIO ANALYSIS
The method in which different tools are used to analyse the business performance in the
market using financial statements is called as ratio analysis. In the current case with the help of
annual report some ratios are calculated which are stated along with interpretation as below:
Name of ratios Formula of ratios Year
Profitability ratio
2015 (Amount
in $M)
2016 (Amount
in $M)
Net profit 560 1029
Revenue 15816 16200
Net profit ratio
Net profit / net sales * 100
(560/15816)*100=3.54%
(1029/16200)*100=6.35% 3.54% 6.35%
Asset efficiency ratio
Total assets 17530 16705
Revenue 15816 16200
End of preview
Want to access all the pages? Upload your documents or become a member.