Project: Wind Speed Data Analysis and Forecasting Model for New Jersey
VerifiedAdded on 2021/02/22
|10
|1523
|322
Project
AI Summary
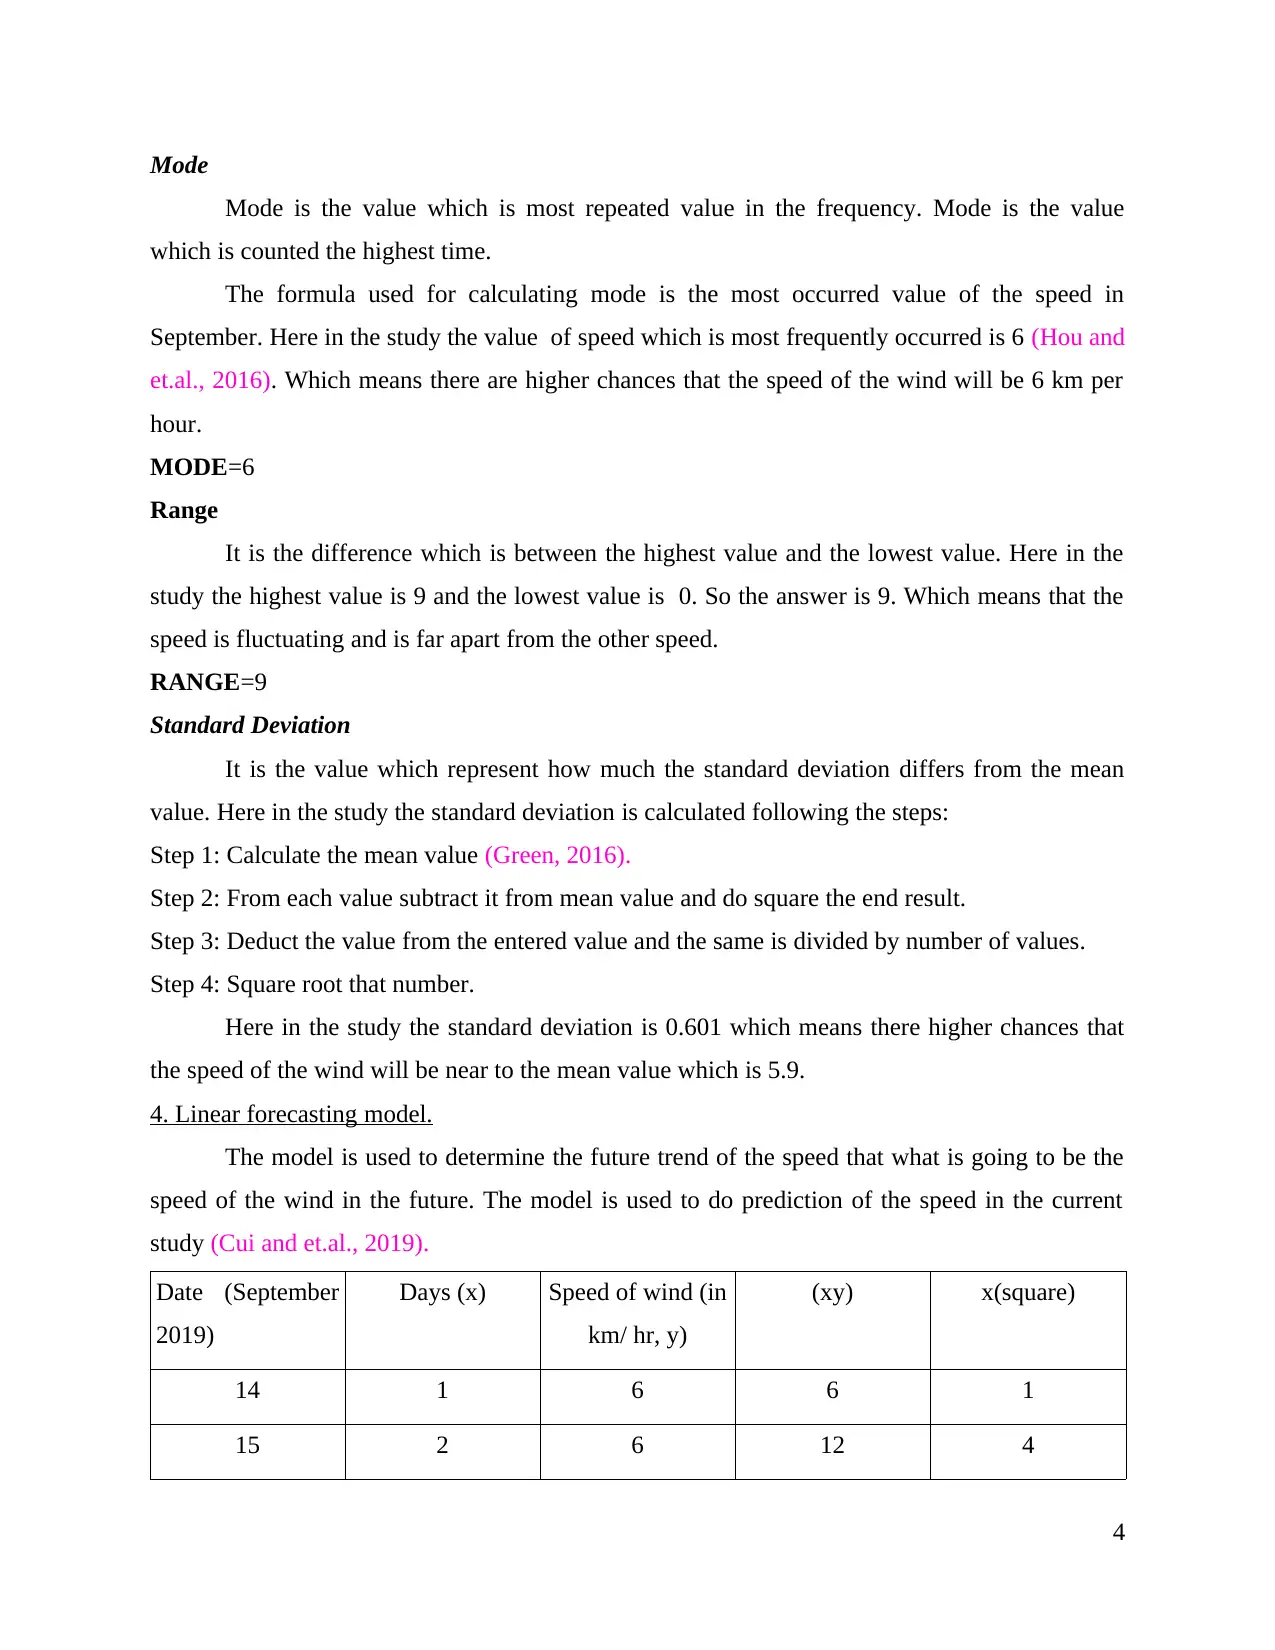
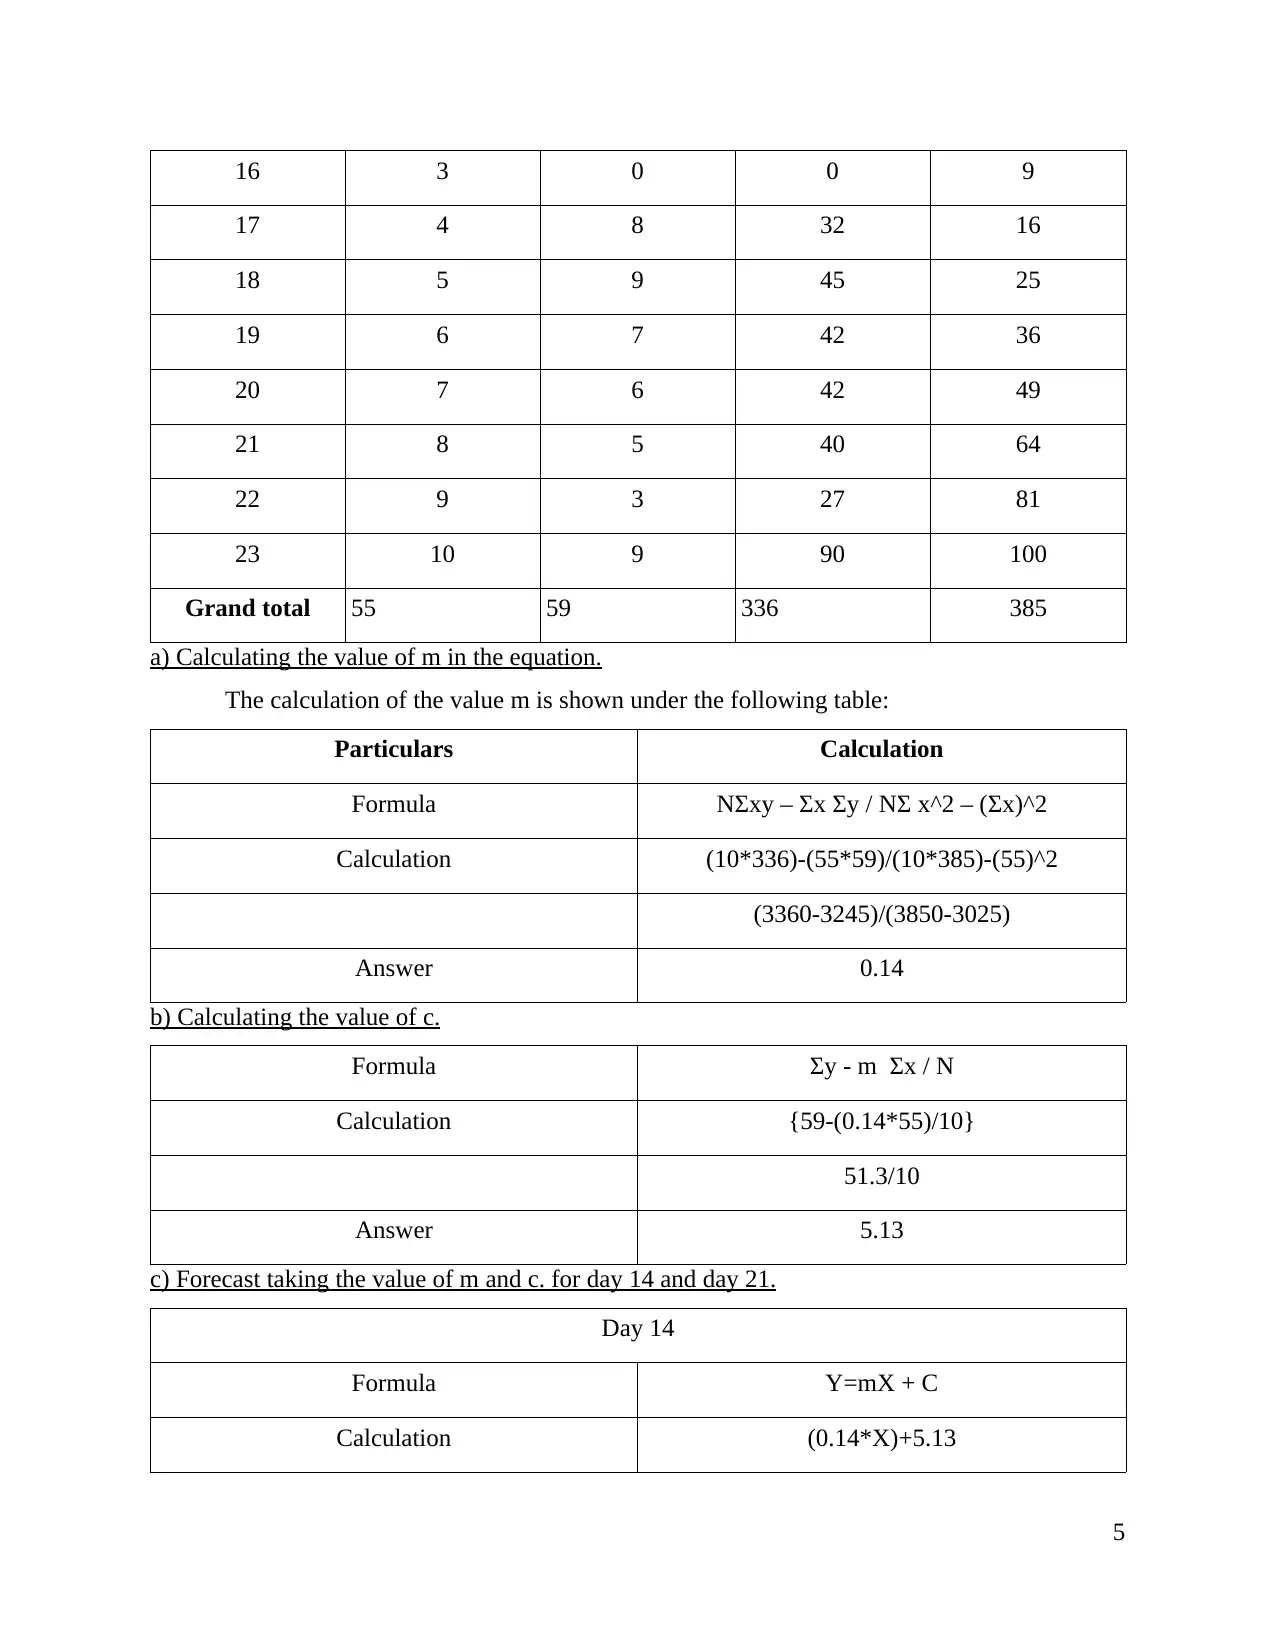
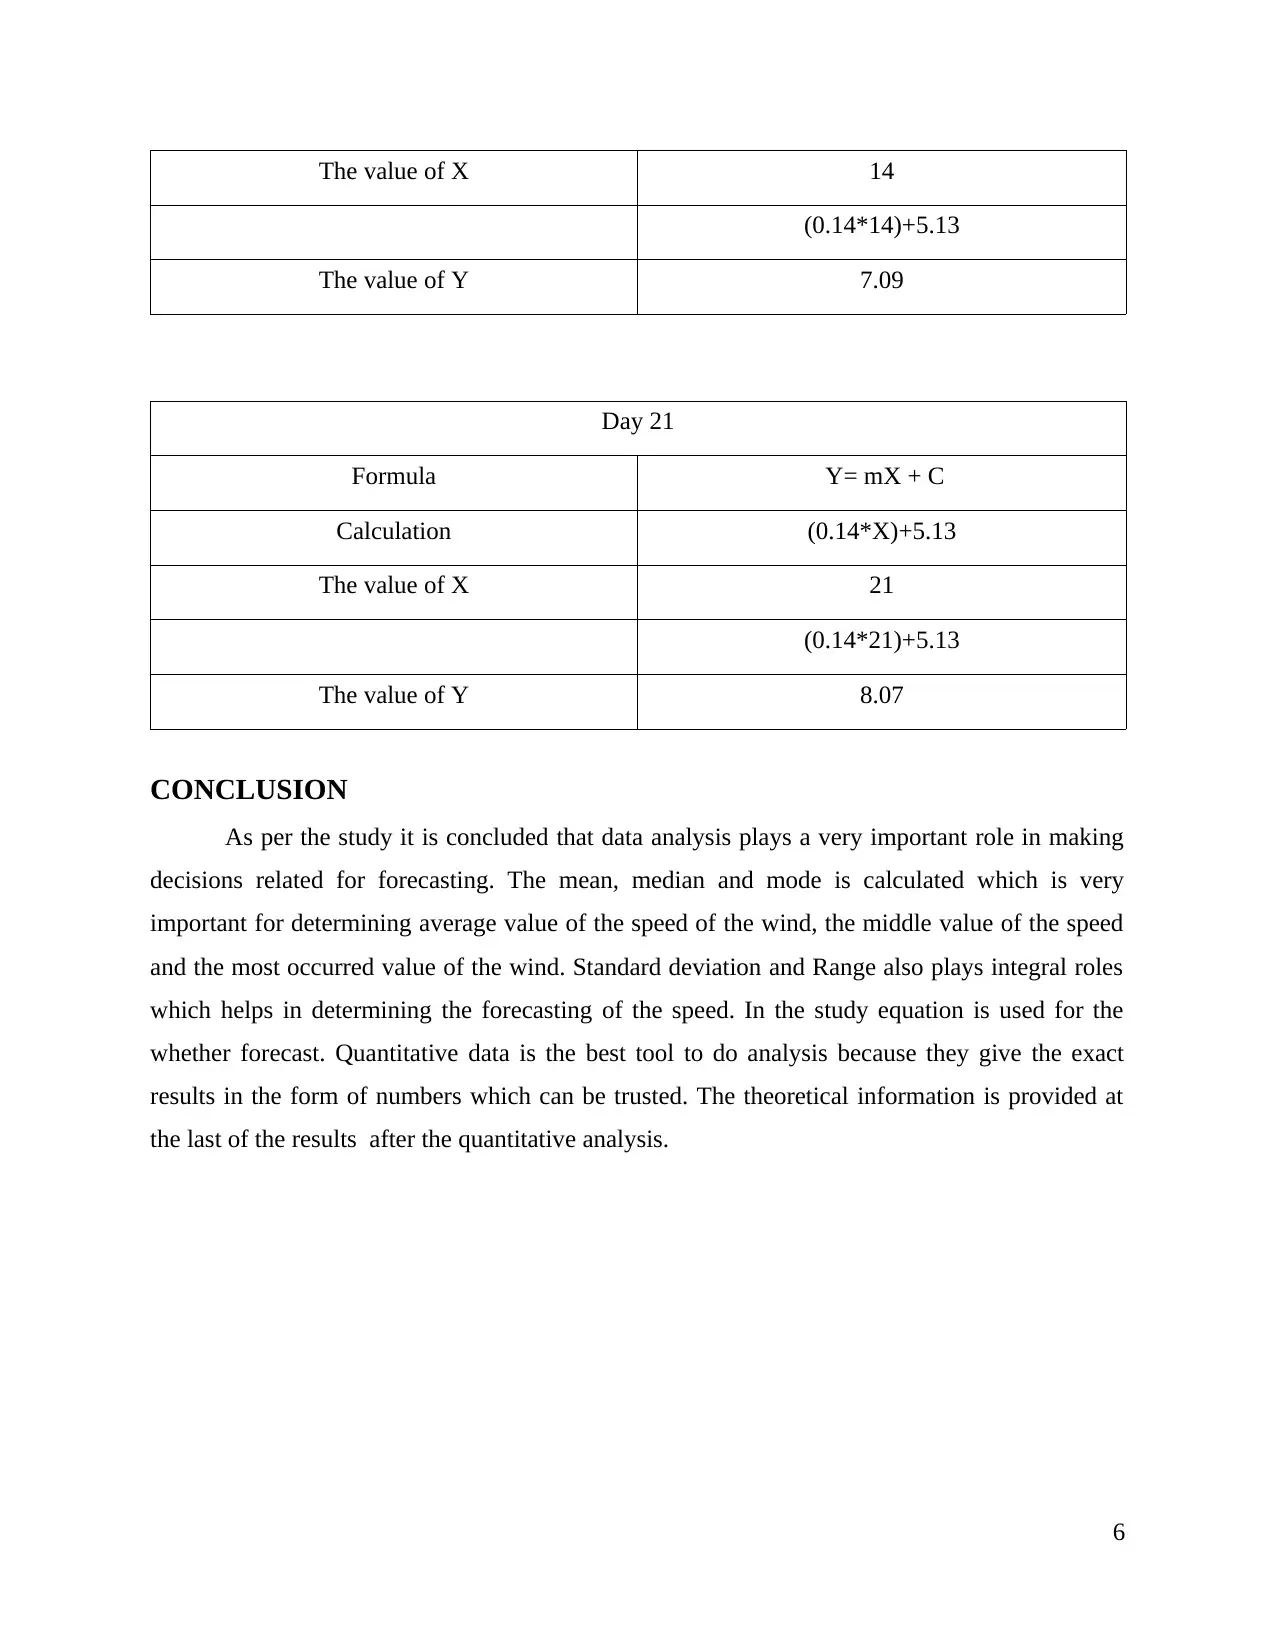
This project analyzes wind speed data collected over a 10-day period in New Jersey, focusing on data analysis and forecasting. The project begins with a table formatting the wind speed data and then uses histogram and line charts for visual representation. Descriptive statistics, including mean, median, mode, range, and standard deviation, are calculated to understand the central tendencies and variability of the wind speeds. A linear forecasting model (Y = mX + C) is employed to predict wind speeds for days 14 and 21, with detailed calculations for the values of 'm' and 'c'. The conclusion highlights the importance of data analysis in forecasting and decision-making, emphasizing the use of quantitative data for accurate results. The report also references relevant literature on wind speed analysis and forecasting, which are used to support the analysis and methodology used in the project.


1 out of 10
Related Documents


Your All-in-One AI-Powered Toolkit for Academic Success.
+13062052269
info@desklib.com
Available 24*7 on WhatsApp / Email
![[object Object]](/_next/static/media/star-bottom.7253800d.svg)
Copyright © 2020–2026 A2Z Services. All Rights Reserved. Developed and managed by ZUCOL.