Associated British Foods: Financial Analysis and Acquisition
VerifiedAdded on 2021/02/19
|15
|4613
|105
Case Study
AI Summary
This case study delves into the financial performance of Associated British Foods (ABF), a multinational food processing retailer. The analysis begins with an overview of the company's background and then proceeds to evaluate its financial standing through ratio analysis, including profitability, liquidity, solvency, and efficiency ratios, comparing ABF's performance with its competitor, Nestle. The study further explores investment appraisal and the potential acquisition of Nisa Retail Limited, examining the rationale behind the acquisition, potential synergistic gains, financing aspects, risk assessment, and potential implications. The conclusion summarizes the key findings, highlighting ABF's financial health and strategic decisions. The analysis of ABF's financial ratios reveals strengths and weaknesses, particularly in comparison to Nestle, and provides insights into ABF's strategic decisions regarding investments and potential acquisitions.

CASE STUDY
Paraphrase This Document
Need a fresh take? Get an instant paraphrase of this document with our AI Paraphraser

TABLE OF CONTENTS
INTRODUCTION...........................................................................................................................1
Background of the company........................................................................................................1
2. Evaluation of Financial analysis.................................................................................................1
a. Ratio analysis...........................................................................................................................1
b. Analysing the limitations and the problems associated to financial ratios..............................6
3. Investment appraisal ...................................................................................................................6
4. Potential acquisition of Nisa Retail Limited................................................................................9
Rationale in selecting the Target company .................................................................................9
Synergistic gain from the acquisition .......................................................................................10
Explaining and evaluating the financing within the acquisition................................................10
Assessing the risk and the uncertainties.....................................................................................10
Potential implications.................................................................................................................10
CONCLUSION..............................................................................................................................11
REFERENCES..............................................................................................................................12

INTRODUCTION
Associated British Foods has attained the financial success over the previous five years
and now is seeking to expand and acquiring the other company in order achieve its long term
objectives with leading growth. The present report summarises the financial performance of
Associated British Foods and the further analysis has been made in relation to the investment and
the evaluation regarding the acquisition of the Nisa.
Background of the company
It is the multinational British food processing retailer headquartered in London. It deals in
the ingredients division and is called as the second leading producer of the baker's yeast and the
sugar and also produces the ingredients such as enzymes, lactose and the emulsifiers.
2. Evaluation of Financial analysis
a. Ratio analysis
Profitability ratio analysis
NP ratio- It refers to the profitability ratio that reveals the income earned by the
enterprise after making payment of all the costs and the expenses (Fallahpour, Lakvan and
Zadeh, 2017). It is been computed dividing the net profit with that of the net sales. Higher the
ratio, depicts the better position of the company.
Year / companies Nestle Associated British foods
2014 15.74% 5.89%
2015 10.18% 4.16%
2016 9.50% 6.10%
2017 7.97% 7.80%
2018 11.05% 6.47%
Interpretation- From the above table it has been interpreted that Net profit ratio of Nestle
is greater than Associated British foods in all the years. This means that Nestle, a competitor of
Associated British foods earns higher profits even after paying off all its expenses in relation to
interest, taxes and other costs. This in turn depicts that the performance of Nestle is much better
than the Associated British foods.
Liquidity ratio analysis
1
⊘ This is a preview!⊘
Do you want full access?
Subscribe today to unlock all pages.
Trusted by 1+ million students worldwide

Current ratio- It means the liquidity ratio that reflects the ability of the organization in
meeting it current obligations. It indicates the ways in which an entity can make effective use of
its short term assets in order to meet their current liabilities (Liu and et.al., 2019). It is calculated
by dividing the current assets with that of the current liabilities. The greater the ratio, better is the
liquidity position of the firm.
Year / companies Nestle Associated British foods
2014 1.03 1.35
2015 0.88 1.4
2016 0.85 1.41
2017 0.89 1.65
2018 0.95 1.63
Interpretation- The above table highlights that current ratio of Associated British foods is
greater than its rivalry that is Nestle. It means that the liquidity position of Associated British
foods is sound or good in comparison to other company as its ratio is close to an ideal current
ratio that is 2:1. Associated British foods has sufficient cash to meet its short term liabilities and
are making an effective use of their current assets through proper management of working
capital.
Solvency/financial gearing ratio analysis
Debt-equity ratio- It is the measure that describes the relationship in between the long
term debts and the shareholders funds within the organization (Gabric, 2018). In other words, it
states about the capital invested by the shareholders and the creditors. It shows the extent
towards which owners funds could meet the long term obligations of the company to its
creditors.
Year / companies Nestle Associated British Foods
2014 0.18 0.09
2015 0.19 0.09
2016 0.17 0.09
2017 0.26 0.07
2018 0.45 0.03
Interpretation- From the above evaluation it has could be stated that financial health of
Associated British foods is better than Nestle. This is because the debt-to -equity ratio of
Associated British foods is lower than the ratio of Nestle and the lower the gearing ratio, better
2
Paraphrase This Document
Need a fresh take? Get an instant paraphrase of this document with our AI Paraphraser

the financial state or solvency of an enterprise. Over the last five years, the solvency ratio of
Associated British foods is low and this results in better position of an entity in the overall
market.
Efficiency ratio analysis
Fixed assets turnover ratio- It is the most important efficiency ratio that is been used for
measuring return gained by the company on its fixed assets like plant, machinery and equipment
(Linares-Mustaros, Coenders and Vives-Mestres, 2018). It helps in determining the
effectiveness of the enterprise in making use of their fixed assets in order to generate higher
sales.
Year / companies Nestle Associated British foods
2014 3.32 2.81
2015 3.24 2.8
2016 3.32 2.79
2017 3.26 2.91
2018 3.18 2.8
Interpretation- By summing up the above table it has been concluded that fixed asset
turnover ratio of Nestle is better than Associated British foods which clearly means that the
company is utilizing its fixed asset in an efficient way in order to attain larger sales. However,
this ratio of Associated British foods is lower than its rivalry so it has adopt necessary measures
for making effective use of its non-current assets.
Working note:-
Ratio analysis of Nestle
Particulars
Formul
a
Profitability
ratio analysis
2014 2015 2016 2017 2018
Net profit 14456 9066 8531 7183 10135
Net sales 91865 89083 89786 90121 91750
NP ratio Net
profit /
15.74% 10.18% 9.50% 7.97% 11.05%
3

sales *
100
Liquidity ratio
analysis
2014 2015 2016 2017 2018
Current assets 33961 29434 32042 32190 41003
Current
liabilities 32895 33321 37517 36054 43030
Current ratio
Curren
t
assets /
current
liabiliti
es 1.03 0.88 0.85 0.89 0.95
Solvency ratio
analysis
2014 2015 2016 2017 2018
Long-term debt 12396 11601 11091 15932 25700
Shareholder's
equity 70130 62338 64590 61504 57363
Debt-equity
ratio
Long-
term
debt /
shareho
lders’
equity 0.18 0.19 0.17 0.26 0.45
Efficiency
ratio analysis
2014 2015 2016 2017 2018
Turnover or
sales revenue 91865 89083 89786 90121 91750
Average fixed
assets 30425 16259 13436 13383 14511
Fixed assets
turnover ratio
Net
sales/A
verage
fixed
assets 3.32 3.24 3.32 3.26 3.18
4
⊘ This is a preview!⊘
Do you want full access?
Subscribe today to unlock all pages.
Trusted by 1+ million students worldwide

Ratio analysis of Associated British foods
Particular
s Formula
Profitabili
ty ratio
analysis
2014 2015 2016 2017 2018
Net profit 762 532 818 1198 1007
Sales
revenue 12943 12800 13399 15357 15574
NP ratio
Net profit / sales
* 100 5.89 4.16 6.1 7.8 6.47
Liquidity
ratio
analysis
2014 2015 2016 2017 2018
Current
assets 3626 3849 4437 5190 5285
Current
liabilities 2684 2742 3145 3153 3284
Current
ratio
Current assets /
current
liabilities 1.35 1.4 1.41 1.65 1.63
Solvency
ratio
analysis
2014 2015 2016 2017 2018
Long-term
debt 595 565 627 599 346
Shareholde
r's equity 6437 6336 7054 8339 9211
Debt-
equity
ratio
Long-term
debt /
shareholders’
equity 0.09 0.09 0.09 0.07 0.03
Efficiency
ratio
analysis
2014 2015 2016 2017 2018
Turnover 12943 12800 13399 15357 15574
5
Paraphrase This Document
Need a fresh take? Get an instant paraphrase of this document with our AI Paraphraser

or sales
revenue
Average
fixed assets 6846 36345 2954 3129 3417
Fixed
assets
turnover
ratio 2.81 2.8 2.79 2.91 2.8
b. Analysing the limitations and the problems associated to financial ratios
In accordance with the Rupert and Essila, (2019) it has been stated that financial ratios
are evaluated on the basis of the accounting figures that are present in the financial reports .
Therefore, as accounting figures are based on the approximations, manipulation and the
deficiencies which in turn results in the drawing incorrect conclusions regarding the results of the
performance and the position. On the other hand it is been viewed by the Warren and Seal,
(2018) that ratios comprises of the problem in terms of comparability as the other similar
companies employs the several accounting methods that poses the problem in making the
comparison in between the key relationship. For instance, stock turnover could be different for
different companies at the time when one enterprise is using the FIFO method and the other
similar organization is using the LIFO method for making the valuation of its inventory. Thus,
the differences occurs in relation to the depreciation, amortisation and estimations could lead to
create problem in respect of comparability within the companies in same kind of the industry.
Chalamandaris and Vlachogiannakis, (2018) also highlighted that inflation might limit utility of
the financial ratios as because of the inflation, the financial reports that are based on historical
figures the does not reflect the current or true value of the figures. It has also been determined
that accounting ratios entirely depends upon the economic conditions, firm's position and the
situation of the industry as these are the major components that creates dissimilarity in between
different firms.
3. Investment appraisal
It refers to the collection of the different tools that are been used for determining the
attractiveness of the specific investment. The main purpose of using the investment appraisal
technique is to analyse project viability, making portfolio decisions and valuing the programme.
6
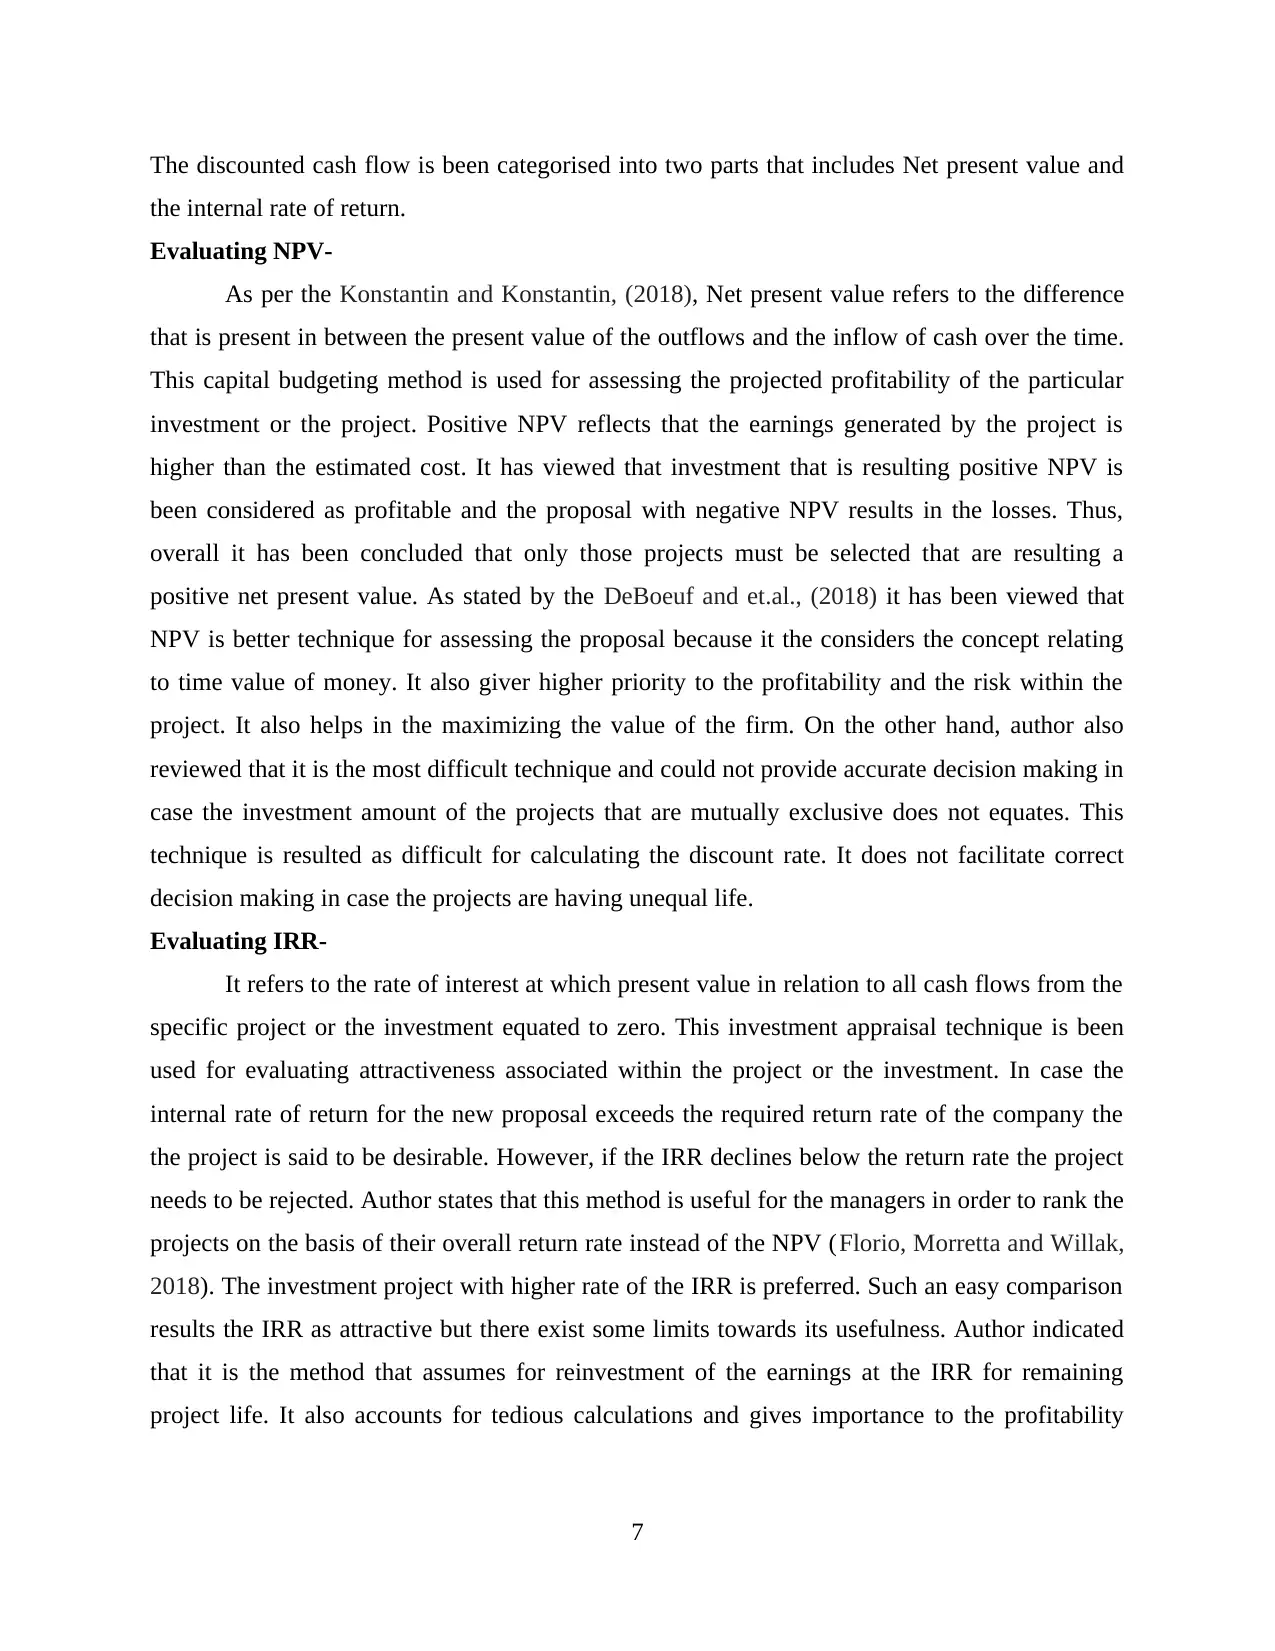
The discounted cash flow is been categorised into two parts that includes Net present value and
the internal rate of return.
Evaluating NPV-
As per the Konstantin and Konstantin, (2018), Net present value refers to the difference
that is present in between the present value of the outflows and the inflow of cash over the time.
This capital budgeting method is used for assessing the projected profitability of the particular
investment or the project. Positive NPV reflects that the earnings generated by the project is
higher than the estimated cost. It has viewed that investment that is resulting positive NPV is
been considered as profitable and the proposal with negative NPV results in the losses. Thus,
overall it has been concluded that only those projects must be selected that are resulting a
positive net present value. As stated by the DeBoeuf and et.al., (2018) it has been viewed that
NPV is better technique for assessing the proposal because it the considers the concept relating
to time value of money. It also giver higher priority to the profitability and the risk within the
project. It also helps in the maximizing the value of the firm. On the other hand, author also
reviewed that it is the most difficult technique and could not provide accurate decision making in
case the investment amount of the projects that are mutually exclusive does not equates. This
technique is resulted as difficult for calculating the discount rate. It does not facilitate correct
decision making in case the projects are having unequal life.
Evaluating IRR-
It refers to the rate of interest at which present value in relation to all cash flows from the
specific project or the investment equated to zero. This investment appraisal technique is been
used for evaluating attractiveness associated within the project or the investment. In case the
internal rate of return for the new proposal exceeds the required return rate of the company the
the project is said to be desirable. However, if the IRR declines below the return rate the project
needs to be rejected. Author states that this method is useful for the managers in order to rank the
projects on the basis of their overall return rate instead of the NPV (Florio, Morretta and Willak,
2018). The investment project with higher rate of the IRR is preferred. Such an easy comparison
results the IRR as attractive but there exist some limits towards its usefulness. Author indicated
that it is the method that assumes for reinvestment of the earnings at the IRR for remaining
project life. It also accounts for tedious calculations and gives importance to the profitability
7
⊘ This is a preview!⊘
Do you want full access?
Subscribe today to unlock all pages.
Trusted by 1+ million students worldwide

aspect and does not considers recouping of the capital expenditure which is not possible in
condition of uncertainty.
Investment appraisal results-
Computation of NPV
Year
Project A:
cash inflow
(in millions)
PV factor @
10%
Discounted
cash inflows
Project B:
cash inflow
(in millions)
Discoun
ted cash
inflows
1 7 0.909 6.4 8 7.3
2 9 0.826 7.4 10 8.3
3 8 0.751 6.0 9 6.8
4 12 0.683 8.2 14 9.6
5 15 0.621 9.3 16 9.9
51
Total
discounted
cash inflows 37.3 41.8
Less: initial
investment 35 35
NPV 2.3 6.8
Computation of IRR
Year Project A Project B
-35 -35
1 7 8
2 9 10
3 8 9
4 12 14
5 15 16
Internal rate of return 12% 16%
Interpretation/implications- From the above table it has been analysed that there are two
proposal that is project A and project B which has different values of cash inflow but the initial
investment of both the projects is same that resulted as 35. After evaluating the discounting
factor, the total discounted cash inflows resulting as 37.3 for project A and 41.8 for project B.
Thereafter, for computing the net present value, the initial outlay is been deducted from total
8
Paraphrase This Document
Need a fresh take? Get an instant paraphrase of this document with our AI Paraphraser
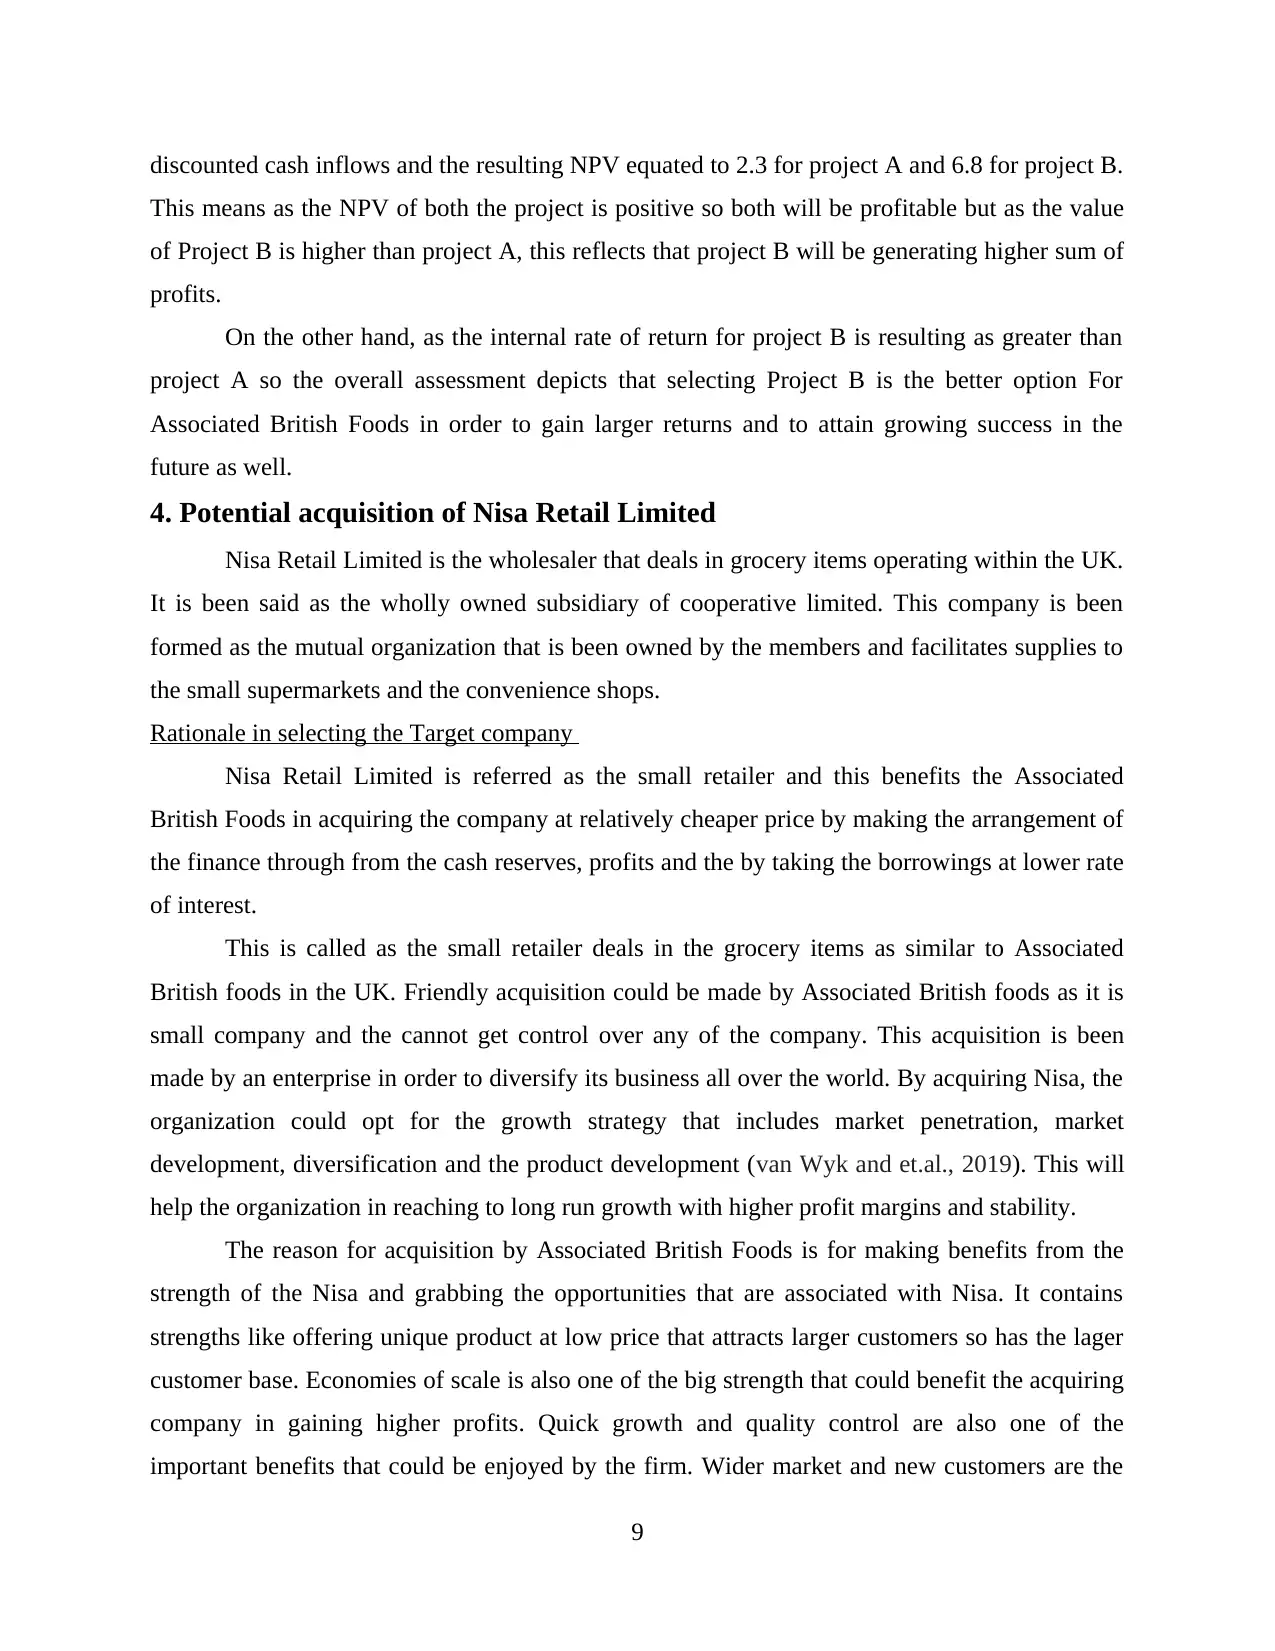
discounted cash inflows and the resulting NPV equated to 2.3 for project A and 6.8 for project B.
This means as the NPV of both the project is positive so both will be profitable but as the value
of Project B is higher than project A, this reflects that project B will be generating higher sum of
profits.
On the other hand, as the internal rate of return for project B is resulting as greater than
project A so the overall assessment depicts that selecting Project B is the better option For
Associated British Foods in order to gain larger returns and to attain growing success in the
future as well.
4. Potential acquisition of Nisa Retail Limited
Nisa Retail Limited is the wholesaler that deals in grocery items operating within the UK.
It is been said as the wholly owned subsidiary of cooperative limited. This company is been
formed as the mutual organization that is been owned by the members and facilitates supplies to
the small supermarkets and the convenience shops.
Rationale in selecting the Target company
Nisa Retail Limited is referred as the small retailer and this benefits the Associated
British Foods in acquiring the company at relatively cheaper price by making the arrangement of
the finance through from the cash reserves, profits and the by taking the borrowings at lower rate
of interest.
This is called as the small retailer deals in the grocery items as similar to Associated
British foods in the UK. Friendly acquisition could be made by Associated British foods as it is
small company and the cannot get control over any of the company. This acquisition is been
made by an enterprise in order to diversify its business all over the world. By acquiring Nisa, the
organization could opt for the growth strategy that includes market penetration, market
development, diversification and the product development (van Wyk and et.al., 2019). This will
help the organization in reaching to long run growth with higher profit margins and stability.
The reason for acquisition by Associated British Foods is for making benefits from the
strength of the Nisa and grabbing the opportunities that are associated with Nisa. It contains
strengths like offering unique product at low price that attracts larger customers so has the lager
customer base. Economies of scale is also one of the big strength that could benefit the acquiring
company in gaining higher profits. Quick growth and quality control are also one of the
important benefits that could be enjoyed by the firm. Wider market and new customers are the
9

main opportunities that help Associated British Foods in developing the scope of their business
and creating a well known presence across the world.
Synergistic gain from the acquisition
As the result of an acquisition of Nisa, both acquiring and the acquired company could
generate larger sales which in turn helps in gaining synergies in respect of revenues. Cost
synergies can also be achieved by the combined organizations as the resources of the both the
companies are accumulated which results getting the goods at the lower cost with unique quality
of the products (Castles, Rastle and Nation, 2018). Financial synergies could be resulted from the
acquisition as the funds, reserves and the profits of the both the companies are gained which
leads to larger funds so that the growth in the long term could be reached.
Explaining and evaluating the financing within the acquisition
Although the sales of Nisa is decreasing in the year 2017 as compared to 2016, which in
turn resulted as decline in gross margins which resulted as 142070 in the year 2016 and 135713
in the year 2017. However, for the year 2016 the company was resulting a loss of 4465 but in the
year 2017, it attained a positive returns amounting to 2029. This is because the administration
expense and the depreciation of the company reduces during the year 2017. This reflects that the
net profit margin of Nisa is increasing over the year so it will benefit Associated British Foods
expanding their business.
Assessing the risk and the uncertainties
It has been suggested that the financial information and the ratio analysis is counted as
the useful tool in identifying the performance and the position of the company. However, It fails
in making the predictions regarding the net income that the company will gain (Chen and et.al.,
2018). It is majorly based on estimations and does not provide for accurate evaluation. This
creates risk and the uncertainty for the acquiring company that is Associated British Foods in
making the estimations and the decisions in relation to acquiring Nisa. For example- If the
profits figures are been manipulated in order to show better performance of the company then it
creates a high risk for Associated British Foods as it cannot make appropriate evaluation.
Potential implications
As low sales is been generated by Nisa in the year 2017, Associated British Foods must
have to ensure about developing appropriate marketing strategy that attracts the customers
towards the products. In the year 2017, as the net profit margins of Nisa is increasing so this
10
⊘ This is a preview!⊘
Do you want full access?
Subscribe today to unlock all pages.
Trusted by 1+ million students worldwide
1 out of 15
Related Documents


Your All-in-One AI-Powered Toolkit for Academic Success.
+13062052269
info@desklib.com
Available 24*7 on WhatsApp / Email
![[object Object]](/_next/static/media/star-bottom.7253800d.svg)
Unlock your academic potential
Copyright © 2020–2026 A2Z Services. All Rights Reserved. Developed and managed by ZUCOL.