Catanza Technologies: Evaluating Robotic Lawnmower Project RLM19
VerifiedAdded on 2023/06/11
|18
|4356
|238
Case Study
AI Summary
This case study solution analyzes Catanza Technologies' project to develop a robotic lawnmower (RLM19) using either Electric Wire (EW) or GPS technology. The analysis employs decision tree analysis, Net Present Value (NPV), and sensitivity analysis to determine the optimal path forward. The study finds that while EW presents lower initial costs and quicker market entry, GPS offers higher potential revenue despite increased risk. The report recommends GPS for companies with high risk tolerance and EW for those with low risk tolerance; moderate risk tolerance necessitates further research. The strengths of the analysis include the expertise of the marketing team and the availability of probabilities for future events, while limitations include the need for additional data collection to improve decision-making. Desklib offers a wealth of similar case studies and solved assignments for students.

Catanza Technologies Case
Study
Study
Paraphrase This Document
Need a fresh take? Get an instant paraphrase of this document with our AI Paraphraser
EXECUTIVE SUMMARY
This report is based on Catanza plc who is proposing to develop a new robotic lawnmover
whose code in RLM19. There are two options available with Catanza for the development of
prototype that is, EW or Electric Wire and GPS or Global Positioning System. Accordingly, to
determine an optimal choice, analysis has been done by adopting several decision making
techniques such as decision tree analysis, Net Present Value technique and Sensitivity analysis.
On the basis of these analytical technique, a most suitable or profitable course of action has been
recommended. Furthermore, the review of different alternatives associated with recommended
options has been done along with highlighting the strength of the process which facilitates the
use of decision-making techniques such as expertise of marketing team, availability of
probabilities for several future events, etc. Alongside, several limitations of the process have
been identified with reference to potential additional research & collection of data to facilitate
better decision-making process.
With the help of analysis performed, it has been determined that EW has characteristics
such as low risk tolerance, lower initial cost of investment and reaching market quicker. On the
other hand, with the help of data analysis performed through decision making framework such as
NPV and decision tree analysis, GPS was found to be a preferred option because of higher
potential in generating revenue despite of the fact that it leads to additional risks. The reports end
with the recommendation where it has been stated that Catanza should go for GPS in case of
high risk appetite while the company should go for EW in case of low risk appetite. If the risk
appetite was found to be moderate, then additional research is needed to choose the best
alternative.
Table of Contents
EXECUTIVE SUMMARY.............................................................................................................2
INTRODUCTION...........................................................................................................................4
Question 1........................................................................................................................................4
Background and situational analysis...........................................................................................4
Methodology................................................................................................................................5
Assumptions................................................................................................................................5
Decision tree indicating choices and decision made on the basis of NPVs.................................6
4. Sensitivity analysis as an alternative decision making technique.........................................11
5. Recommended course of action.............................................................................................11
Question 2......................................................................................................................................12
Strength of the Analysis.............................................................................................................12
Limitation of the analysis..........................................................................................................13
CONCLUSION..............................................................................................................................14
RECOMMENDATION.................................................................................................................14
REFERENCES................................................................................................................................1
⊘ This is a preview!⊘
Do you want full access?
Subscribe today to unlock all pages.
Trusted by 1+ million students worldwide
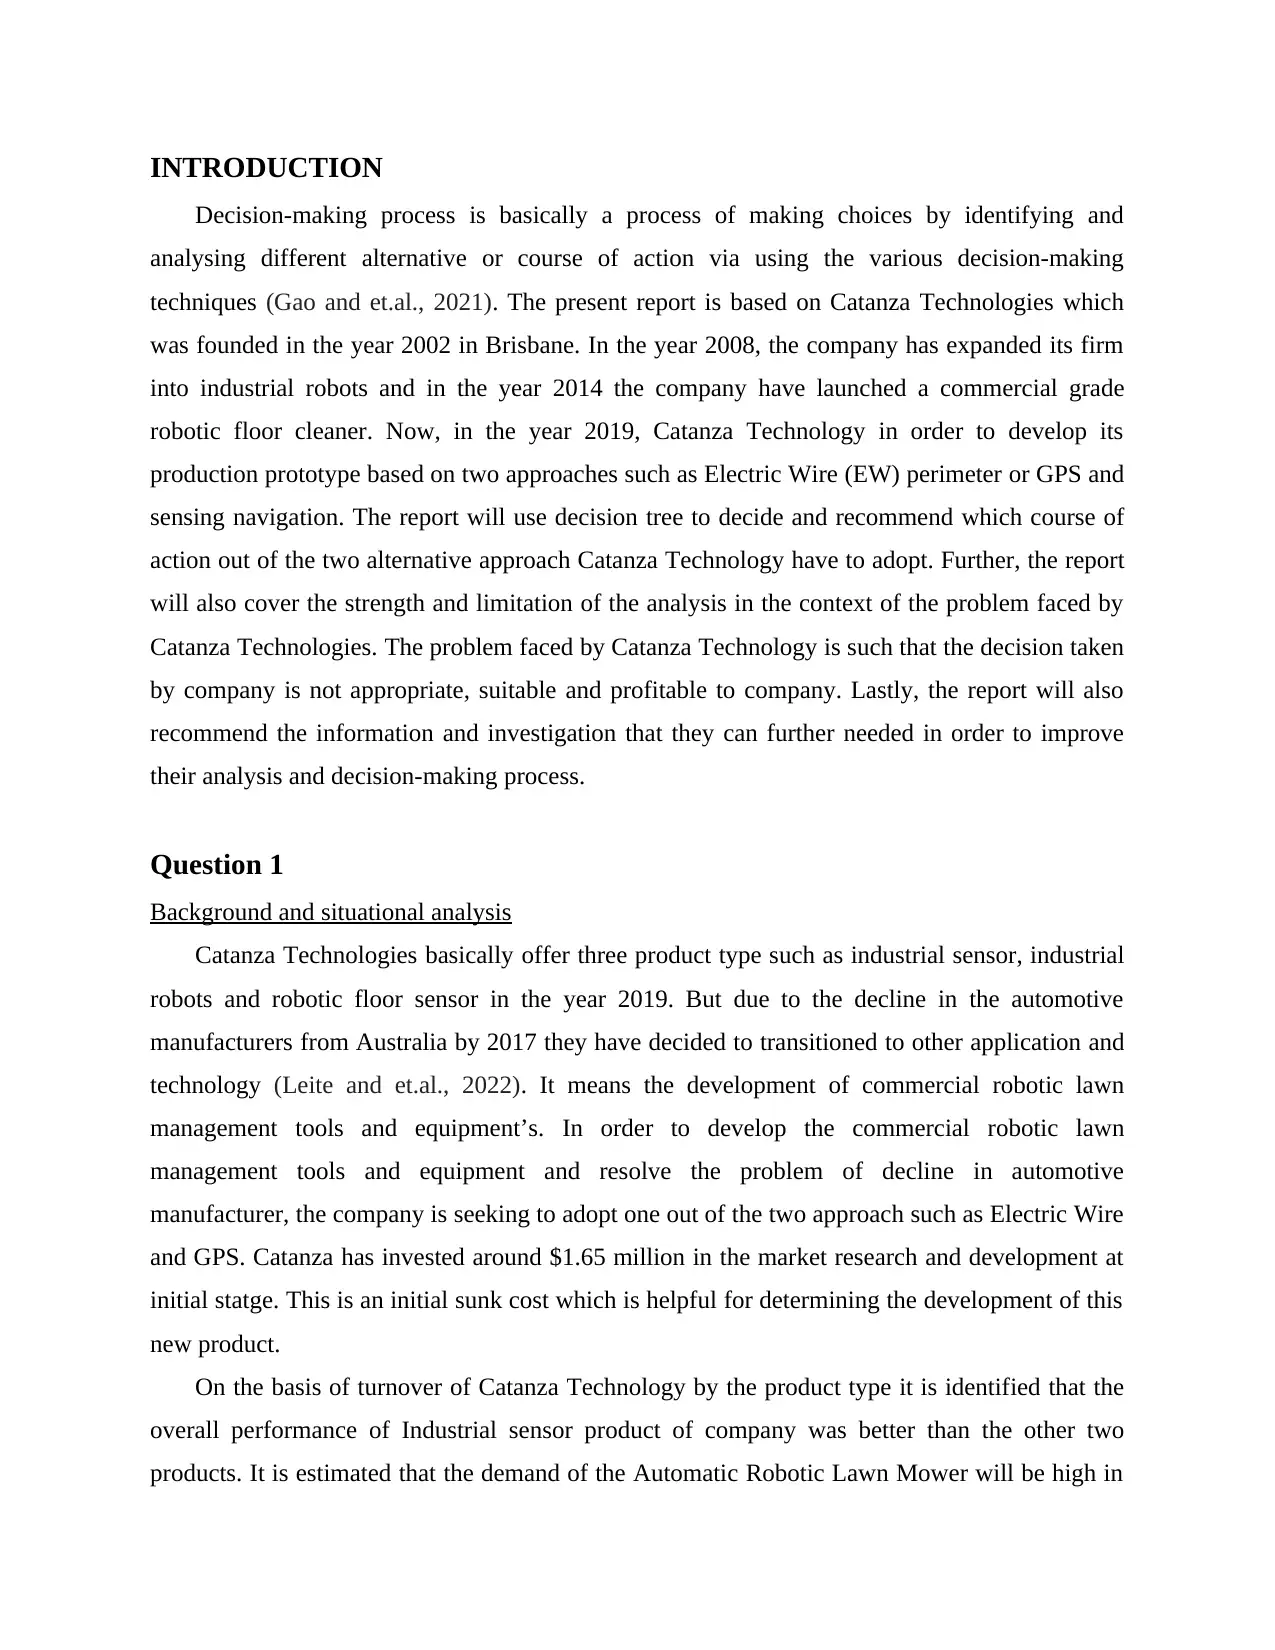
INTRODUCTION
Decision-making process is basically a process of making choices by identifying and
analysing different alternative or course of action via using the various decision-making
techniques (Gao and et.al., 2021). The present report is based on Catanza Technologies which
was founded in the year 2002 in Brisbane. In the year 2008, the company has expanded its firm
into industrial robots and in the year 2014 the company have launched a commercial grade
robotic floor cleaner. Now, in the year 2019, Catanza Technology in order to develop its
production prototype based on two approaches such as Electric Wire (EW) perimeter or GPS and
sensing navigation. The report will use decision tree to decide and recommend which course of
action out of the two alternative approach Catanza Technology have to adopt. Further, the report
will also cover the strength and limitation of the analysis in the context of the problem faced by
Catanza Technologies. The problem faced by Catanza Technology is such that the decision taken
by company is not appropriate, suitable and profitable to company. Lastly, the report will also
recommend the information and investigation that they can further needed in order to improve
their analysis and decision-making process.
Question 1
Background and situational analysis
Catanza Technologies basically offer three product type such as industrial sensor, industrial
robots and robotic floor sensor in the year 2019. But due to the decline in the automotive
manufacturers from Australia by 2017 they have decided to transitioned to other application and
technology (Leite and et.al., 2022). It means the development of commercial robotic lawn
management tools and equipment’s. In order to develop the commercial robotic lawn
management tools and equipment and resolve the problem of decline in automotive
manufacturer, the company is seeking to adopt one out of the two approach such as Electric Wire
and GPS. Catanza has invested around $1.65 million in the market research and development at
initial statge. This is an initial sunk cost which is helpful for determining the development of this
new product.
On the basis of turnover of Catanza Technology by the product type it is identified that the
overall performance of Industrial sensor product of company was better than the other two
products. It is estimated that the demand of the Automatic Robotic Lawn Mower will be high in
Paraphrase This Document
Need a fresh take? Get an instant paraphrase of this document with our AI Paraphraser
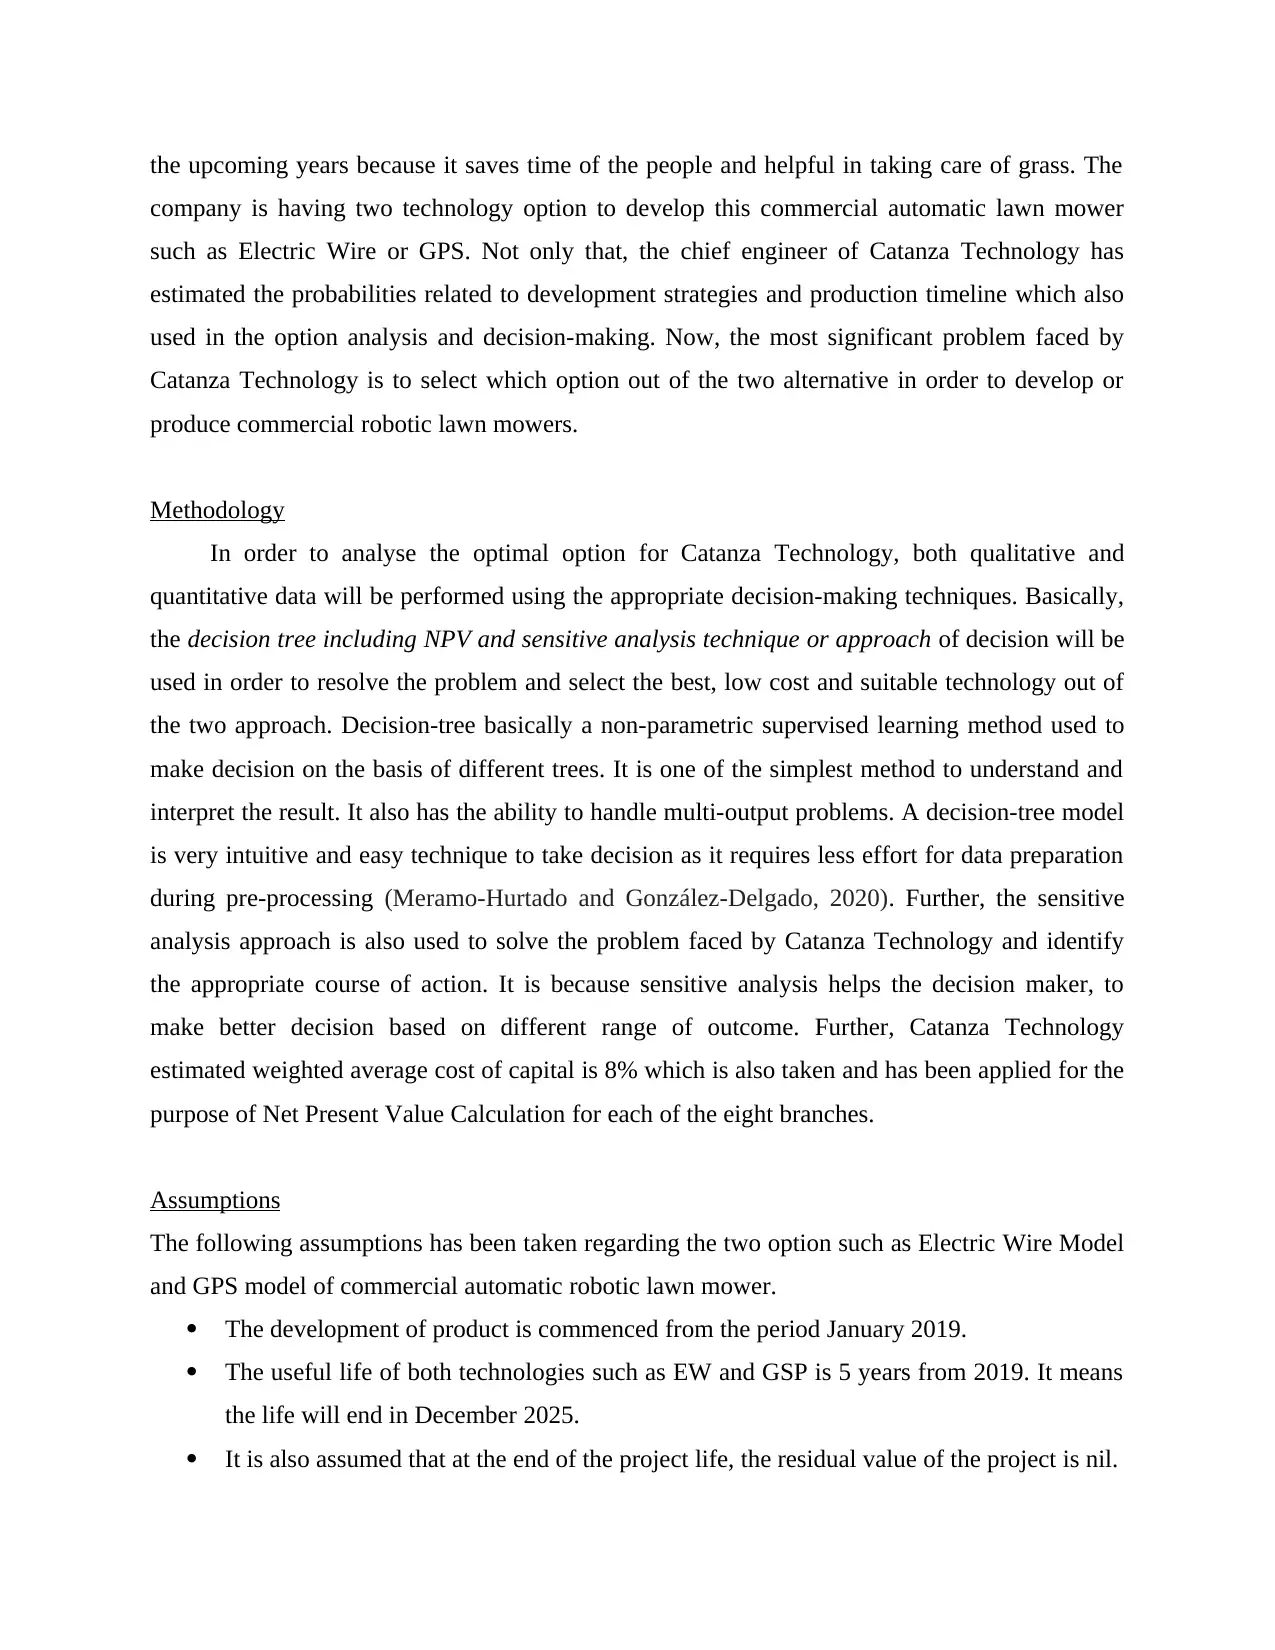
the upcoming years because it saves time of the people and helpful in taking care of grass. The
company is having two technology option to develop this commercial automatic lawn mower
such as Electric Wire or GPS. Not only that, the chief engineer of Catanza Technology has
estimated the probabilities related to development strategies and production timeline which also
used in the option analysis and decision-making. Now, the most significant problem faced by
Catanza Technology is to select which option out of the two alternative in order to develop or
produce commercial robotic lawn mowers.
Methodology
In order to analyse the optimal option for Catanza Technology, both qualitative and
quantitative data will be performed using the appropriate decision-making techniques. Basically,
the decision tree including NPV and sensitive analysis technique or approach of decision will be
used in order to resolve the problem and select the best, low cost and suitable technology out of
the two approach. Decision-tree basically a non-parametric supervised learning method used to
make decision on the basis of different trees. It is one of the simplest method to understand and
interpret the result. It also has the ability to handle multi-output problems. A decision-tree model
is very intuitive and easy technique to take decision as it requires less effort for data preparation
during pre-processing (Meramo-Hurtado and González-Delgado, 2020) . Further, the sensitive
analysis approach is also used to solve the problem faced by Catanza Technology and identify
the appropriate course of action. It is because sensitive analysis helps the decision maker, to
make better decision based on different range of outcome. Further, Catanza Technology
estimated weighted average cost of capital is 8% which is also taken and has been applied for the
purpose of Net Present Value Calculation for each of the eight branches.
Assumptions
The following assumptions has been taken regarding the two option such as Electric Wire Model
and GPS model of commercial automatic robotic lawn mower.
The development of product is commenced from the period January 2019.
The useful life of both technologies such as EW and GSP is 5 years from 2019. It means
the life will end in December 2025.
It is also assumed that at the end of the project life, the residual value of the project is nil.
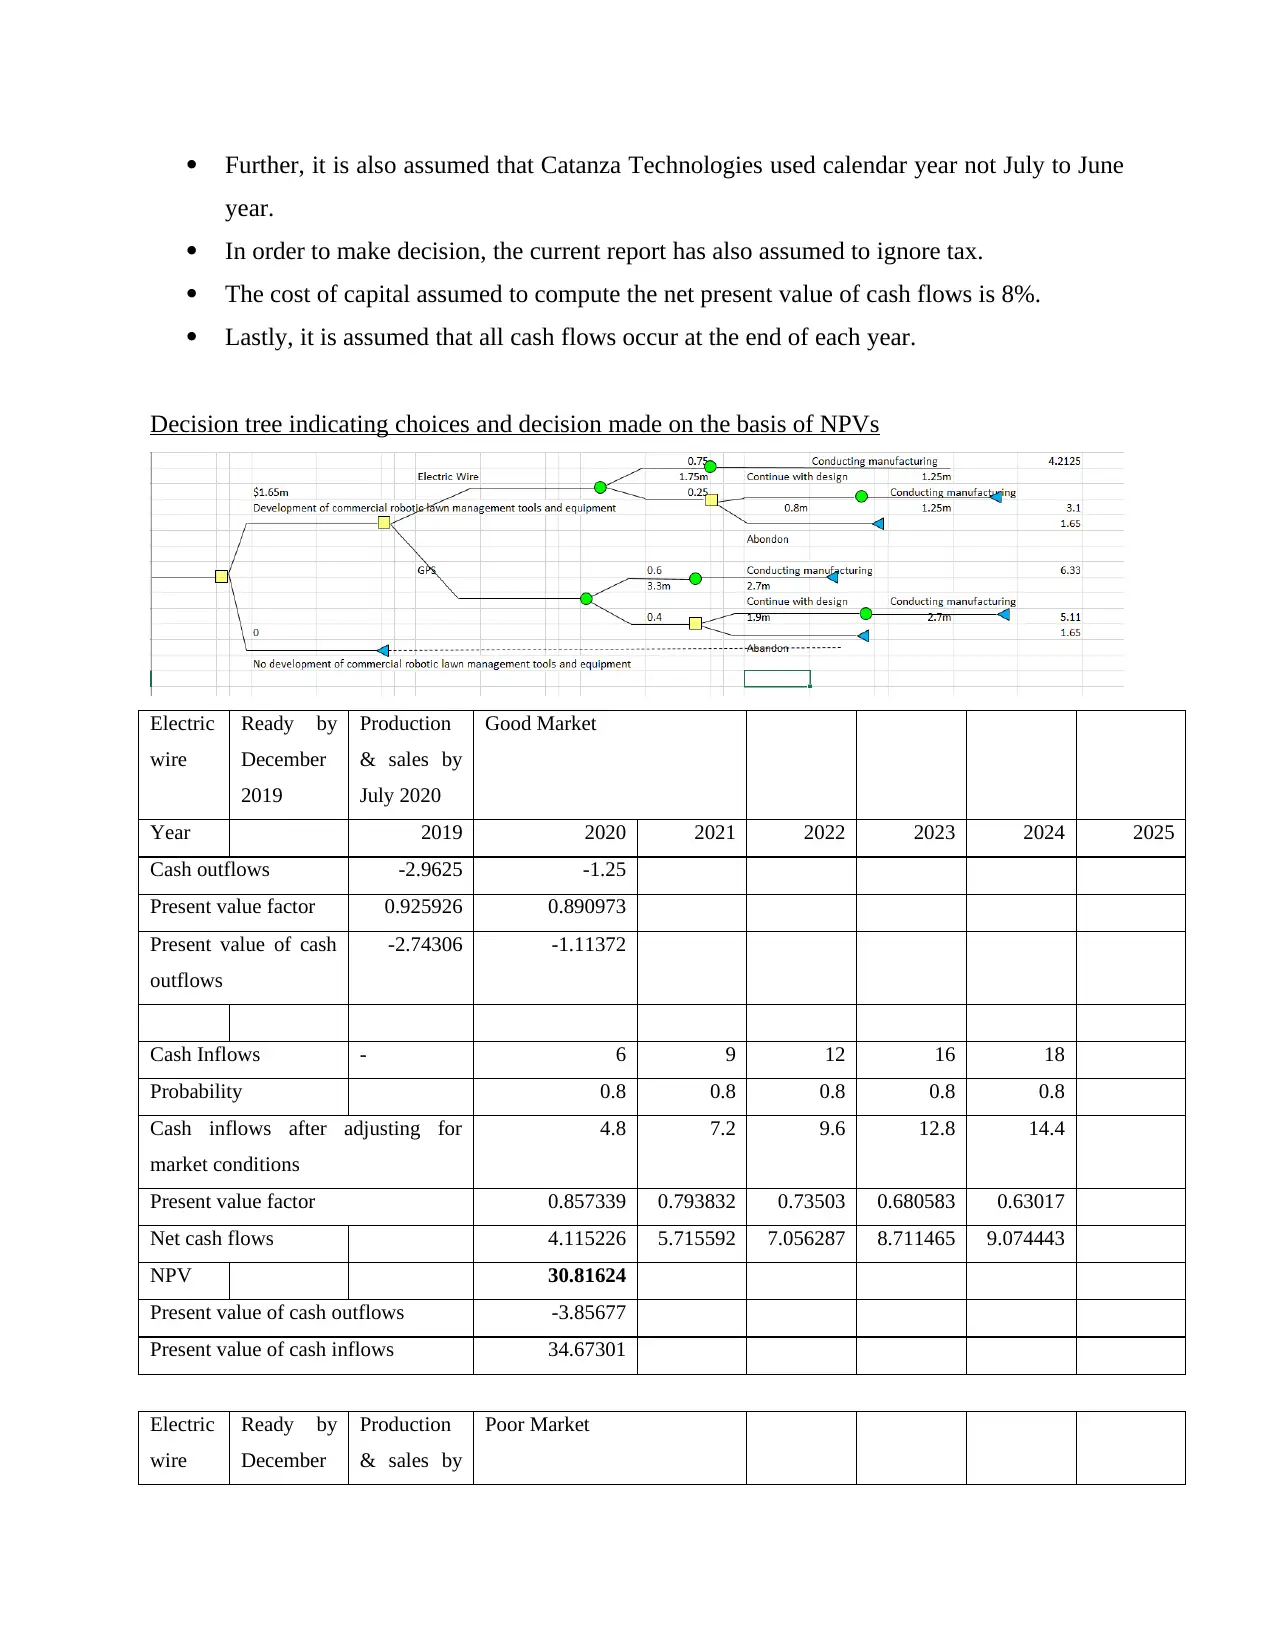
Further, it is also assumed that Catanza Technologies used calendar year not July to June
year.
In order to make decision, the current report has also assumed to ignore tax.
The cost of capital assumed to compute the net present value of cash flows is 8%.
Lastly, it is assumed that all cash flows occur at the end of each year.
Decision tree indicating choices and decision made on the basis of NPVs
Electric
wire
Ready by
December
2019
Production
& sales by
July 2020
Good Market
Year 2019 2020 2021 2022 2023 2024 2025
Cash outflows -2.9625 -1.25
Present value factor 0.925926 0.890973
Present value of cash
outflows
-2.74306 -1.11372
Cash Inflows - 6 9 12 16 18
Probability 0.8 0.8 0.8 0.8 0.8
Cash inflows after adjusting for
market conditions
4.8 7.2 9.6 12.8 14.4
Present value factor 0.857339 0.793832 0.73503 0.680583 0.63017
Net cash flows 4.115226 5.715592 7.056287 8.711465 9.074443
NPV 30.81624
Present value of cash outflows -3.85677
Present value of cash inflows 34.67301
Electric
wire
Ready by
December
Production
& sales by
Poor Market
⊘ This is a preview!⊘
Do you want full access?
Subscribe today to unlock all pages.
Trusted by 1+ million students worldwide
2019 July 2020
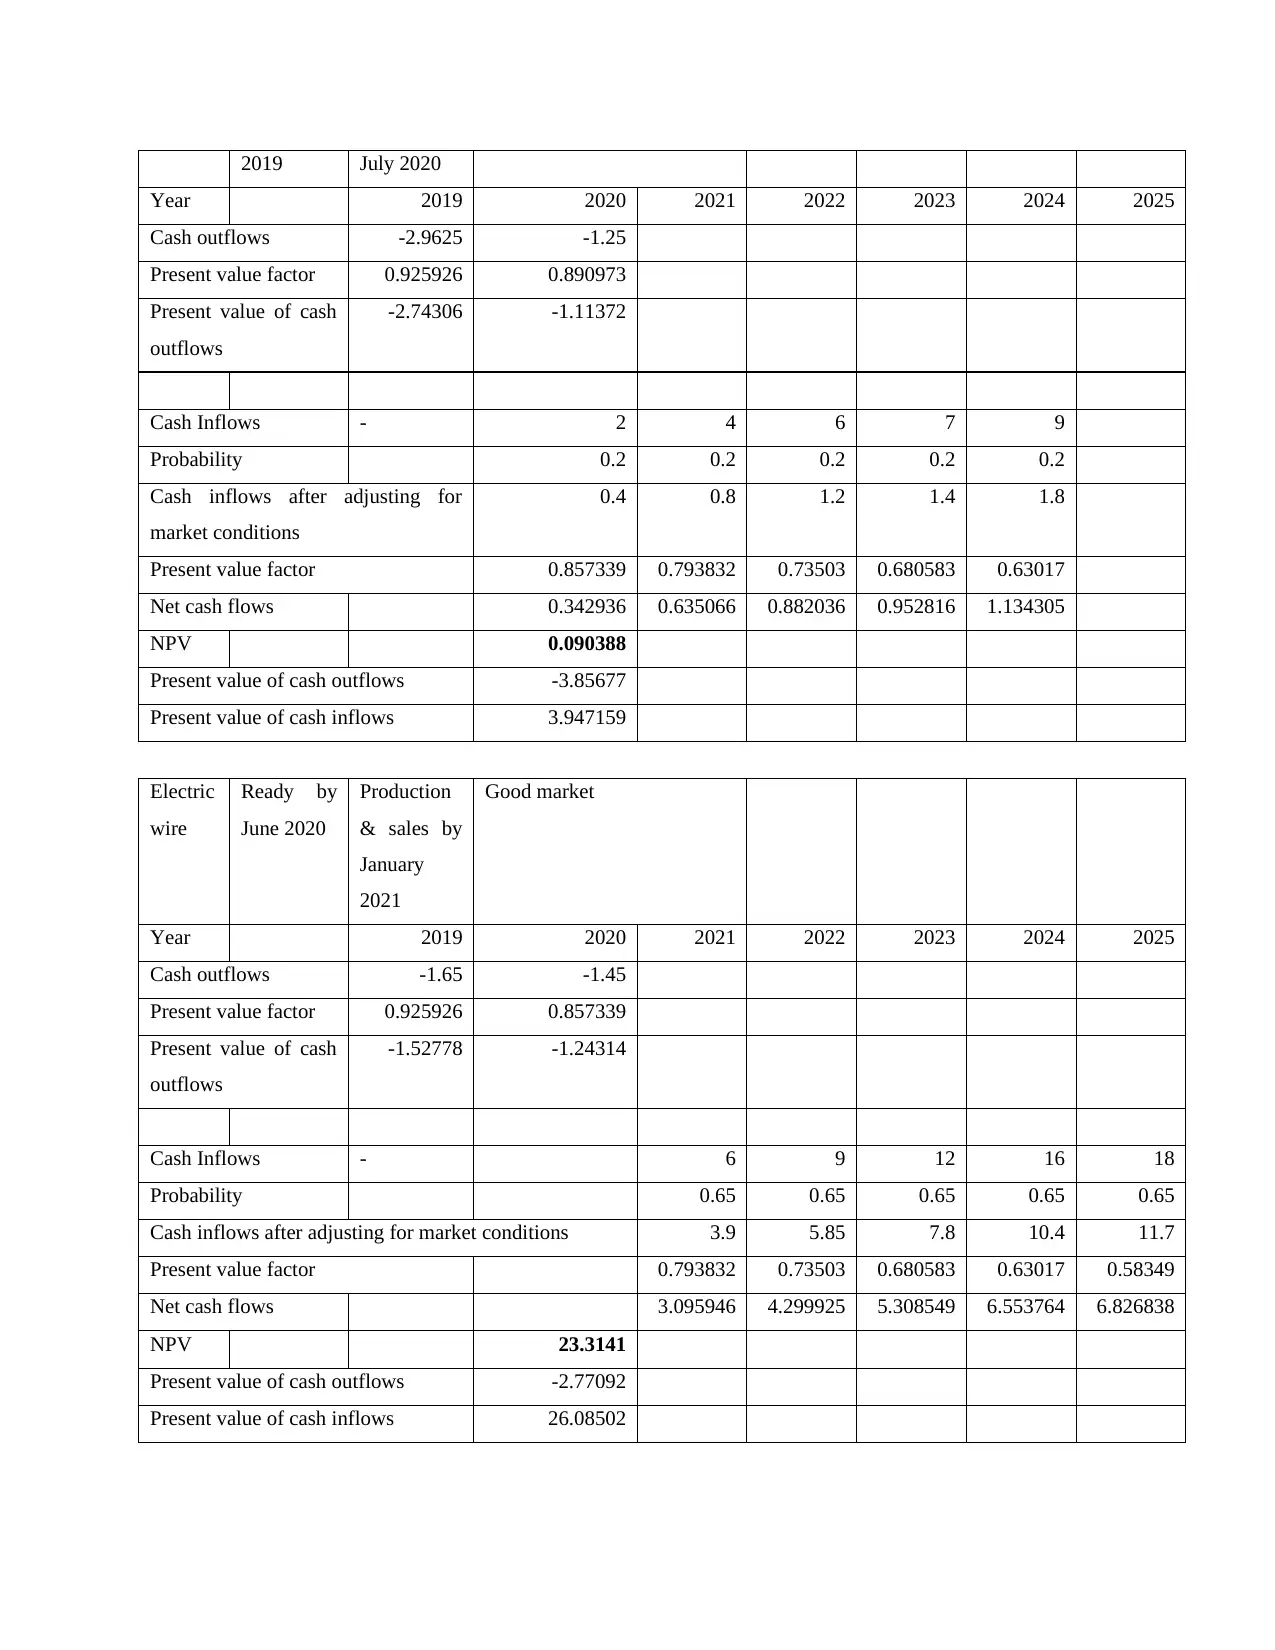
Year 2019 2020 2021 2022 2023 2024 2025
Cash outflows -2.9625 -1.25
Present value factor 0.925926 0.890973
Present value of cash
outflows
-2.74306 -1.11372
Cash Inflows - 2 4 6 7 9
Probability 0.2 0.2 0.2 0.2 0.2
Cash inflows after adjusting for
market conditions
0.4 0.8 1.2 1.4 1.8
Present value factor 0.857339 0.793832 0.73503 0.680583 0.63017
Net cash flows 0.342936 0.635066 0.882036 0.952816 1.134305
NPV 0.090388
Present value of cash outflows -3.85677
Present value of cash inflows 3.947159
Electric
wire
Ready by
June 2020
Production
& sales by
January
2021
Good market
Year 2019 2020 2021 2022 2023 2024 2025
Cash outflows -1.65 -1.45
Present value factor 0.925926 0.857339
Present value of cash
outflows
-1.52778 -1.24314
Cash Inflows - 6 9 12 16 18
Probability 0.65 0.65 0.65 0.65 0.65
Cash inflows after adjusting for market conditions 3.9 5.85 7.8 10.4 11.7
Present value factor 0.793832 0.73503 0.680583 0.63017 0.58349
Net cash flows 3.095946 4.299925 5.308549 6.553764 6.826838
NPV 23.3141
Present value of cash outflows -2.77092
Present value of cash inflows 26.08502
Year 2019 2020 2021 2022 2023 2024 2025
Cash outflows -2.9625 -1.25
Present value factor 0.925926 0.890973
Present value of cash
outflows
-2.74306 -1.11372
Cash Inflows - 2 4 6 7 9
Probability 0.2 0.2 0.2 0.2 0.2
Cash inflows after adjusting for
market conditions
0.4 0.8 1.2 1.4 1.8
Present value factor 0.857339 0.793832 0.73503 0.680583 0.63017
Net cash flows 0.342936 0.635066 0.882036 0.952816 1.134305
NPV 0.090388
Present value of cash outflows -3.85677
Present value of cash inflows 3.947159
Electric
wire
Ready by
June 2020
Production
& sales by
January
2021
Good market
Year 2019 2020 2021 2022 2023 2024 2025
Cash outflows -1.65 -1.45
Present value factor 0.925926 0.857339
Present value of cash
outflows
-1.52778 -1.24314
Cash Inflows - 6 9 12 16 18
Probability 0.65 0.65 0.65 0.65 0.65
Cash inflows after adjusting for market conditions 3.9 5.85 7.8 10.4 11.7
Present value factor 0.793832 0.73503 0.680583 0.63017 0.58349
Net cash flows 3.095946 4.299925 5.308549 6.553764 6.826838
NPV 23.3141
Present value of cash outflows -2.77092
Present value of cash inflows 26.08502
Paraphrase This Document
Need a fresh take? Get an instant paraphrase of this document with our AI Paraphraser
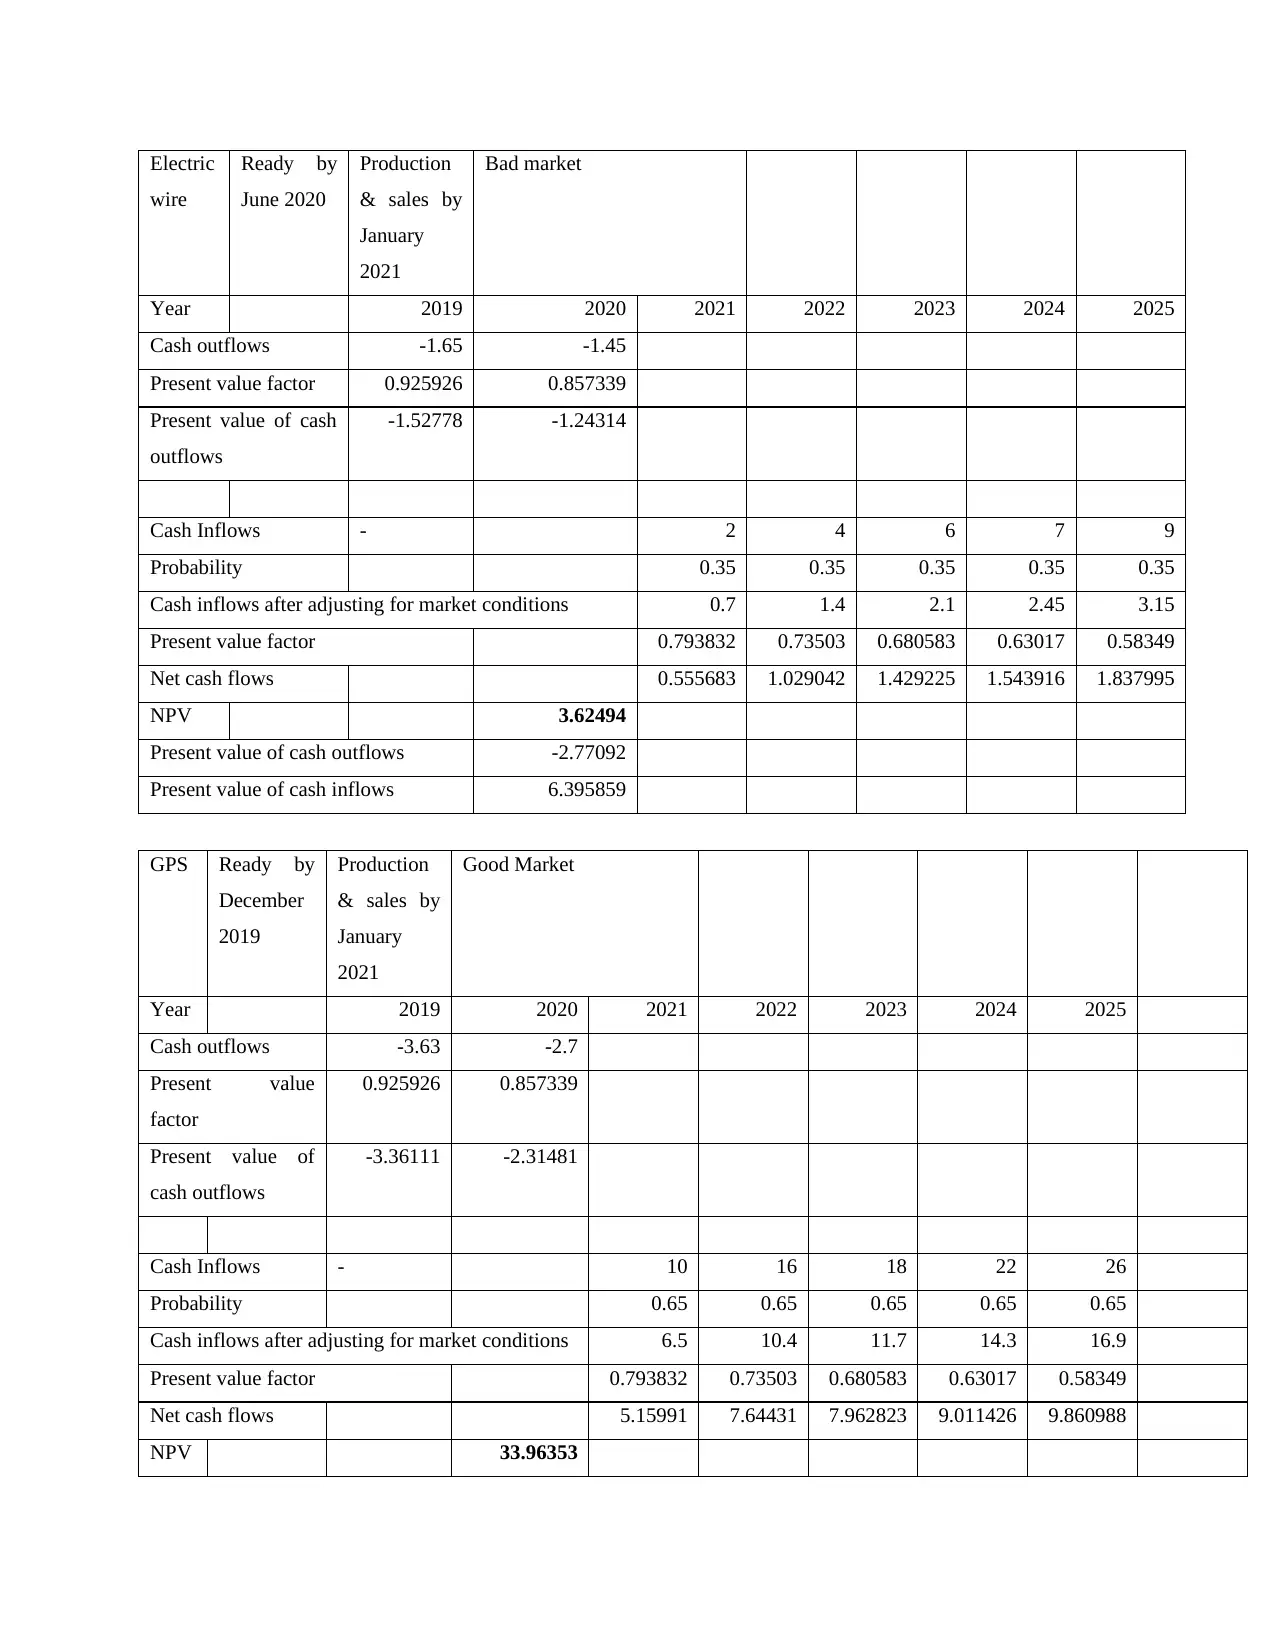
Electric
wire
Ready by
June 2020
Production
& sales by
January
2021
Bad market
Year 2019 2020 2021 2022 2023 2024 2025
Cash outflows -1.65 -1.45
Present value factor 0.925926 0.857339
Present value of cash
outflows
-1.52778 -1.24314
Cash Inflows - 2 4 6 7 9
Probability 0.35 0.35 0.35 0.35 0.35
Cash inflows after adjusting for market conditions 0.7 1.4 2.1 2.45 3.15
Present value factor 0.793832 0.73503 0.680583 0.63017 0.58349
Net cash flows 0.555683 1.029042 1.429225 1.543916 1.837995
NPV 3.62494
Present value of cash outflows -2.77092
Present value of cash inflows 6.395859
GPS Ready by
December
2019
Production
& sales by
January
2021
Good Market
Year 2019 2020 2021 2022 2023 2024 2025
Cash outflows -3.63 -2.7
Present value
factor
0.925926 0.857339
Present value of
cash outflows
-3.36111 -2.31481
Cash Inflows - 10 16 18 22 26
Probability 0.65 0.65 0.65 0.65 0.65
Cash inflows after adjusting for market conditions 6.5 10.4 11.7 14.3 16.9
Present value factor 0.793832 0.73503 0.680583 0.63017 0.58349
Net cash flows 5.15991 7.64431 7.962823 9.011426 9.860988
NPV 33.96353
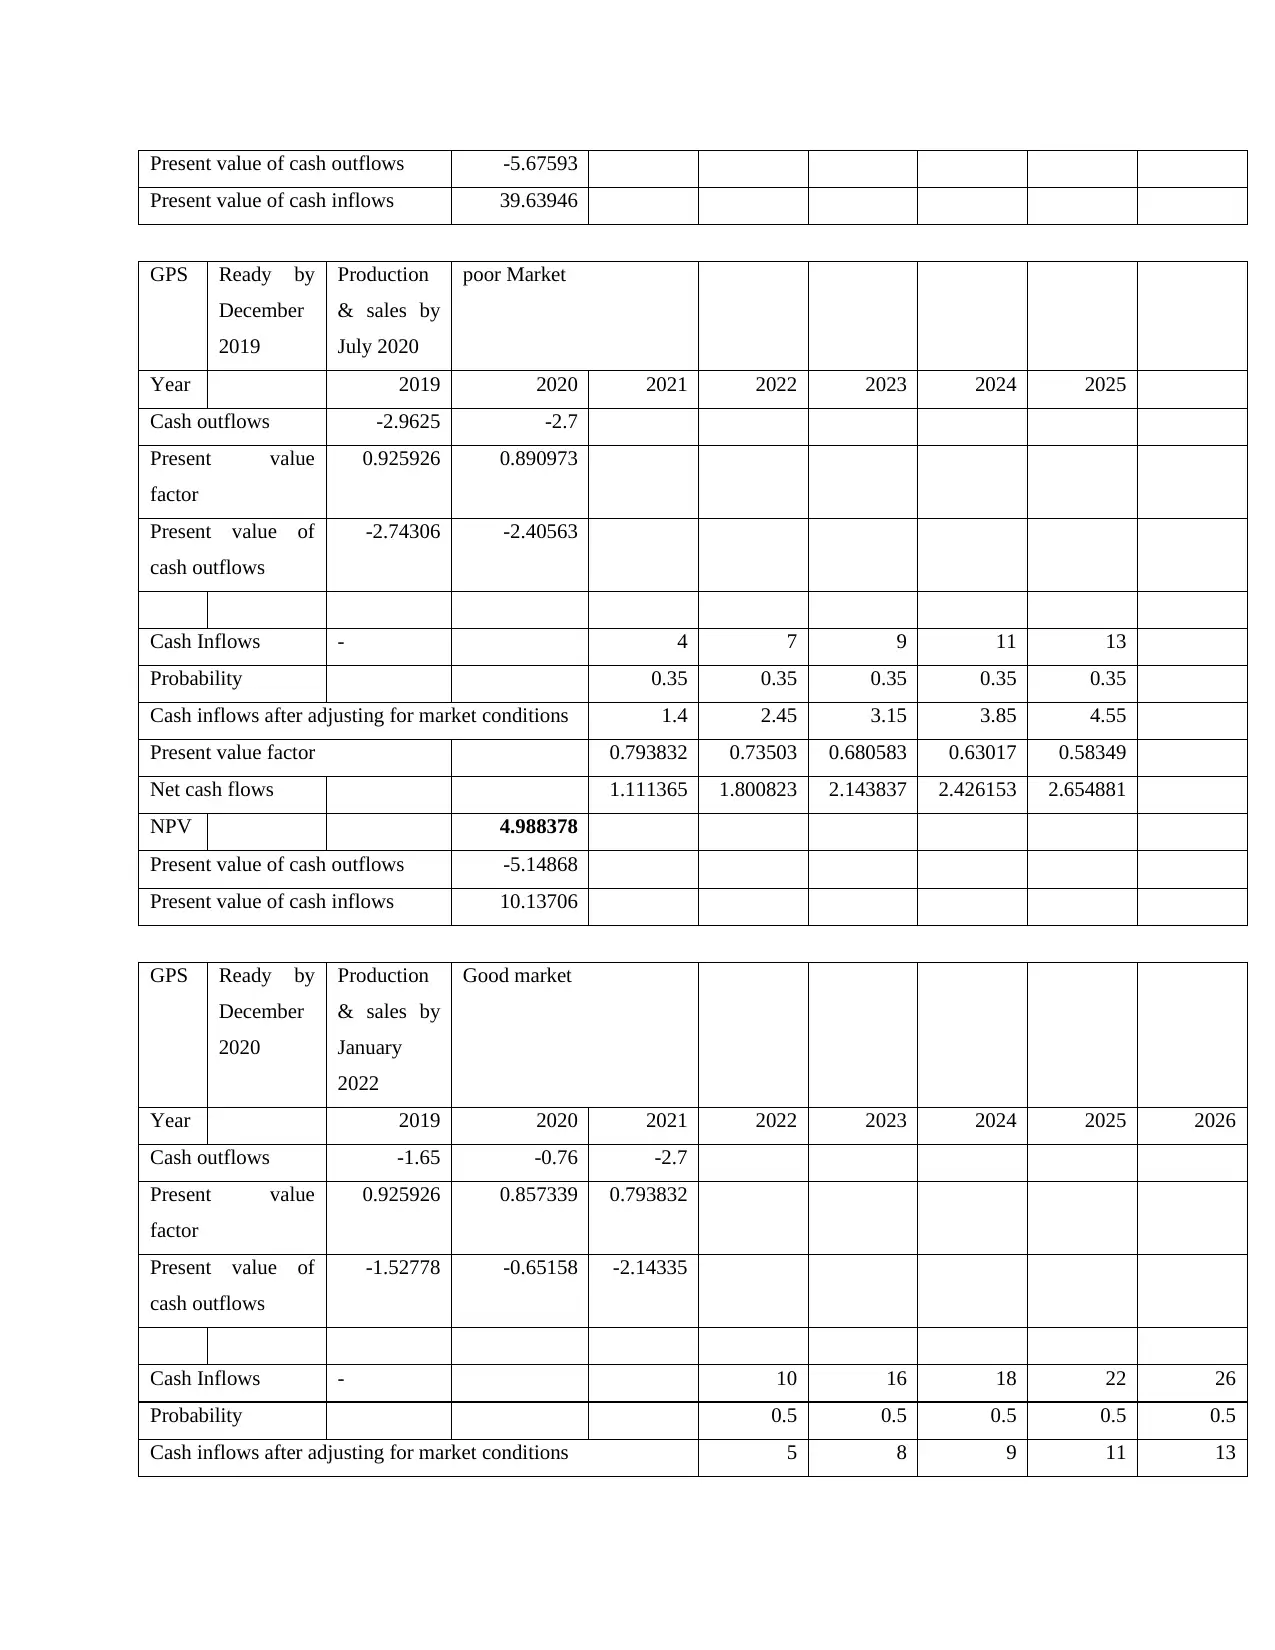
Present value of cash outflows -5.67593
Present value of cash inflows 39.63946
GPS Ready by
December
2019
Production
& sales by
July 2020
poor Market
Year 2019 2020 2021 2022 2023 2024 2025
Cash outflows -2.9625 -2.7
Present value
factor
0.925926 0.890973
Present value of
cash outflows
-2.74306 -2.40563
Cash Inflows - 4 7 9 11 13
Probability 0.35 0.35 0.35 0.35 0.35
Cash inflows after adjusting for market conditions 1.4 2.45 3.15 3.85 4.55
Present value factor 0.793832 0.73503 0.680583 0.63017 0.58349
Net cash flows 1.111365 1.800823 2.143837 2.426153 2.654881
NPV 4.988378
Present value of cash outflows -5.14868
Present value of cash inflows 10.13706
GPS Ready by
December
2020
Production
& sales by
January
2022
Good market
Year 2019 2020 2021 2022 2023 2024 2025 2026
Cash outflows -1.65 -0.76 -2.7
Present value
factor
0.925926 0.857339 0.793832
Present value of
cash outflows
-1.52778 -0.65158 -2.14335
Cash Inflows - 10 16 18 22 26
Probability 0.5 0.5 0.5 0.5 0.5
Cash inflows after adjusting for market conditions 5 8 9 11 13
⊘ This is a preview!⊘
Do you want full access?
Subscribe today to unlock all pages.
Trusted by 1+ million students worldwide
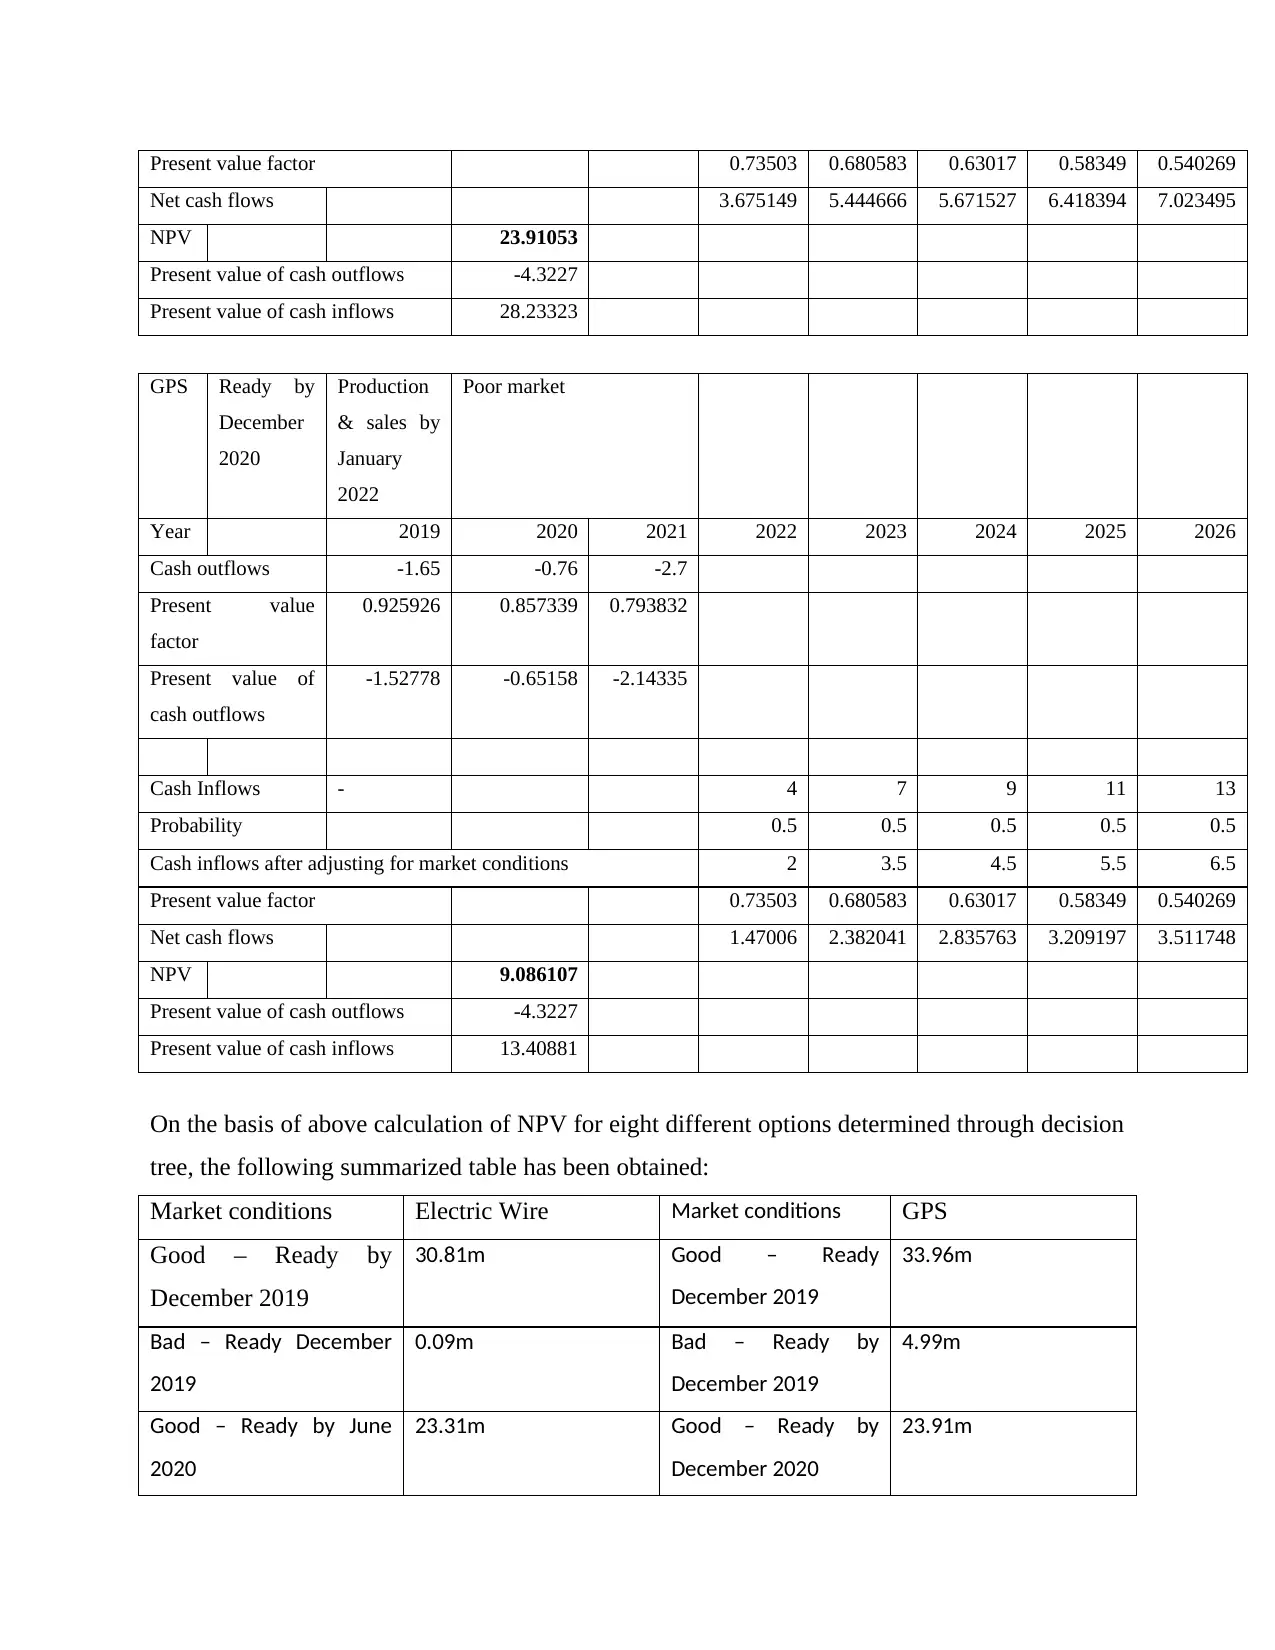
Present value factor 0.73503 0.680583 0.63017 0.58349 0.540269
Net cash flows 3.675149 5.444666 5.671527 6.418394 7.023495
NPV 23.91053
Present value of cash outflows -4.3227
Present value of cash inflows 28.23323
GPS Ready by
December
2020
Production
& sales by
January
2022
Poor market
Year 2019 2020 2021 2022 2023 2024 2025 2026
Cash outflows -1.65 -0.76 -2.7
Present value
factor
0.925926 0.857339 0.793832
Present value of
cash outflows
-1.52778 -0.65158 -2.14335
Cash Inflows - 4 7 9 11 13
Probability 0.5 0.5 0.5 0.5 0.5
Cash inflows after adjusting for market conditions 2 3.5 4.5 5.5 6.5
Present value factor 0.73503 0.680583 0.63017 0.58349 0.540269
Net cash flows 1.47006 2.382041 2.835763 3.209197 3.511748
NPV 9.086107
Present value of cash outflows -4.3227
Present value of cash inflows 13.40881
On the basis of above calculation of NPV for eight different options determined through decision
tree, the following summarized table has been obtained:
Market conditions Electric Wire Market conditions GPS
Good – Ready by
December 2019
30.81m Good – Ready
December 2019
33.96m
Bad – Ready December
2019
0.09m Bad – Ready by
December 2019
4.99m
Good – Ready by June
2020
23.31m Good – Ready by
December 2020
23.91m
Paraphrase This Document
Need a fresh take? Get an instant paraphrase of this document with our AI Paraphraser
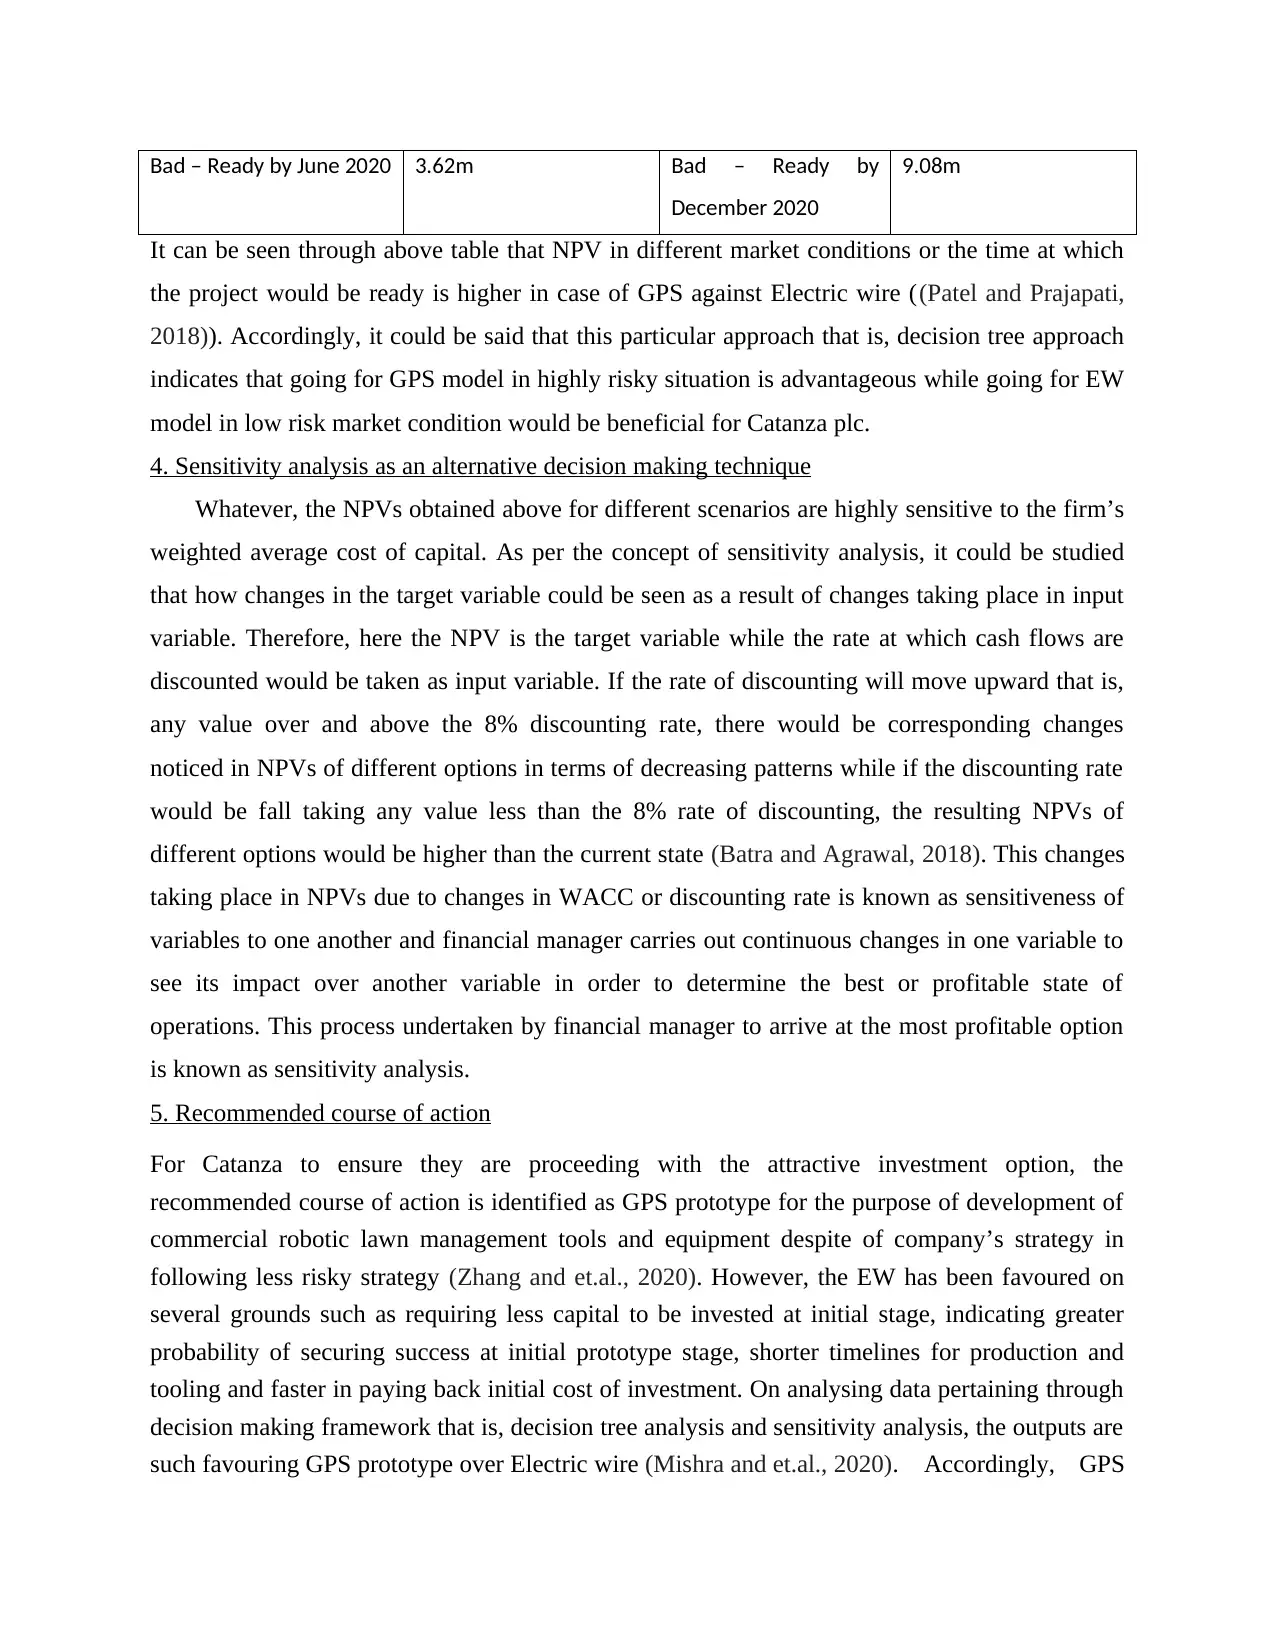
Bad – Ready by June 2020 3.62m Bad – Ready by
December 2020
9.08m
It can be seen through above table that NPV in different market conditions or the time at which
the project would be ready is higher in case of GPS against Electric wire ((Patel and Prajapati,
2018)). Accordingly, it could be said that this particular approach that is, decision tree approach
indicates that going for GPS model in highly risky situation is advantageous while going for EW
model in low risk market condition would be beneficial for Catanza plc.
4. Sensitivity analysis as an alternative decision making technique
Whatever, the NPVs obtained above for different scenarios are highly sensitive to the firm’s
weighted average cost of capital. As per the concept of sensitivity analysis, it could be studied
that how changes in the target variable could be seen as a result of changes taking place in input
variable. Therefore, here the NPV is the target variable while the rate at which cash flows are
discounted would be taken as input variable. If the rate of discounting will move upward that is,
any value over and above the 8% discounting rate, there would be corresponding changes
noticed in NPVs of different options in terms of decreasing patterns while if the discounting rate
would be fall taking any value less than the 8% rate of discounting, the resulting NPVs of
different options would be higher than the current state (Batra and Agrawal, 2018). This changes
taking place in NPVs due to changes in WACC or discounting rate is known as sensitiveness of
variables to one another and financial manager carries out continuous changes in one variable to
see its impact over another variable in order to determine the best or profitable state of
operations. This process undertaken by financial manager to arrive at the most profitable option
is known as sensitivity analysis.
5. Recommended course of action
For Catanza to ensure they are proceeding with the attractive investment option, the
recommended course of action is identified as GPS prototype for the purpose of development of
commercial robotic lawn management tools and equipment despite of company’s strategy in
following less risky strategy (Zhang and et.al., 2020). However, the EW has been favoured on
several grounds such as requiring less capital to be invested at initial stage, indicating greater
probability of securing success at initial prototype stage, shorter timelines for production and
tooling and faster in paying back initial cost of investment. On analysing data pertaining through
decision making framework that is, decision tree analysis and sensitivity analysis, the outputs are
such favouring GPS prototype over Electric wire (Mishra and et.al., 2020). Accordingly, GPS
model would be a recommended course of action due to having greater likelihood of securing
financial success for Catanza plc.
Question 2
The problem faced by Catanza Technologies is to select the appropriate model for its
production of new product prototype such as Electric Wire and GPS model. Selection of best,
suitable and appropriate model is a biggest problem that is faced by the decision-maker of
Catanza Technology company for their new automatic robotic lawn mower (Rimbaud and et.al.,
2019). The approach used by company to analyse its two option and make decision is decision-
tree including net present value and sensitive analysis. The strength and limitations of the
analysis in the context of problem faced by Catanza Technologies are as follows:
Strength of the Analysis
There is basically various strength associated with the analysis. Firstly, it is identified
from the analysis that the marketing team of Catanza Technologies has provided with the
customer targets, demographics and key product attributes. This is basically one of the most
significant factor which is consider as a strength for the above analysis. Further, the use of
decision tree technique is also a strength of the above analysis. Decision-tree is one of the most
powerful and popular tool for predication and classification of different situation including
probabilities. It is basically a flow chart that helps the company such as Catanza Technology to
understand the possible outcome of the option based on different situation and select the best
outcome.
The strength of the above analysis is that, the decision-tree decision technique based on
cost have been used by the Catanza Technologies in order to reach to ultimate decision based on
outcome. For example, on the basis of decision tree including NPV analysis, it is recommended
to Catanza Technologies to select GPS prototype or model rather than EW model. Another
strength of the analysis is that the management team of Catanza Technology has also provided
with the data regarding experience based, financial forecast and experience based project costing,
timeline as well as partnership data (Rimbaud and et.al., 2019). This is also one of the strength of
the analysis with the help of which Catanza company able to select or chose best technology out
of the two technology such as EW and GPS.
⊘ This is a preview!⊘
Do you want full access?
Subscribe today to unlock all pages.
Trusted by 1+ million students worldwide
1 out of 18
Related Documents


Your All-in-One AI-Powered Toolkit for Academic Success.
+13062052269
info@desklib.com
Available 24*7 on WhatsApp / Email
![[object Object]](/_next/static/media/star-bottom.7253800d.svg)
Unlock your academic potential
Copyright © 2020–2026 A2Z Services. All Rights Reserved. Developed and managed by ZUCOL.