Catanza Technologies Case Study
VerifiedAdded on 2023/06/11
|24
|5888
|370
AI Summary
This report discusses the decision-making process of Catanza Technologies in selecting the optimal choice between Electric Wire and GPS for the development of a new robotic lawnmower. The report uses decision tree analysis, Net Present Value technique, and Sensitivity analysis to recommend the most suitable course of action. The report also highlights the strengths and limitations of the analysis and recommends additional investigation to improve the decision-making process.
Contribute Materials
Your contribution can guide someone’s learning journey. Share your
documents today.

Latika Salian
Catanza Technologies
Case Study
Catanza Technologies
Case Study
Secure Best Marks with AI Grader
Need help grading? Try our AI Grader for instant feedback on your assignments.

Title
Student ID Number
Unit Code GSB014
Unit Name Business Decision Making and Analysis
Assignment Title Apply Decision Analysis Technique
Facilitator
Word Length 3500
Word Count
Due Date
Date of submission
Intellectual Property Statement
By checking the box below, I certify that this is my own work. All statements and sources are carefully
acknowledged, sourced, and cited and I accept full responsibility for the contents contained in the
assignments. None of the material in this assignment has been submitted in another course or another
assignment. No material has been copied, borrowed, or taken from a source that has not been
accurately acknowledged.
☒ Agree
Date:
Executive Summary
This report is based on Catanza plc who is proposing to develop a new robotic lawnmover
whose code in RLM19. There are two options available with Catanza for the development of
prototype that is, EW or Electric Wire and GPS or Global Positioning System. Accordingly, to
determine an optimal choice, analysis has been done by adopting several decision making
techniques such as decision tree analysis, Net Present Value technique and Sensitivity analysis.
On the basis of these analytical technique, a most suitable or profitable course of action has been
recommended. Furthermore, the review of different alternatives associated with recommended
options has been done along with highlighting the strength of the process which facilitates the
use of decision-making techniques such as expertise of marketing team, availability of
probabilities for several future events, etc. Alongside, several limitations of the process have
been identified with reference to potential additional research & collection of data to facilitate
better decision-making process.
With the help of analysis performed, it has been determined that EW has characteristics
such as low risk tolerance, lower initial cost of investment and reaching market quicker. On the
other hand, with the help of data analysis performed through decision making framework such as
NPV and decision tree analysis, GPS was found to be a preferred option because of higher
potential in generating revenue despite of the fact that it leads to additional risks. The reports end
with the recommendation where it has been stated that Catanza should go for GPS in case of
high risk appetite while the company should go for EW in case of low risk appetite. If the risk
appetite was found to be moderate, then additional research is needed to choose the best
alternative.
Table of Contents
EXECUTIVE SUMMARY.............................................................................................................2
INTRODUCTION...........................................................................................................................4
Question 1........................................................................................................................................4
Background and situational analysis...........................................................................................4
Methodology................................................................................................................................5
Key Facts and Assumptions.........................................................................................................5
Decision Tree Analysis................................................................................................................7
Net Present Value........................................................................................................................8
Decision tree indicating choices and decision made on the basis of NPVs.................................8
4. Sensitivity analysis as an alternative decision making technique...........................................9
5. Recommended course of action.............................................................................................10
Question 2......................................................................................................................................10
Strength of the Analysis.............................................................................................................10
Limitation of the analysis..........................................................................................................11
CONCLUSION..............................................................................................................................12
RECOMMENDATION.................................................................................................................13
Appendix........................................................................................................................................16
Secure Best Marks with AI Grader
Need help grading? Try our AI Grader for instant feedback on your assignments.

Table of Abbreviations and Acronyms
Abbreviation/Acronyms Explanation
Abbreviation/Acronyms Explanation

INTRODUCTION
Decision-making process is basically a process of making choices by identifying and
analysing different alternative or course of action via using the various decision-making
techniques (Gao and et.al., 2021). The present report is based on Catanza Technologies which
was founded in the year 2002 in Brisbane. In the year 2008, the company has expanded its firm
into industrial robots and in the year 2014 the company have launched a commercial grade
robotic floor cleaner. Now, in the year 2019, Catanza Technology in order to develop its
production prototype based on two approaches such as Electric Wire (EW) perimeter or GPS and
sensing navigation. The report will use decision tree to decide and recommend which course of
action out of the two alternative approach Catanza Technology have to adopt. Further, the report
will also cover the strength and limitation of the analysis in the context of the problem faced by
Catanza Technologies. The problem faced by Catanza Technology is such that the decision taken
by company is not appropriate, suitable and profitable to company. Lastly, the report will also
recommend the information and investigation that they can further needed in order to improve
their analysis and decision-making process.
Question 1
Background and situational analysis
Catanza Technologies basically offer three product type such as industrial sensor, industrial
robots and robotic floor sensor in the year 2019. But due to the decline in the automotive
manufacturers from Australia by 2017 they have decided to transitioned to other application and
technology (Leite and et.al., 2022). It means the development of commercial robotic lawn
management tools and equipment’s. In order to develop the commercial robotic lawn
management tools and equipment and resolve the problem of decline in automotive
manufacturer, the company is seeking to adopt one out of the two approach such as Electric Wire
and GPS. Catanza has invested around $1.65 million in the market research and development at
initial stage. This is an initial sunk cost which is helpful for determining the development of this
new product.
On the basis of turnover of Catanza Technology by the product type it is identified that the
overall performance of Industrial sensor product of company was better than the other two
products. It is estimated that the demand of the Automatic Robotic Lawn Mower will be high in
Paraphrase This Document
Need a fresh take? Get an instant paraphrase of this document with our AI Paraphraser
the upcoming years because it saves time of the people and helpful in taking care of grass. The
company is having two technology option to develop this commercial automatic lawn mower
such as Electric Wire or GPS. Not only that, the chief engineer of Catanza Technology has
estimated the probabilities related to development strategies and production timeline which also
used in the option analysis and decision-making. Now, the most significant problem faced by
Catanza Technology is to select which option out of the two alternative in order to develop or
produce commercial robotic lawn mowers.
Methodology
In order to analyse the optimal option for Catanza Technology, both qualitative and
quantitative data will be performed using the appropriate decision-making techniques. Basically,
the decision tree including NPV and sensitive analysis technique or approach of decision will be
used in order to resolve the problem and select the best, low cost and suitable technology out of
the two approach. Decision-tree basically a non-parametric supervised learning method used to
make decision on the basis of different trees. It is one of the simplest method to understand and
interpret the result. It also has the ability to handle multi-output problems. A decision-tree model
is very intuitive and easy technique to take decision as it requires less effort for data preparation
during pre-processing (Meramo-Hurtado and González-Delgado, 2020) . Further, the sensitive
analysis approach is also used to solve the problem faced by Catanza Technology and identify
the appropriate course of action. It is because sensitive analysis helps the decision maker, to
make better decision based on different range of outcome. Further, Catanza Technology
estimated weighted average cost of capital is 8% which is also taken and has been applied for the
purpose of Net Present Value Calculation for each of the eight branches.
Key Facts and Assumptions
Key Facts:
The development of product is commenced from the period January 2019.
The useful life of both technologies such as EW and GSP is 5 years from 2019. It means
the life will end in December 2025.
It is also analysed that at the end of the project life, the residual value of the project is nil.
Further, it is also identified that Catanza Technologies used calendar year not July to June
year.
In order to make decision, the current report has also considered to ignore tax.
The cost of capital to compute the net present value of cash flows is taken as 8%. It is
because it is given in the Catanza case study that the Catanza’s WACC is 8%.
Lastly, it is identified that all cash flows occur at the end of each year.
Assumptions:
The following assumptions has been taken regarding the two option such as Electric Wire
Model and GPS model of commercial automatic robotic lawn mower of Catanza case study, data
as well decision analysis:
It is assumed that the Catanza appetite to risk is low. It is because the cost of
development of prototype is high, entering into new and untested market and existence of
sunk cost capital investment.
Further, it is also assumed that the external impact on other business units of Catanza
such as industrial sensors, industrial robots etc. was nil. This might jeopardise funding or
resources allocation to the Automatic mower venture (Bjerkan and Seter, 2019).
It is also assumed in the current case study such as Catanza is such that the consumers
will accept the new Automatic mower product of Catanza within the new market. The
impact of which the success of Catanza in robotic vacuumed is transferable to the mower
market without any difficulty.
It is also assumed that the Catanza is the first company that will fill the autonomous
mower market which indicate that the company is in development phase.
In addition, it is also identified that there was a delay in the launching of new automatic
mower products which might leads to the gapping of same products by the competitors. It
means this delay may increase the chances that the same product might be develop by
other competitors beating Catanza to launch the same in order to gain competitive
advantage over Catanza.
It is also assumed that there was no lack of shortage of materials such as computer chips,
moulded plastics as well as the metals which is required for the development of
autonomous mower product.
It is also assumed that the marketing team of Catanza Technologies has provided with the
customer targets, demographics and key product attributes. This is basically one of the
most significant factor which is consider as a strength for the above analysis.
The change in climate does not affect the market where Catanza are operating and also
the same has been already consider with the forecasted data (deSouza and et.al., 2019).
Lastly, it is also assumed that the electric wire prototype if develop early i.e., within the
half year than it will further leads to the $3 million sales in the case of good market
condition and $1 million sales in the case of poor market condition.
Decision Tree Analysis
Decision tree is one of the best technique to undertake complex and multi-stage decision
with the help of which the decision-maker able to understand the structure of the problems. It
means the decision-tree helps the decision-maker to develop the clear view of the problem
structure with the help of which possible course of action has been easily selected. The below
diagram is the decision tree analysis of the Catanza new products Automatic Mower launching
with the alternative solutions in order to solve a specific problem (Heen and et.al., 2021). The
problem faced by Catanza Technologies is that whether they should develop commercial robotic
lawn management tools and equipment or not. In order to solve this problem of Catanza
Technology, the Decision Tree analysis has used (see diagram below). In the decision-tree
analysis, different solutions such as EW model and GPS model has been represent with the help
of which the given problem are solved.
Not only that, the different probabilities of good condition and bad condition has been also
applied in the decision tree analysis in order to gain the most preferable solution. The reason
behind the selection of decision tree analysis in the present scenario is because it is easy to use,
flexible as compared to other techniques which require quantitative and comprehensive tools. It
is one of the best predictive model thus consider for the Catanza case study. This helps the
decision-maker of Catanza Technologies to make decision on the basis of the outcome or result
where the total cost require to develop the new product is lowest would be consider. Basically,
the below decision have not considered the profitability and uses only cost in the decision tree-
analysis. This help in decision by identifying the total cost required at each alternative or course
of action.
Secure Best Marks with AI Grader
Need help grading? Try our AI Grader for instant feedback on your assignments.
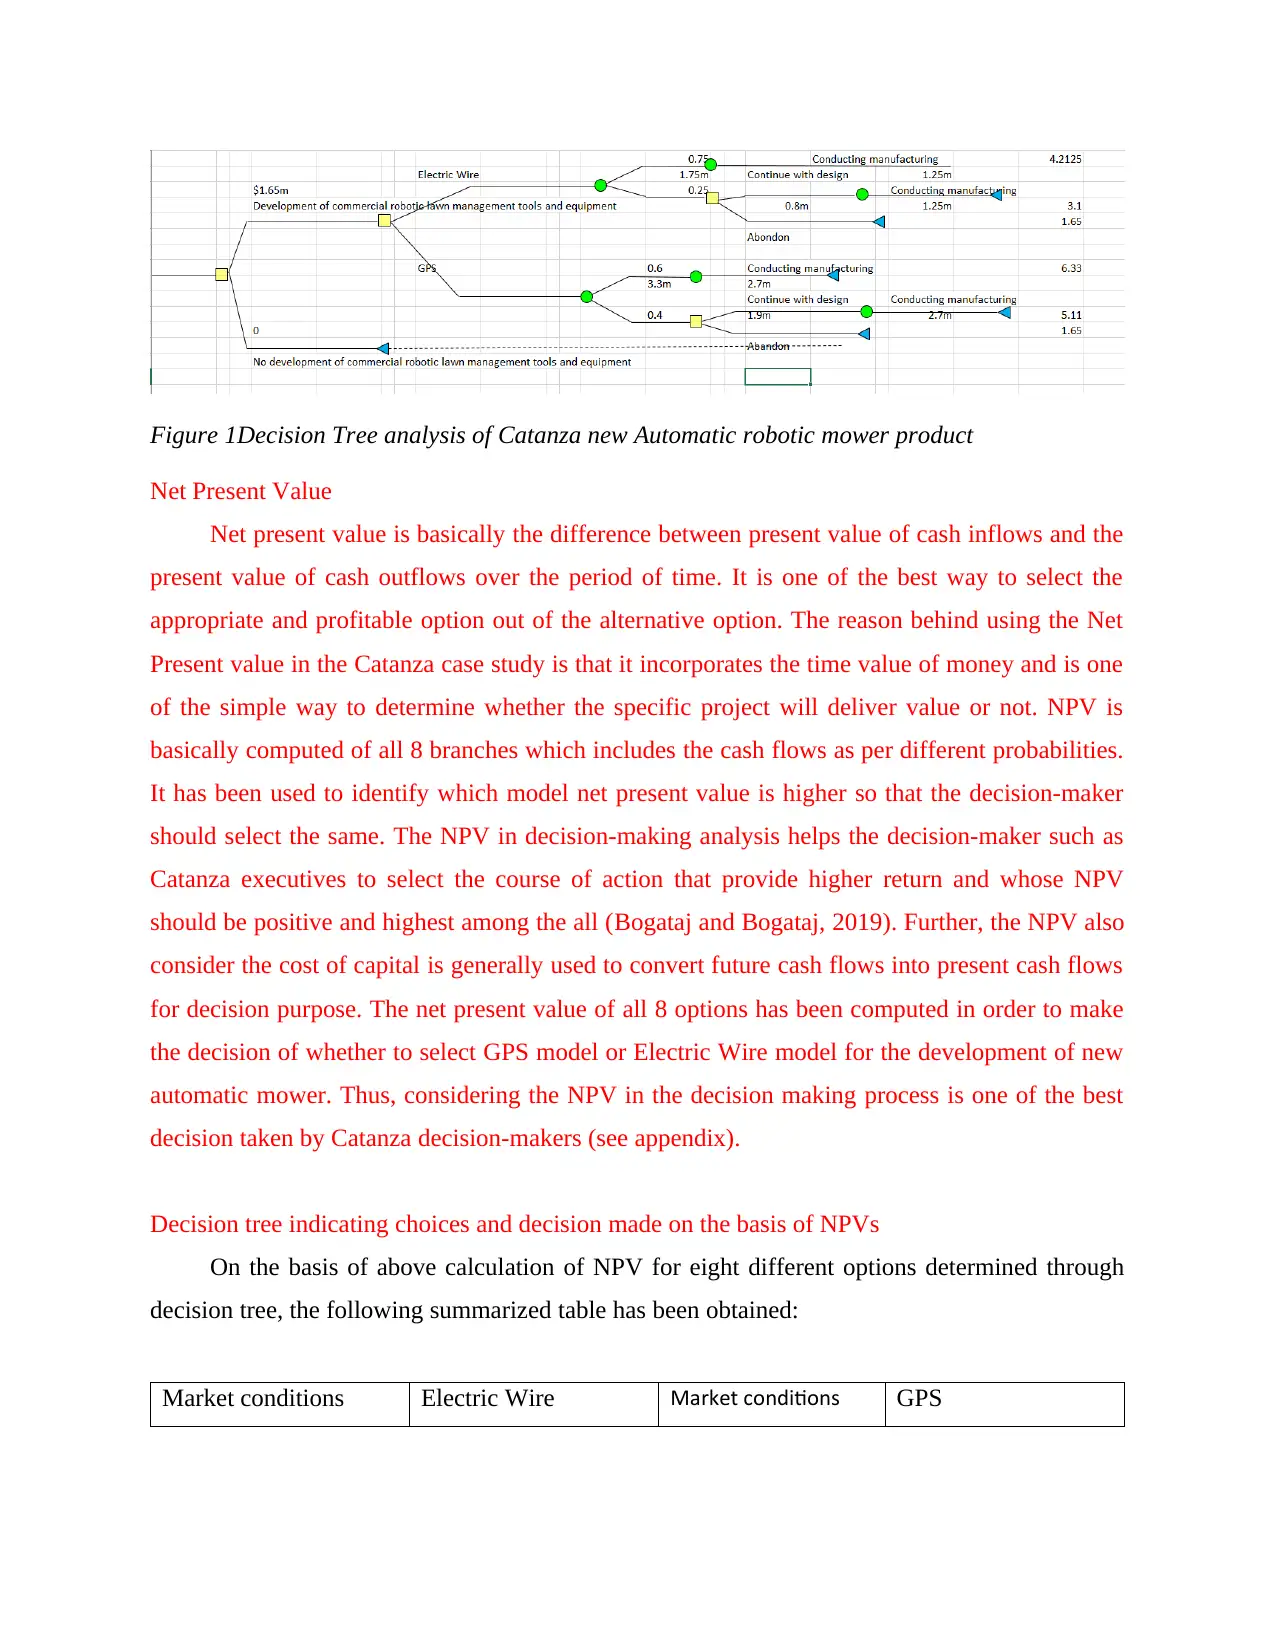
Figure 1Decision Tree analysis of Catanza new Automatic robotic mower product
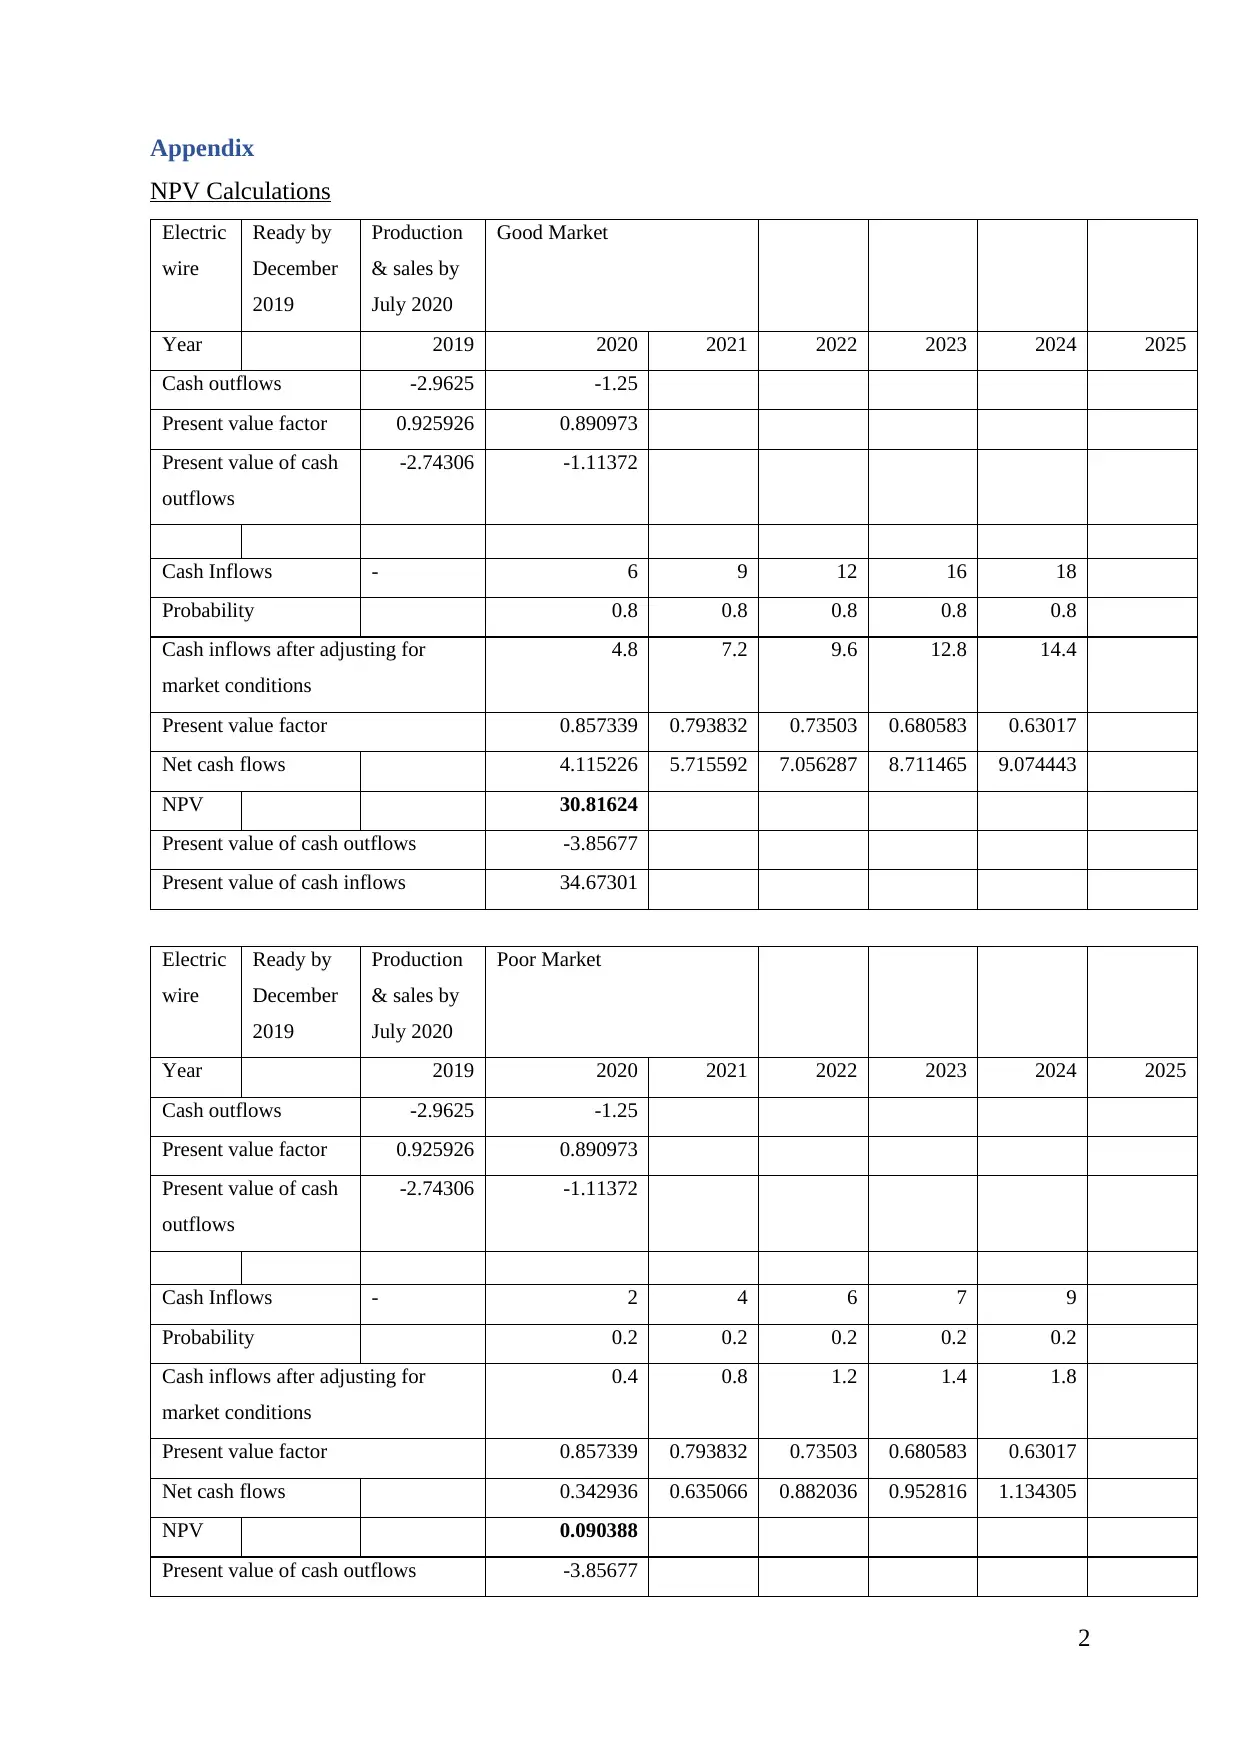
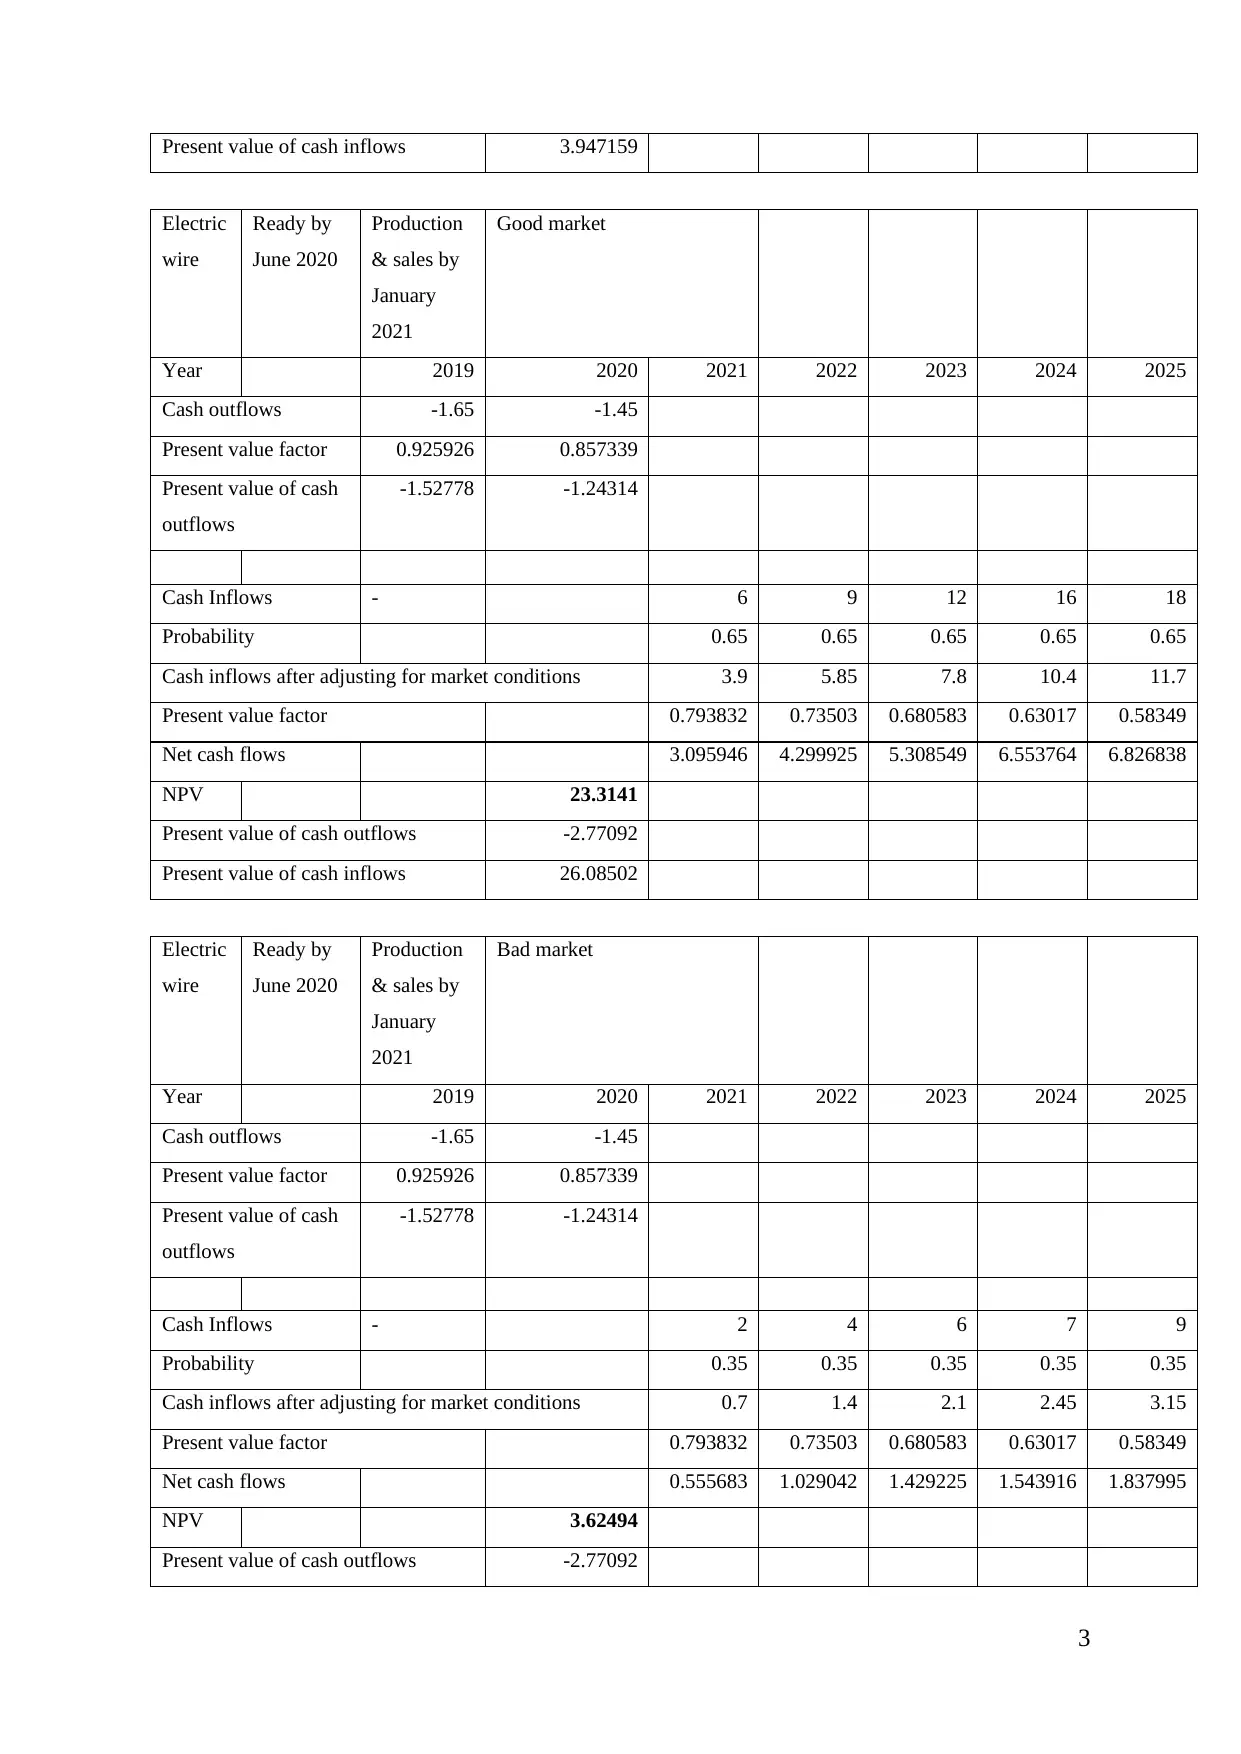
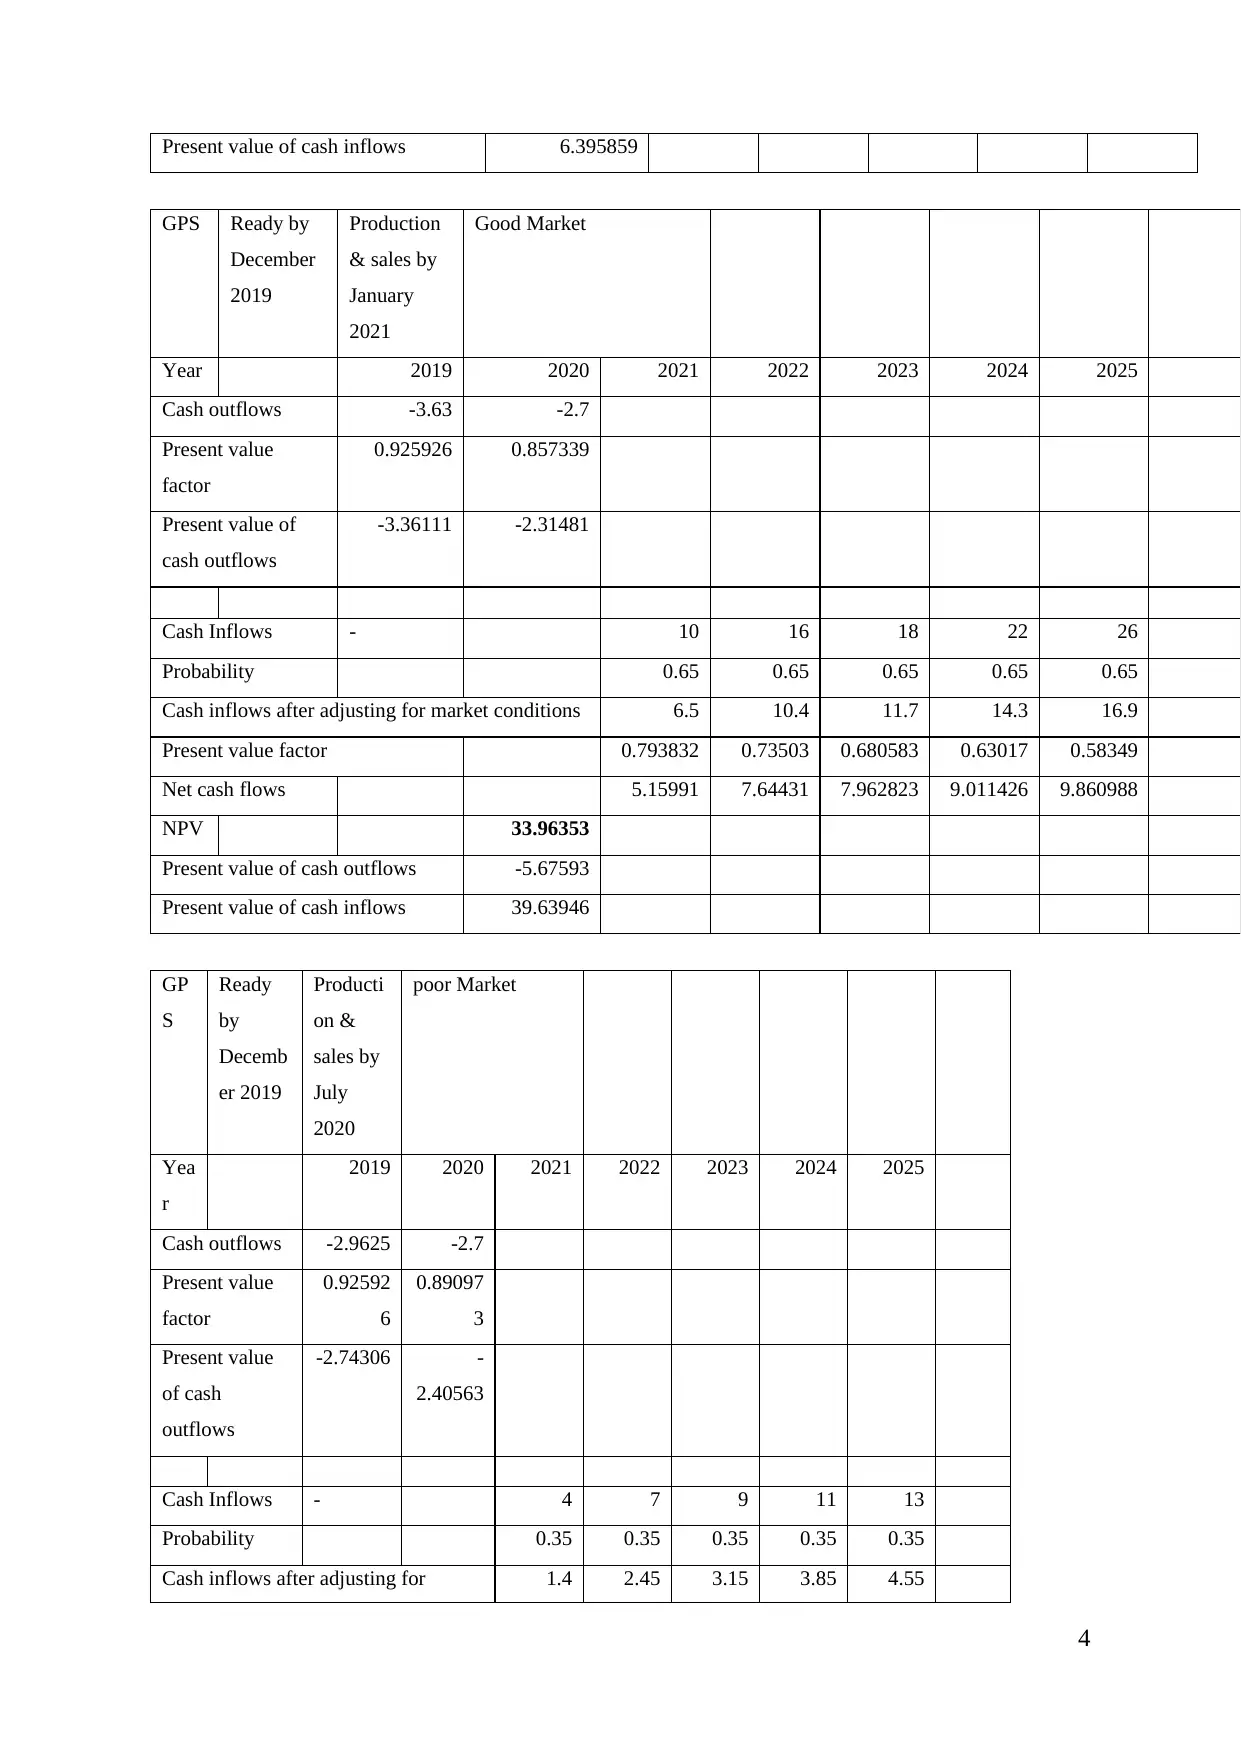
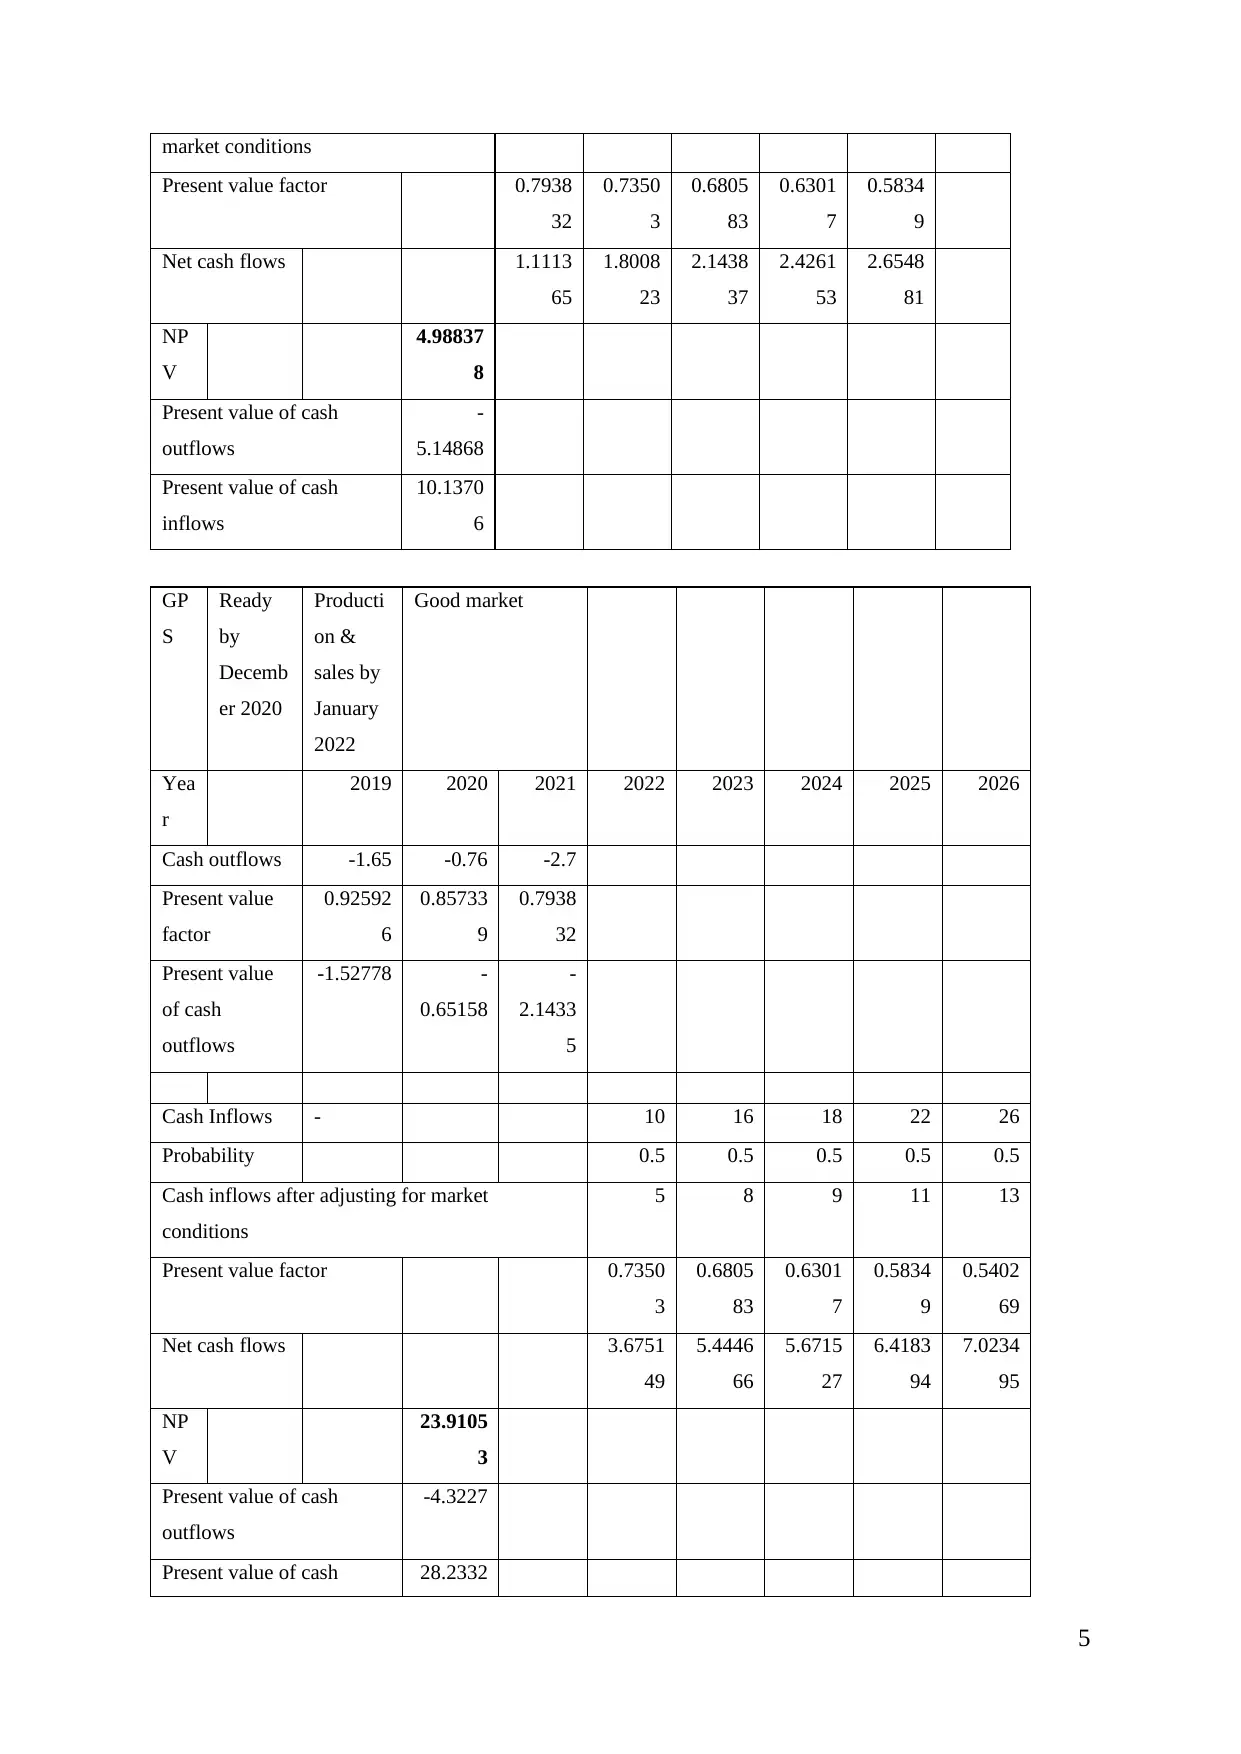
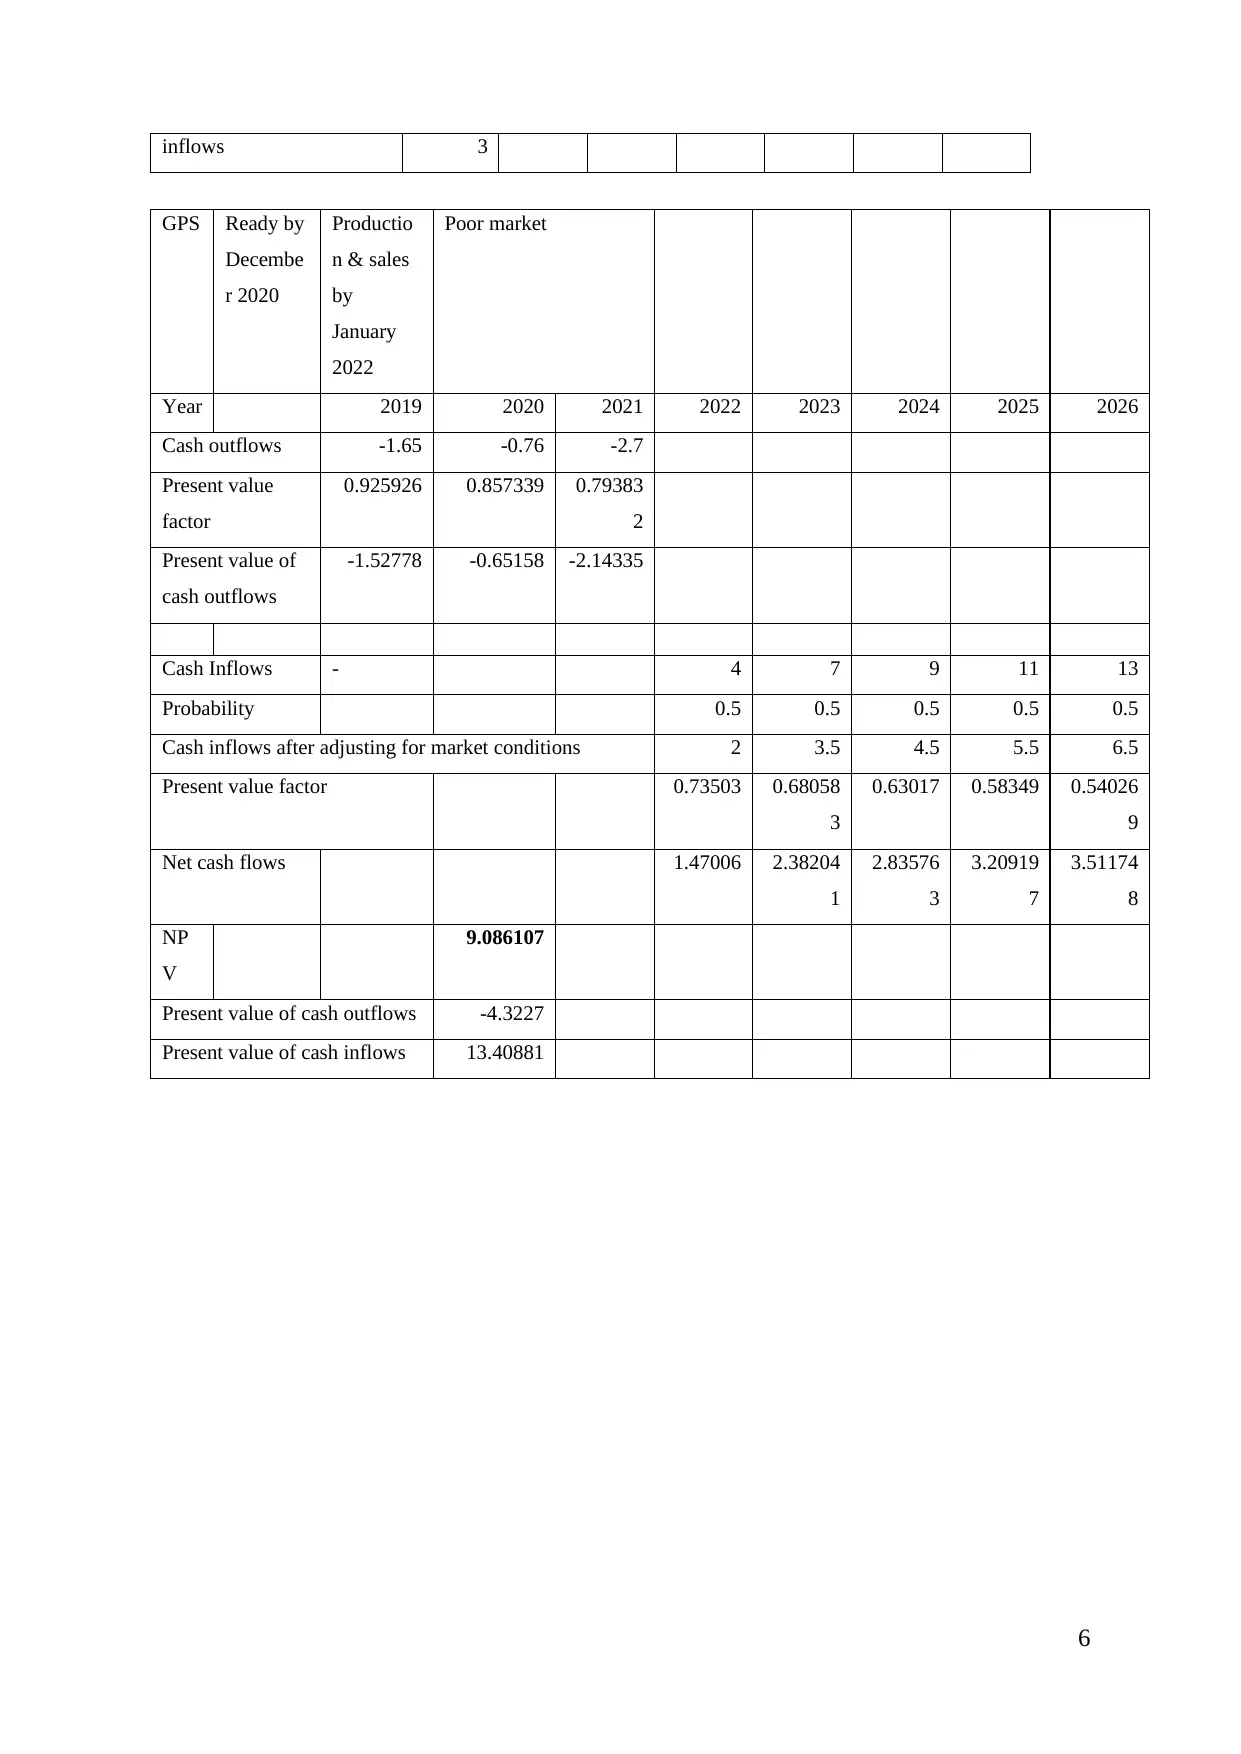
Net Present Value
Net present value is basically the difference between present value of cash inflows and the
present value of cash outflows over the period of time. It is one of the best way to select the
appropriate and profitable option out of the alternative option. The reason behind using the Net
Present value in the Catanza case study is that it incorporates the time value of money and is one
of the simple way to determine whether the specific project will deliver value or not. NPV is
basically computed of all 8 branches which includes the cash flows as per different probabilities.
It has been used to identify which model net present value is higher so that the decision-maker
should select the same. The NPV in decision-making analysis helps the decision-maker such as
Catanza executives to select the course of action that provide higher return and whose NPV
should be positive and highest among the all (Bogataj and Bogataj, 2019). Further, the NPV also
consider the cost of capital is generally used to convert future cash flows into present cash flows
for decision purpose. The net present value of all 8 options has been computed in order to make
the decision of whether to select GPS model or Electric Wire model for the development of new
automatic mower. Thus, considering the NPV in the decision making process is one of the best
decision taken by Catanza decision-makers (see appendix).
Decision tree indicating choices and decision made on the basis of NPVs
On the basis of above calculation of NPV for eight different options determined through
decision tree, the following summarized table has been obtained:
Market conditions Electric Wire Market conditions GPS
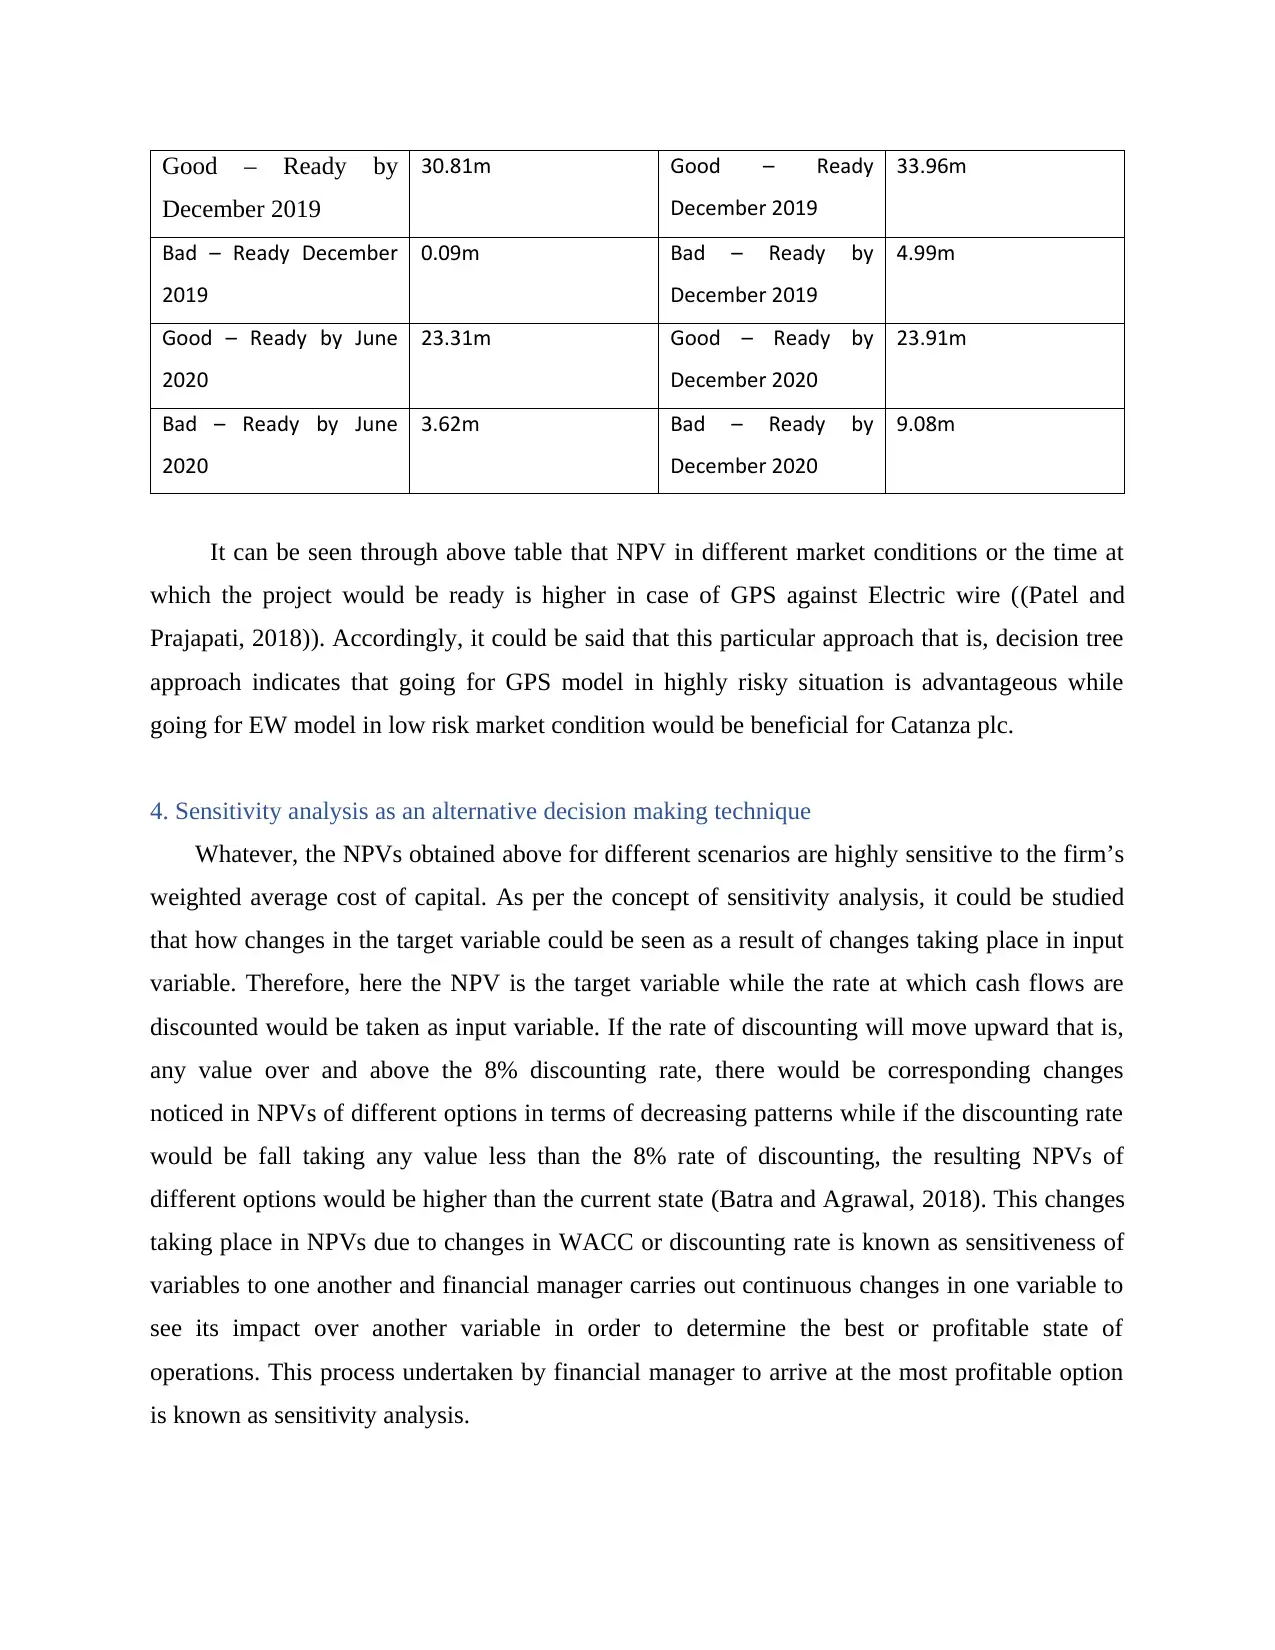
Good – Ready by
December 2019
30.81m Good – Ready
December 2019
33.96m
Bad – Ready December
2019
0.09m Bad – Ready by
December 2019
4.99m
Good – Ready by June
2020
23.31m Good – Ready by
December 2020
23.91m
Bad – Ready by June
2020
3.62m Bad – Ready by
December 2020
9.08m
It can be seen through above table that NPV in different market conditions or the time at
which the project would be ready is higher in case of GPS against Electric wire ((Patel and
Prajapati, 2018)). Accordingly, it could be said that this particular approach that is, decision tree
approach indicates that going for GPS model in highly risky situation is advantageous while
going for EW model in low risk market condition would be beneficial for Catanza plc.
4. Sensitivity analysis as an alternative decision making technique
Whatever, the NPVs obtained above for different scenarios are highly sensitive to the firm’s
weighted average cost of capital. As per the concept of sensitivity analysis, it could be studied
that how changes in the target variable could be seen as a result of changes taking place in input
variable. Therefore, here the NPV is the target variable while the rate at which cash flows are
discounted would be taken as input variable. If the rate of discounting will move upward that is,
any value over and above the 8% discounting rate, there would be corresponding changes
noticed in NPVs of different options in terms of decreasing patterns while if the discounting rate
would be fall taking any value less than the 8% rate of discounting, the resulting NPVs of
different options would be higher than the current state (Batra and Agrawal, 2018). This changes
taking place in NPVs due to changes in WACC or discounting rate is known as sensitiveness of
variables to one another and financial manager carries out continuous changes in one variable to
see its impact over another variable in order to determine the best or profitable state of
operations. This process undertaken by financial manager to arrive at the most profitable option
is known as sensitivity analysis.
December 2019
30.81m Good – Ready
December 2019
33.96m
Bad – Ready December
2019
0.09m Bad – Ready by
December 2019
4.99m
Good – Ready by June
2020
23.31m Good – Ready by
December 2020
23.91m
Bad – Ready by June
2020
3.62m Bad – Ready by
December 2020
9.08m
It can be seen through above table that NPV in different market conditions or the time at
which the project would be ready is higher in case of GPS against Electric wire ((Patel and
Prajapati, 2018)). Accordingly, it could be said that this particular approach that is, decision tree
approach indicates that going for GPS model in highly risky situation is advantageous while
going for EW model in low risk market condition would be beneficial for Catanza plc.
4. Sensitivity analysis as an alternative decision making technique
Whatever, the NPVs obtained above for different scenarios are highly sensitive to the firm’s
weighted average cost of capital. As per the concept of sensitivity analysis, it could be studied
that how changes in the target variable could be seen as a result of changes taking place in input
variable. Therefore, here the NPV is the target variable while the rate at which cash flows are
discounted would be taken as input variable. If the rate of discounting will move upward that is,
any value over and above the 8% discounting rate, there would be corresponding changes
noticed in NPVs of different options in terms of decreasing patterns while if the discounting rate
would be fall taking any value less than the 8% rate of discounting, the resulting NPVs of
different options would be higher than the current state (Batra and Agrawal, 2018). This changes
taking place in NPVs due to changes in WACC or discounting rate is known as sensitiveness of
variables to one another and financial manager carries out continuous changes in one variable to
see its impact over another variable in order to determine the best or profitable state of
operations. This process undertaken by financial manager to arrive at the most profitable option
is known as sensitivity analysis.
5. Recommended course of action
For Catanza to ensure they are proceeding with the attractive investment option, the
recommended course of action is identified as GPS prototype for the purpose of development of
commercial robotic lawn management tools and equipment despite of company’s strategy in
following less risky strategy (Zhang and et.al., 2020). However, the EW has been favoured on
several grounds such as requiring less capital to be invested at initial stage, indicating greater
probability of securing success at initial prototype stage, shorter timelines for production and
tooling and faster in paying back initial cost of investment. On analysing data pertaining through
decision making framework that is, decision tree analysis and sensitivity analysis, the outputs are
such favouring GPS prototype over Electric wire (Mishra and et.al., 2020). Accordingly, GPS
model would be a recommended course of action due to having greater likelihood of securing
financial success for Catanza plc.
Question 2
The problem faced by Catanza Technologies is to select the appropriate model for its
production of new product prototype such as Electric Wire and GPS model. Selection of best,
suitable and appropriate model is a biggest problem that is faced by the decision-maker of
Catanza Technology company for their new automatic robotic lawn mower (Rimbaud and et.al.,
2019). The approach used by company to analyse its two option and make decision is decision-
tree including net present value and sensitive analysis. The strength and limitations of the
analysis in the context of problem faced by Catanza Technologies are as follows:
Strength of the Analysis
There is basically various strength associated with the analysis. Further, the use of
decision tree technique is also a strength of the above analysis. It is also identified from the
analysis that the marketing team of Catanza Technologies has provided with the customer
targets, demographics and key product attributes. This is basically one of the most significant
factor which is consider as a strength for the above analysis. Decision-tree is one of the most
powerful and popular tool for predication and classification of different situation including
probabilities. It is basically a flow chart that helps the company such as Catanza Technology to
Paraphrase This Document
Need a fresh take? Get an instant paraphrase of this document with our AI Paraphraser
understand the possible outcome of the option based on different situation and select the best
outcome.
The strength of the above analysis is that, the decision-tree decision technique based on
cost have been used by the Catanza Technologies in order to reach to ultimate decision based on
outcome. For example, on the basis of decision tree including NPV analysis, it is recommended
to Catanza Technologies to select GPS prototype or model rather than EW model. Another
strength of the analysis is that the management team of Catanza Technology has also provided
with the data regarding experience based, financial forecast and experience based project costing,
timeline as well as partnership data (Rimbaud and et.al., 2019). This is also one of the strength of
the analysis with the help of which Catanza company able to select or chose best technology out
of the two technology such as EW and GPS.
Also, the qualitative as well as the quantitative data has been used in the sensitive
analysis. In the sensitive analysis, the multiple scenario such as eight scenarios has been
considering along with its Net present value calculation is a strength of the above analysis that
result into selection of appropriate technology or prototype. It is because the calculation of NPV
is best for increasing the relevance of today’s economic value. Further, strength of the above
analysis is that the forecasted revenue and probability figure which was selected or estimated by
the organization is basically based on previous success in untested markets. Also, Catanza
Technologies has launched product in the new market which has enhanced their ability to
understand the untested and new market without any much difficulty. This is one of the biggest
strength of analysis that has been result into the success of the robotic vacuum.
Limitation of the analysis
The limitation of the above analysis includes low data on Catanza’s competitors as well as
the technology they possess. The data regarding the competitor of Catanza and what technology
is not enough (Leite and et.al., 2022). The impact of which the competitive analysis has not been
performed in the above analysis. The competition analysis plays vital role in identifying the
technology uses by competitors, products and service they offer to customer and how this will
impact Catanza revenue and profitability. But due to the lack of information, the company unable
to analyse the same which is one of the limitation of above analysis.
Another limitation of the analysis is such that there is a lack of evidence presented in the
case study to suggest that the data has rigours and has not been influenced by the constraints
such as bias. The confirmation bias is a limitation of the internal case study which is basically
occur existing beliefs that the adaptability of sensor technology in order to succeed in the robotic
vacuum is transferable to mower products (Leite and et.al., 2022). The over-confidence and
existing belief of the decision-maker may affect the overall project and also influence the same
in the wrong direction. Further, the biggest risk that have influenced the present case study data
is dysfunctional decision.
Lastly, the another limitation of the analysis is that they have prepare decision-tree based
on the cost analysis only. It means the above decision-tree has consider only cost not profitability
in order to identify the different situation and its outcome. The impact of which the outcome and
result of the decision-tree are high biased. The data of Catanza company is basically formulated
within the internal framework of the company thus it considers as one of the major limitation of
the above analysis. The limited data on the background of staffs involved in the project is
limitation of the analysis.
CONCLUSION
After summing up the above information and using the decision tree analysis and Sensitive
analysis, it has been concluded that GPS prototype and technology model is optimal and logical
option they should opt for their RML19 product. This is basically concluded using the decision-
making technique such as decision-tree and sensitive analysis. Further, the report has also stated
the strength of the analysis along with the limitation of the analysis such as bias, lack of data etc.
However, due to lack of information regarding the market risk and staffs included in the current
project, providing the optimal decision on the two technology model to Catanza is clear cut.
Thus, the current project requires additional research on the other aspects as well such as market
risk, staff information, more internal as well as external data etc. in order to achieve or attain the
most optimal decision.
RECOMMENDATION
The decision for the above case study has been taken by the Executive team of Catanza
Technologies. They want to take the decision on whether to opt for EW model or GPS model in
order to develop the new Automatic robotic mower product. The group decision-making is
helpful for taking the most appropriate and profitable decision on the basis different people ideas
and thoughts. The scenario planning helps the executive team of Catanza to understand the
different scenario of development of new product in untested market and the result of the same
(Marchioni and Magni, 2018). On the basis of above information, it is analysed there is a lack of
uncertainty in the analysis. Because of this uncertainty of the analysis, the following action is
recommendable to Catanza Technology:
Firstly, it is recommended to the organization that they should proceed or opt for the GPS
model as their NPV is high as compared to EW model. This is basically recommended to
Catanza in case if they appetite for the risk is high.
However, in case of low risk condition of the company it is recommended to Catanza that
they should opt for the EW option.
Further to achieve or make more optimal decision it is advisable to the company such as
Catanza that they should conduct additional research regarding the report. It means it is
recommended to Catanza that they should consider low cost as well as high profitability
criteria in their decision-tree in order to get more accurate result (Marchioni and Magni,
2018).
It is also recommendable to Catanza Technologies is such that they have to include additional
information and data regarding their competitors, the product offers by their competitors and
the technology they used. It is because competitive analysis is most helpful for making the
accurate decision.
Lastly, in order to provide more evidence in the decision-making process, it is also
recommendable to Catanza that they should also opt for additional analysis method such as
SMART analysis, Monte Carlo Simulation and analytics Hierarchy process. This are
Secure Best Marks with AI Grader
Need help grading? Try our AI Grader for instant feedback on your assignments.

basically alternative decision-making techniques of method which is helpful for more
accurate decision (Abdelhady, 2021).
accurate decision (Abdelhady, 2021).
REFERENCES
Books and journals
Abdelhady, S., 2021. Performance and cost evaluation of solar dish power plant: sensitivity
analysis of levelized cost of electricity (LCOE) and net present value
(NPV). Renewable Energy. 168. pp.332-342.
Batra, M. and Agrawal, R., 2018. Comparative analysis of decision tree algorithms.
In Nature inspired computing (pp. 31-36). Springer, Singapore.
Bjerkan, K. Y. and Seter, H., 2019. Reviewing tools and technologies for sustainable ports:
Does research enable decision making in ports? Transportation Research Part D:
Transport and Environment. 72. pp.243-260.
Bogataj, D. and Bogataj, M., 2019. NPV approach to material requirements planning theory–
a 50-year review of these research achievements. International Journal of Production
Research. 57(15-16). pp.5137-5153.
deSouza, N. M. and et.al., 2019. Validated imaging biomarkers as decision-making tools in
clinical trials and routine practice: current status and recommendations from the
EIBALL* subcommittee of the European Society of Radiology (ESR). Insights into
Imaging. 10(1). pp.1-16.
Gao, W., and et.al., 2021. A study on the cyclist head kinematic responses in electric-bicycle-
to-car accidents using decision-tree model. Accident Analysis & Prevention. 160.
p.106305.
Heen, A. F. and et.al., 2021. A framework for practical issues was developed to inform
shared decision-making tools and clinical guidelines. Journal of clinical
epidemiology. 129. pp.104-113.
Leite, G. D. N. P., and et.al., 2022. Economic and sensitivity analysis on wind farm end-of-
life strategies. Renewable and Sustainable Energy Reviews. 160. p.112273.
Marchioni, A. and Magni, C. A., 2018. Investment decisions and sensitivity analysis: NPV-
consistency of rates of return. European Journal of Operational Research. 268(1).
pp.361-372.
Marchioni, A. and Magni, C. A., 2018. Investment decisions and sensitivity analysis: NPV-
consistency of rates of return. European Journal of Operational Research. 268(1).
pp.361-372.
Meramo-Hurtado, S. I. and González-Delgado, A. D., 2020. Application of techno-economic
and sensitivity analyses as decision-making tools for assessing emerging large-scale
technologies for production of chitosan-based adsorbents. ACS omega. 5(28).
pp.17601-17610.
Mishra, S., and et.al., 2020. Performance evaluation of a proposed machine learning model
for chronic disease datasets using an integrated attribute evaluator and an improved
decision tree classifier. Applied Sciences. 10(22). p.8137.
Patel, H. H. and Prajapati, P., 2018. Study and analysis of decision tree based classification
algorithms. International Journal of Computer Sciences and Engineering. 6(10).
pp.74-78.
Rimbaud, L., and et.al., 2019. Improving management strategies of plant diseases using
sequential sensitivity analyses. Phytopathology. 109(7). pp.1184-1197.
Zhang, J., and et.al., 2020, October. Zero knowledge proofs for decision tree predictions and
accuracy. In Proceedings of the 2020 ACM SIGSAC Conference on Computer and
Communications Security (pp. 2039-2053).
1
Paraphrase This Document
Need a fresh take? Get an instant paraphrase of this document with our AI Paraphraser
Appendix
NPV Calculations
Electric
wire
Ready by
December
2019
Production
& sales by
July 2020
Good Market
Year 2019 2020 2021 2022 2023 2024 2025
Cash outflows -2.9625 -1.25
Present value factor 0.925926 0.890973
Present value of cash
outflows
-2.74306 -1.11372
Cash Inflows - 6 9 12 16 18
Probability 0.8 0.8 0.8 0.8 0.8
Cash inflows after adjusting for
market conditions
4.8 7.2 9.6 12.8 14.4
Present value factor 0.857339 0.793832 0.73503 0.680583 0.63017
Net cash flows 4.115226 5.715592 7.056287 8.711465 9.074443
NPV 30.81624
Present value of cash outflows -3.85677
Present value of cash inflows 34.67301
Electric
wire
Ready by
December
2019
Production
& sales by
July 2020
Poor Market
Year 2019 2020 2021 2022 2023 2024 2025
Cash outflows -2.9625 -1.25
Present value factor 0.925926 0.890973
Present value of cash
outflows
-2.74306 -1.11372
Cash Inflows - 2 4 6 7 9
Probability 0.2 0.2 0.2 0.2 0.2
Cash inflows after adjusting for
market conditions
0.4 0.8 1.2 1.4 1.8
Present value factor 0.857339 0.793832 0.73503 0.680583 0.63017
Net cash flows 0.342936 0.635066 0.882036 0.952816 1.134305
NPV 0.090388
Present value of cash outflows -3.85677
2
Present value of cash inflows 3.947159
Electric
wire
Ready by
June 2020
Production
& sales by
January
2021
Good market
Year 2019 2020 2021 2022 2023 2024 2025
Cash outflows -1.65 -1.45
Present value factor 0.925926 0.857339
Present value of cash
outflows
-1.52778 -1.24314
Cash Inflows - 6 9 12 16 18
Probability 0.65 0.65 0.65 0.65 0.65
Cash inflows after adjusting for market conditions 3.9 5.85 7.8 10.4 11.7
Present value factor 0.793832 0.73503 0.680583 0.63017 0.58349
Net cash flows 3.095946 4.299925 5.308549 6.553764 6.826838
NPV 23.3141
Present value of cash outflows -2.77092
Present value of cash inflows 26.08502
Electric
wire
Ready by
June 2020
Production
& sales by
January
2021
Bad market
Year 2019 2020 2021 2022 2023 2024 2025
Cash outflows -1.65 -1.45
Present value factor 0.925926 0.857339
Present value of cash
outflows
-1.52778 -1.24314
Cash Inflows - 2 4 6 7 9
Probability 0.35 0.35 0.35 0.35 0.35
Cash inflows after adjusting for market conditions 0.7 1.4 2.1 2.45 3.15
Present value factor 0.793832 0.73503 0.680583 0.63017 0.58349
Net cash flows 0.555683 1.029042 1.429225 1.543916 1.837995
NPV 3.62494
Present value of cash outflows -2.77092
3
Electric
wire
Ready by
June 2020
Production
& sales by
January
2021
Good market
Year 2019 2020 2021 2022 2023 2024 2025
Cash outflows -1.65 -1.45
Present value factor 0.925926 0.857339
Present value of cash
outflows
-1.52778 -1.24314
Cash Inflows - 6 9 12 16 18
Probability 0.65 0.65 0.65 0.65 0.65
Cash inflows after adjusting for market conditions 3.9 5.85 7.8 10.4 11.7
Present value factor 0.793832 0.73503 0.680583 0.63017 0.58349
Net cash flows 3.095946 4.299925 5.308549 6.553764 6.826838
NPV 23.3141
Present value of cash outflows -2.77092
Present value of cash inflows 26.08502
Electric
wire
Ready by
June 2020
Production
& sales by
January
2021
Bad market
Year 2019 2020 2021 2022 2023 2024 2025
Cash outflows -1.65 -1.45
Present value factor 0.925926 0.857339
Present value of cash
outflows
-1.52778 -1.24314
Cash Inflows - 2 4 6 7 9
Probability 0.35 0.35 0.35 0.35 0.35
Cash inflows after adjusting for market conditions 0.7 1.4 2.1 2.45 3.15
Present value factor 0.793832 0.73503 0.680583 0.63017 0.58349
Net cash flows 0.555683 1.029042 1.429225 1.543916 1.837995
NPV 3.62494
Present value of cash outflows -2.77092
3
Present value of cash inflows 6.395859
GPS Ready by
December
2019
Production
& sales by
January
2021
Good Market
Year 2019 2020 2021 2022 2023 2024 2025
Cash outflows -3.63 -2.7
Present value
factor
0.925926 0.857339
Present value of
cash outflows
-3.36111 -2.31481
Cash Inflows - 10 16 18 22 26
Probability 0.65 0.65 0.65 0.65 0.65
Cash inflows after adjusting for market conditions 6.5 10.4 11.7 14.3 16.9
Present value factor 0.793832 0.73503 0.680583 0.63017 0.58349
Net cash flows 5.15991 7.64431 7.962823 9.011426 9.860988
NPV 33.96353
Present value of cash outflows -5.67593
Present value of cash inflows 39.63946
GP
S
Ready
by
Decemb
er 2019
Producti
on &
sales by
July
2020
poor Market
Yea
r
2019 2020 2021 2022 2023 2024 2025
Cash outflows -2.9625 -2.7
Present value
factor
0.92592
6
0.89097
3
Present value
of cash
outflows
-2.74306 -
2.40563
Cash Inflows - 4 7 9 11 13
Probability 0.35 0.35 0.35 0.35 0.35
Cash inflows after adjusting for 1.4 2.45 3.15 3.85 4.55
4
Secure Best Marks with AI Grader
Need help grading? Try our AI Grader for instant feedback on your assignments.
market conditions
Present value factor 0.7938
32
0.7350
3
0.6805
83
0.6301
7
0.5834
9
Net cash flows 1.1113
65
1.8008
23
2.1438
37
2.4261
53
2.6548
81
NP
V
4.98837
8
Present value of cash
outflows
-
5.14868
Present value of cash
inflows
10.1370
6
GP
S
Ready
by
Decemb
er 2020
Producti
on &
sales by
January
2022
Good market
Yea
r
2019 2020 2021 2022 2023 2024 2025 2026
Cash outflows -1.65 -0.76 -2.7
Present value
factor
0.92592
6
0.85733
9
0.7938
32
Present value
of cash
outflows
-1.52778 -
0.65158
-
2.1433
5
Cash Inflows - 10 16 18 22 26
Probability 0.5 0.5 0.5 0.5 0.5
Cash inflows after adjusting for market
conditions
5 8 9 11 13
Present value factor 0.7350
3
0.6805
83
0.6301
7
0.5834
9
0.5402
69
Net cash flows 3.6751
49
5.4446
66
5.6715
27
6.4183
94
7.0234
95
NP
V
23.9105
3
Present value of cash
outflows
-4.3227
Present value of cash 28.2332
5
inflows 3
GPS Ready by
Decembe
r 2020
Productio
n & sales
by
January
2022
Poor market
Year 2019 2020 2021 2022 2023 2024 2025 2026
Cash outflows -1.65 -0.76 -2.7
Present value
factor
0.925926 0.857339 0.79383
2
Present value of
cash outflows
-1.52778 -0.65158 -2.14335
Cash Inflows - 4 7 9 11 13
Probability 0.5 0.5 0.5 0.5 0.5
Cash inflows after adjusting for market conditions 2 3.5 4.5 5.5 6.5
Present value factor 0.73503 0.68058
3
0.63017 0.58349 0.54026
9
Net cash flows 1.47006 2.38204
1
2.83576
3
3.20919
7
3.51174
8
NP
V
9.086107
Present value of cash outflows -4.3227
Present value of cash inflows 13.40881
6
1 out of 24
Related Documents


Your All-in-One AI-Powered Toolkit for Academic Success.
+13062052269
info@desklib.com
Available 24*7 on WhatsApp / Email
![[object Object]](/_next/static/media/star-bottom.7253800d.svg)
Unlock your academic potential
© 2024 | Zucol Services PVT LTD | All rights reserved.