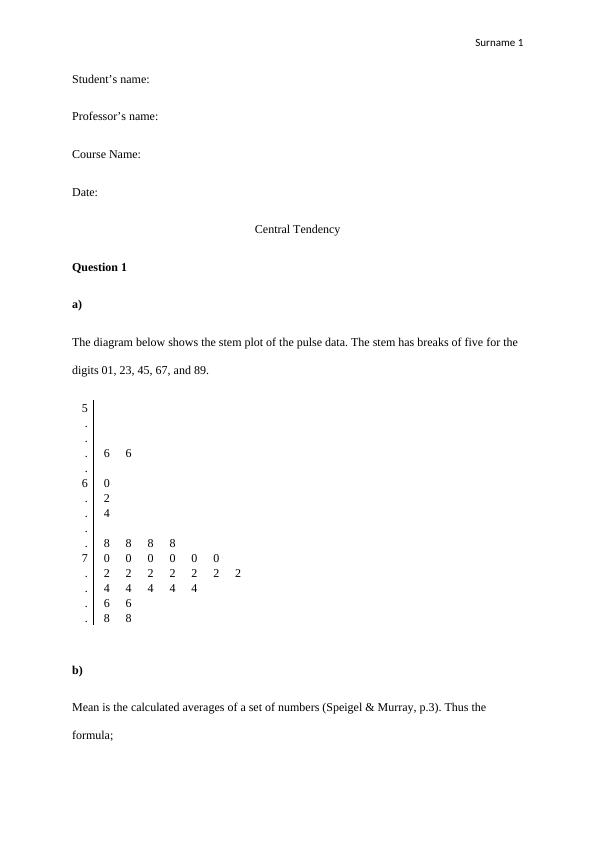
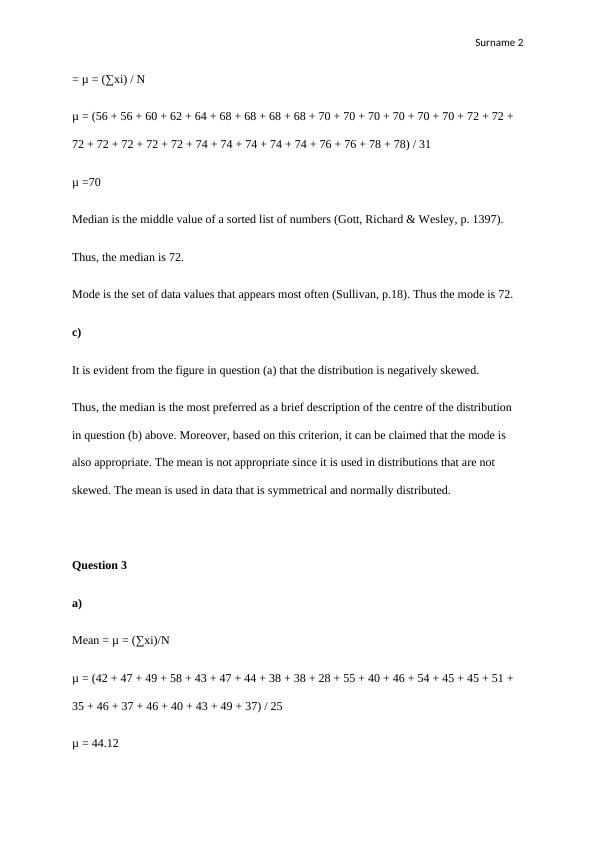
Central Tendency - Mean, Median, and Mode
Added on 2023-06-08
4 Pages652 Words316 Views
End of preview
Want to access all the pages? Upload your documents or become a member.
Statistics - Variable List, Histogram, Descriptive Statistics, Pivot Table and Bar Chart
|8
|1287
|69
European History : Assignment
|160
|34211
|69
Statistics And Research Methods for Business
|6
|700
|35
Applied Quantitative Method
|16
|2430
|447
Statistics Assignment: Mean, Median, Mode, Confidence Interval, Hypothesis Test
|6
|1554
|131
Comparative Analysis of Exam Scores using Boxplots, Histograms, F-test, Confidence Interval and Hypothesis Test
|8
|785
|125