Quantitative Analysis of Footwear Study: Data Analysis Report, Results
VerifiedAdded on 2021/05/31
|7
|820
|96
Report
AI Summary
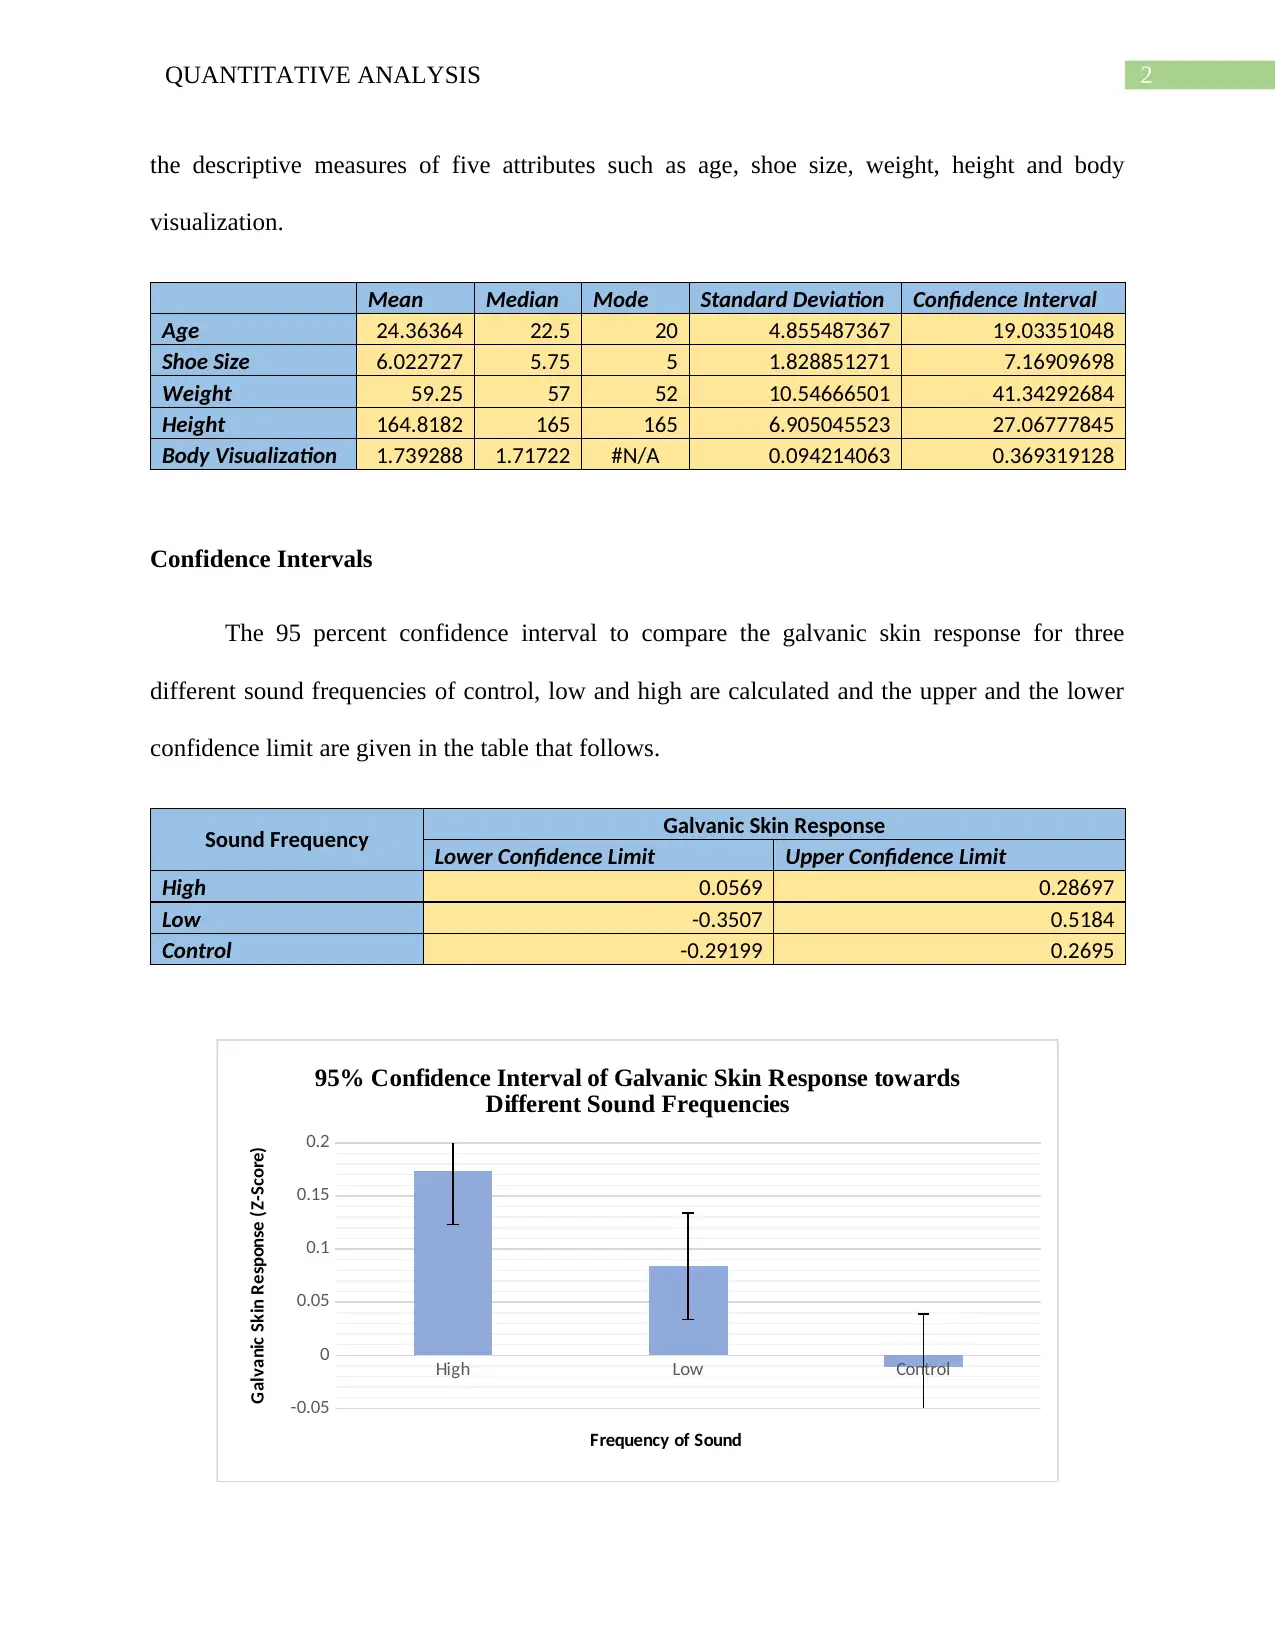
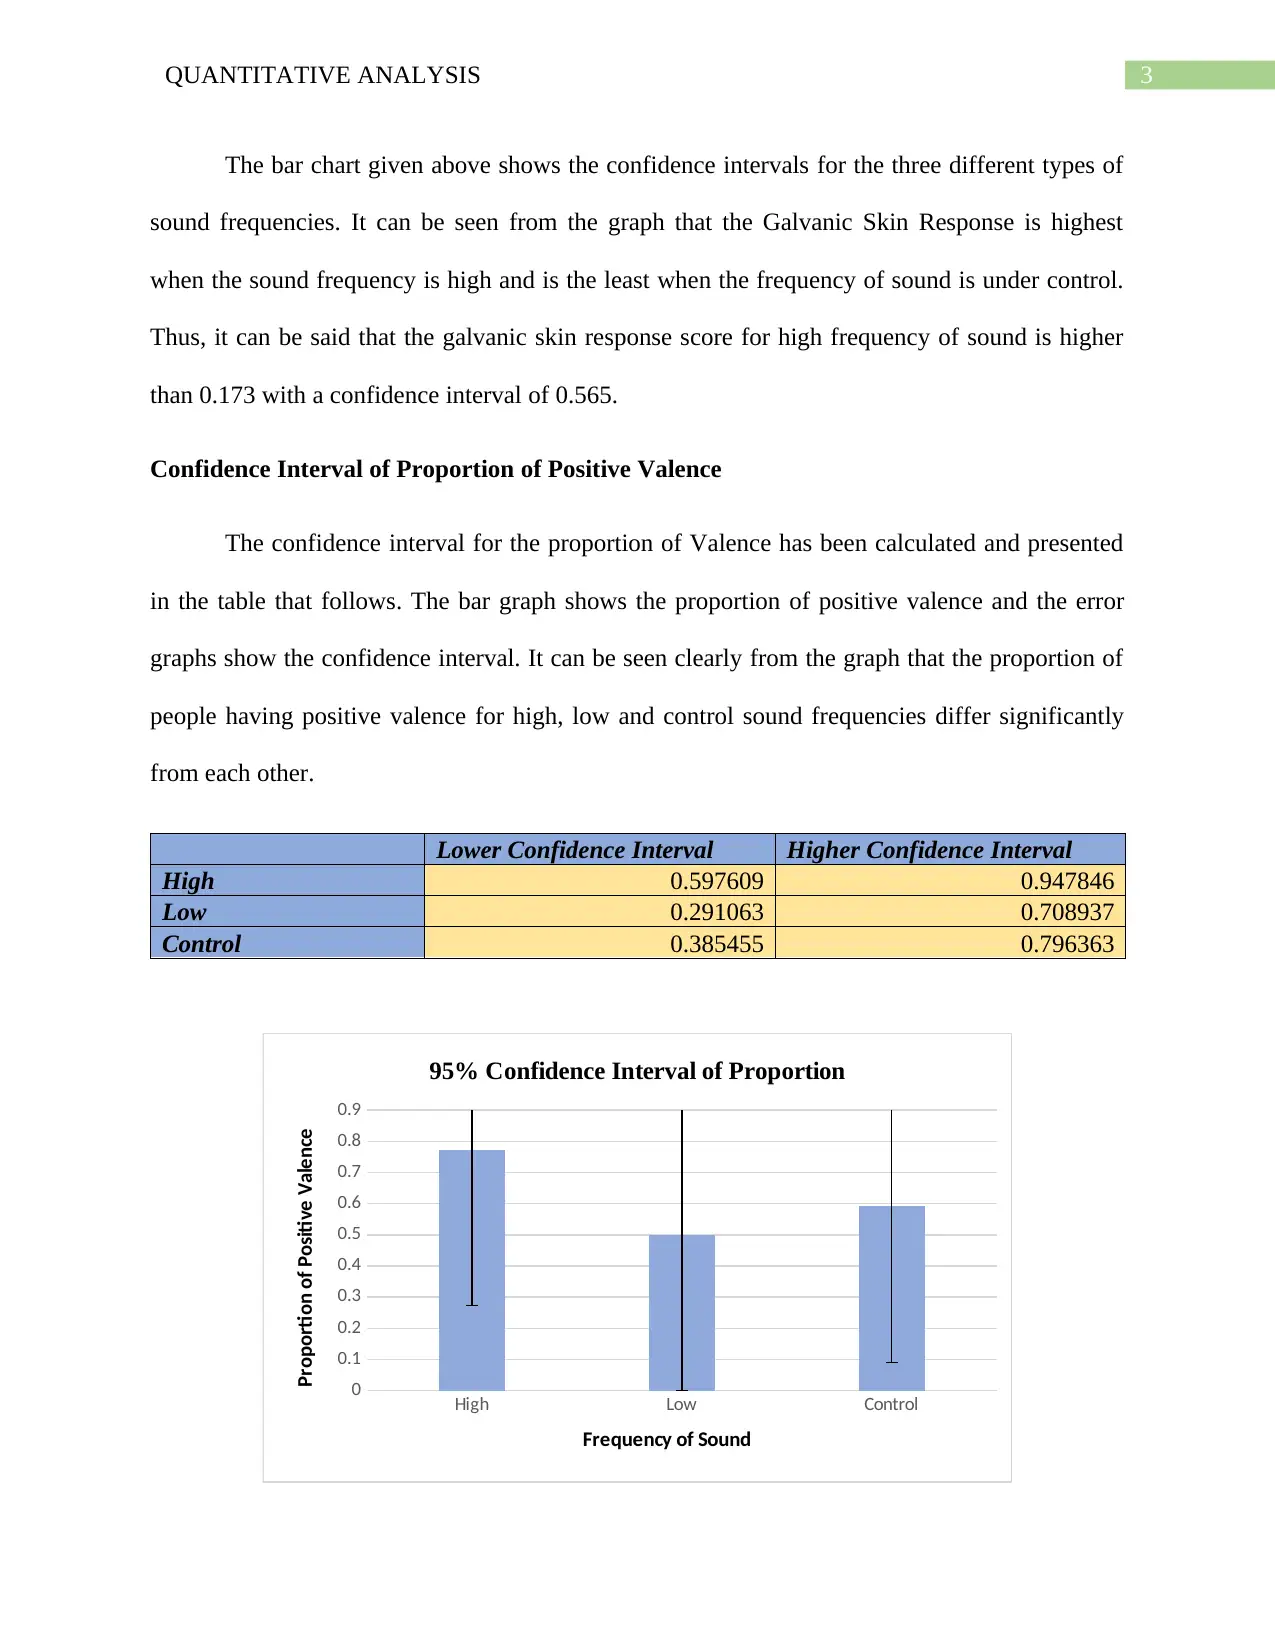
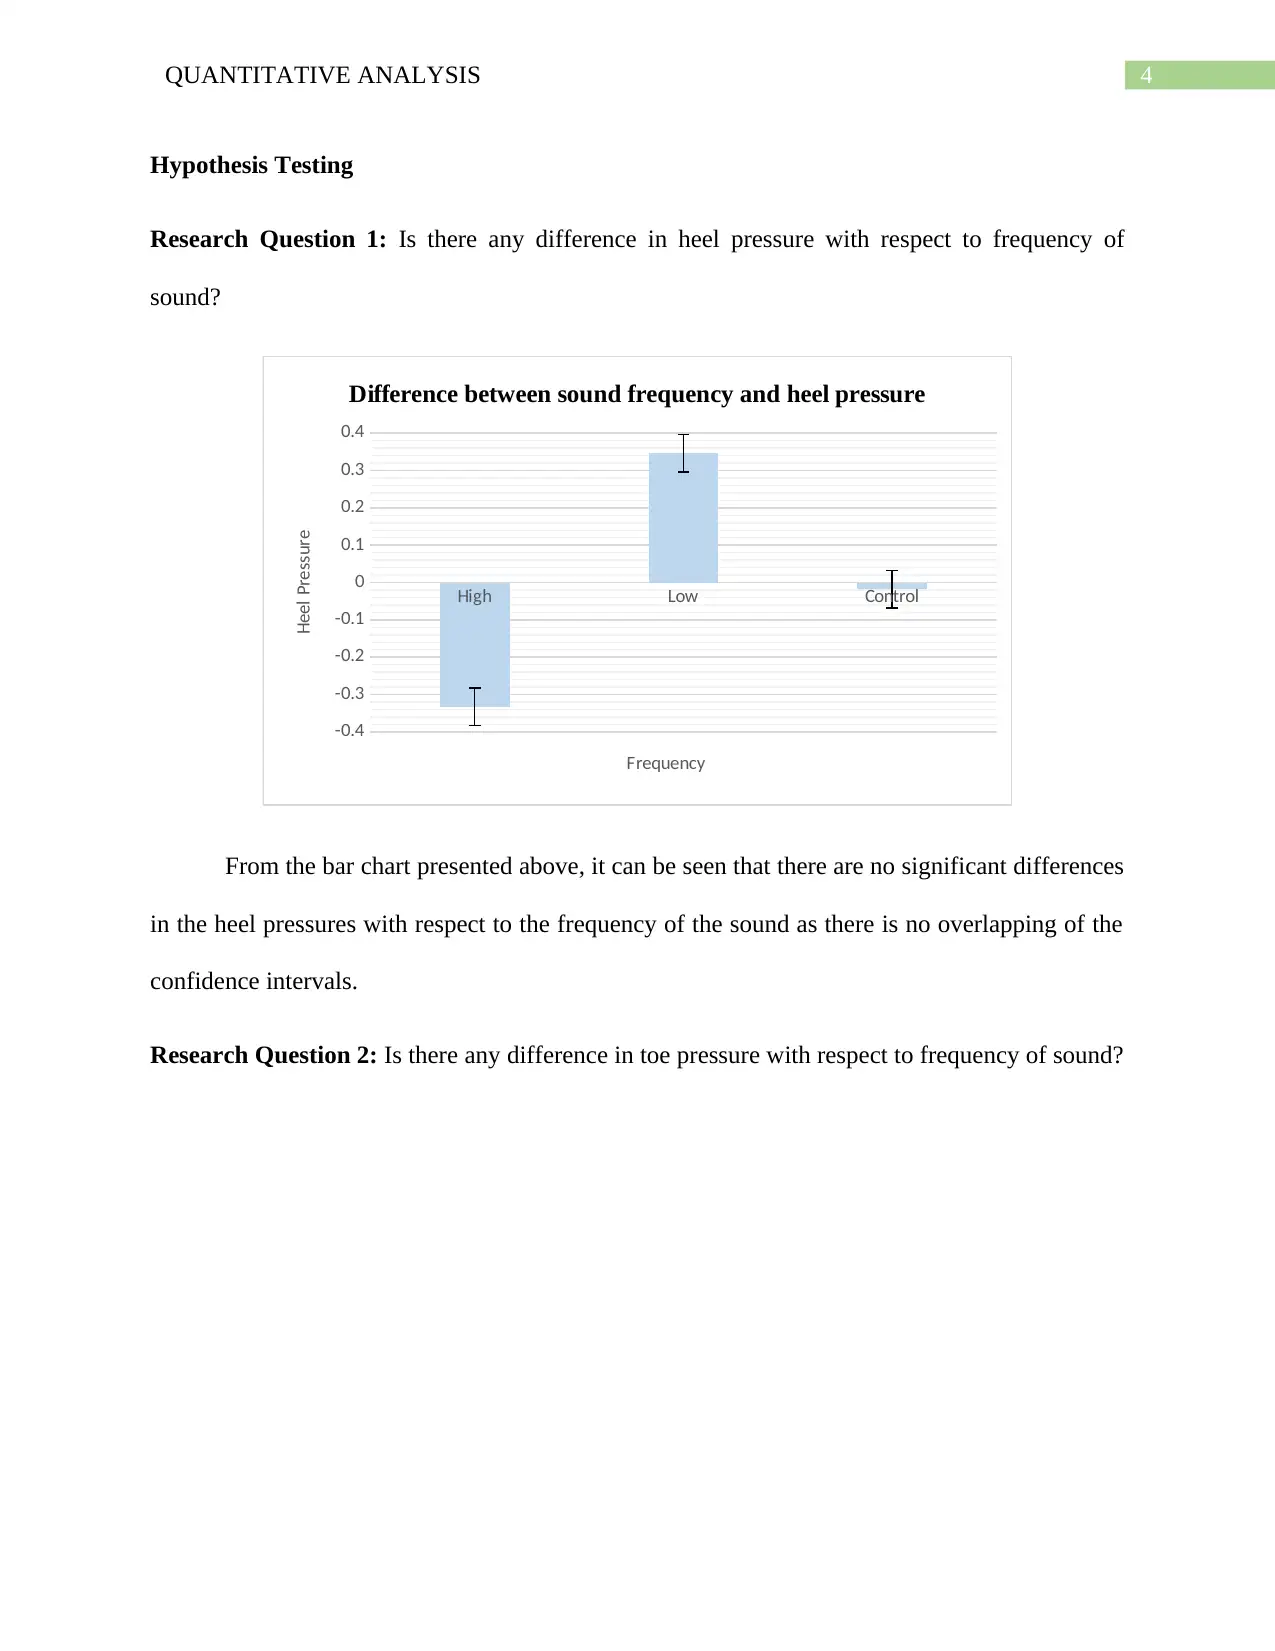
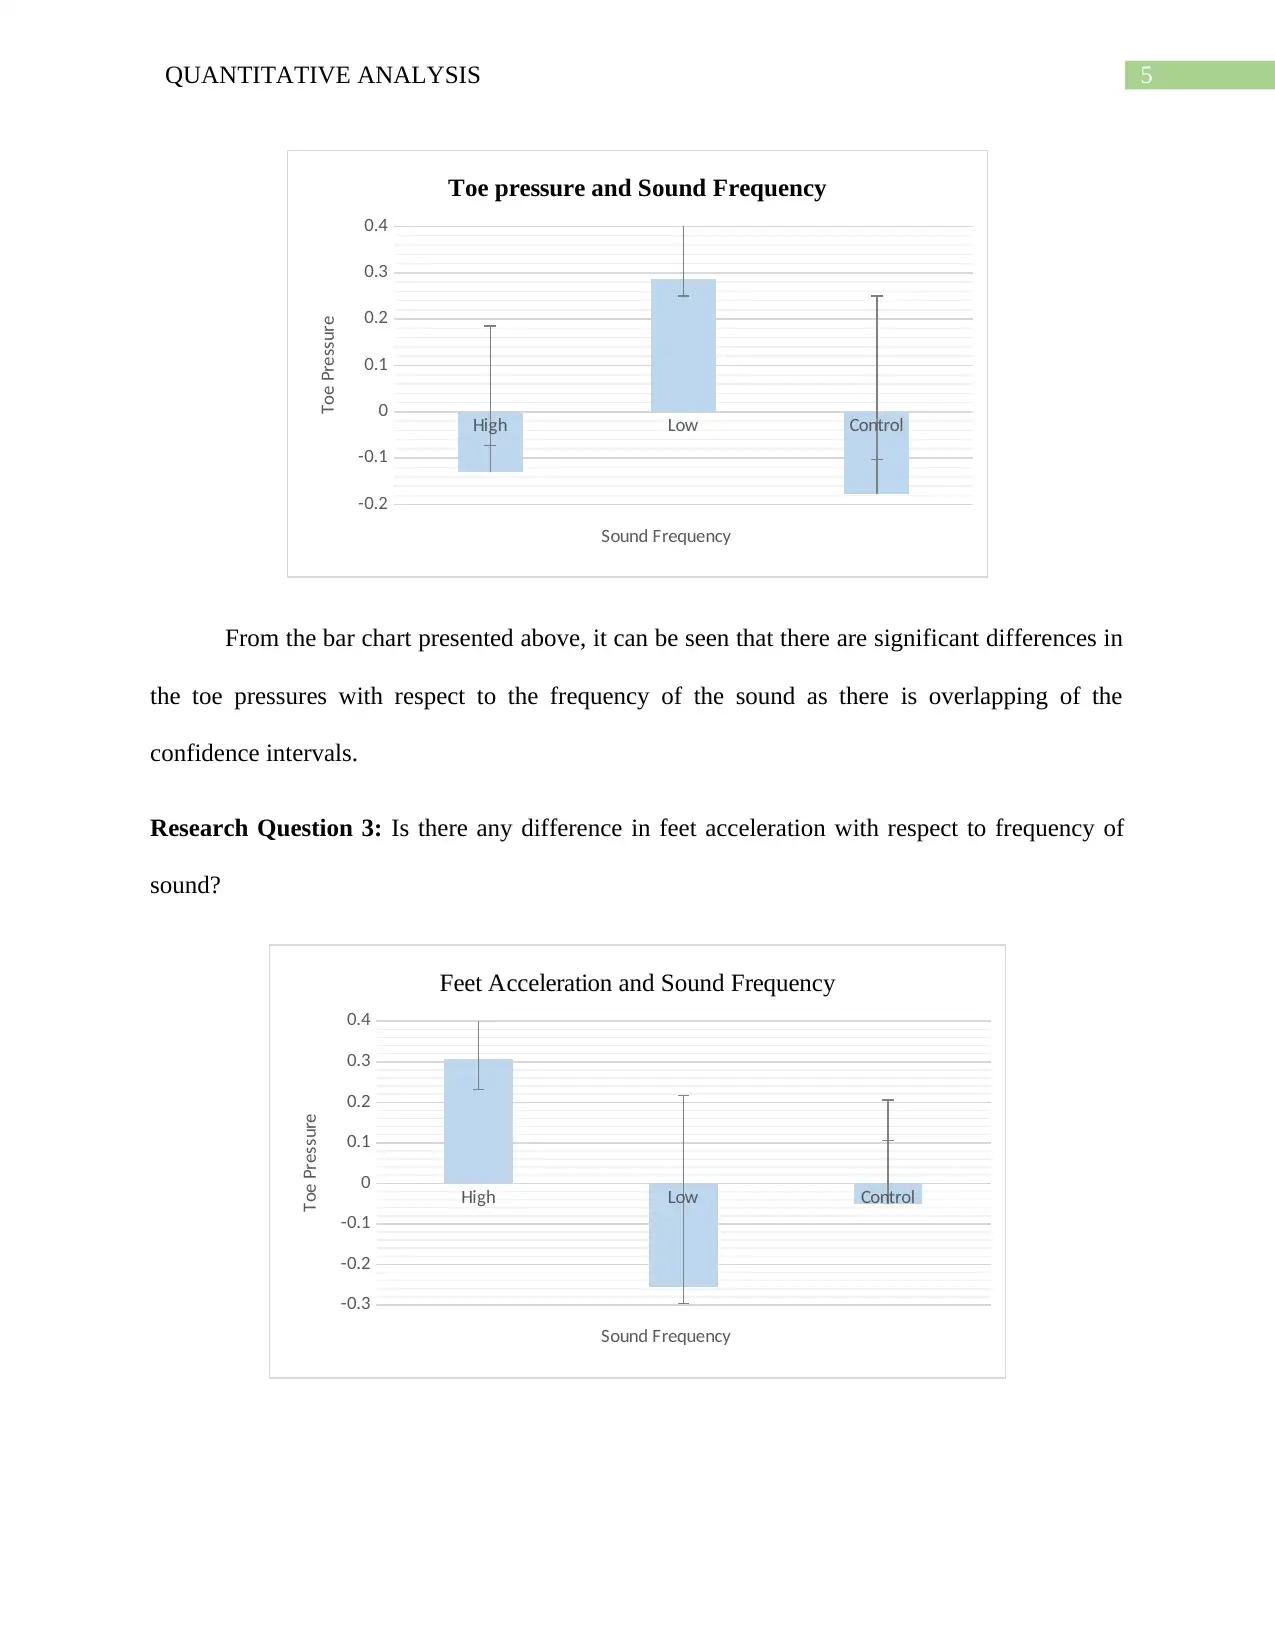
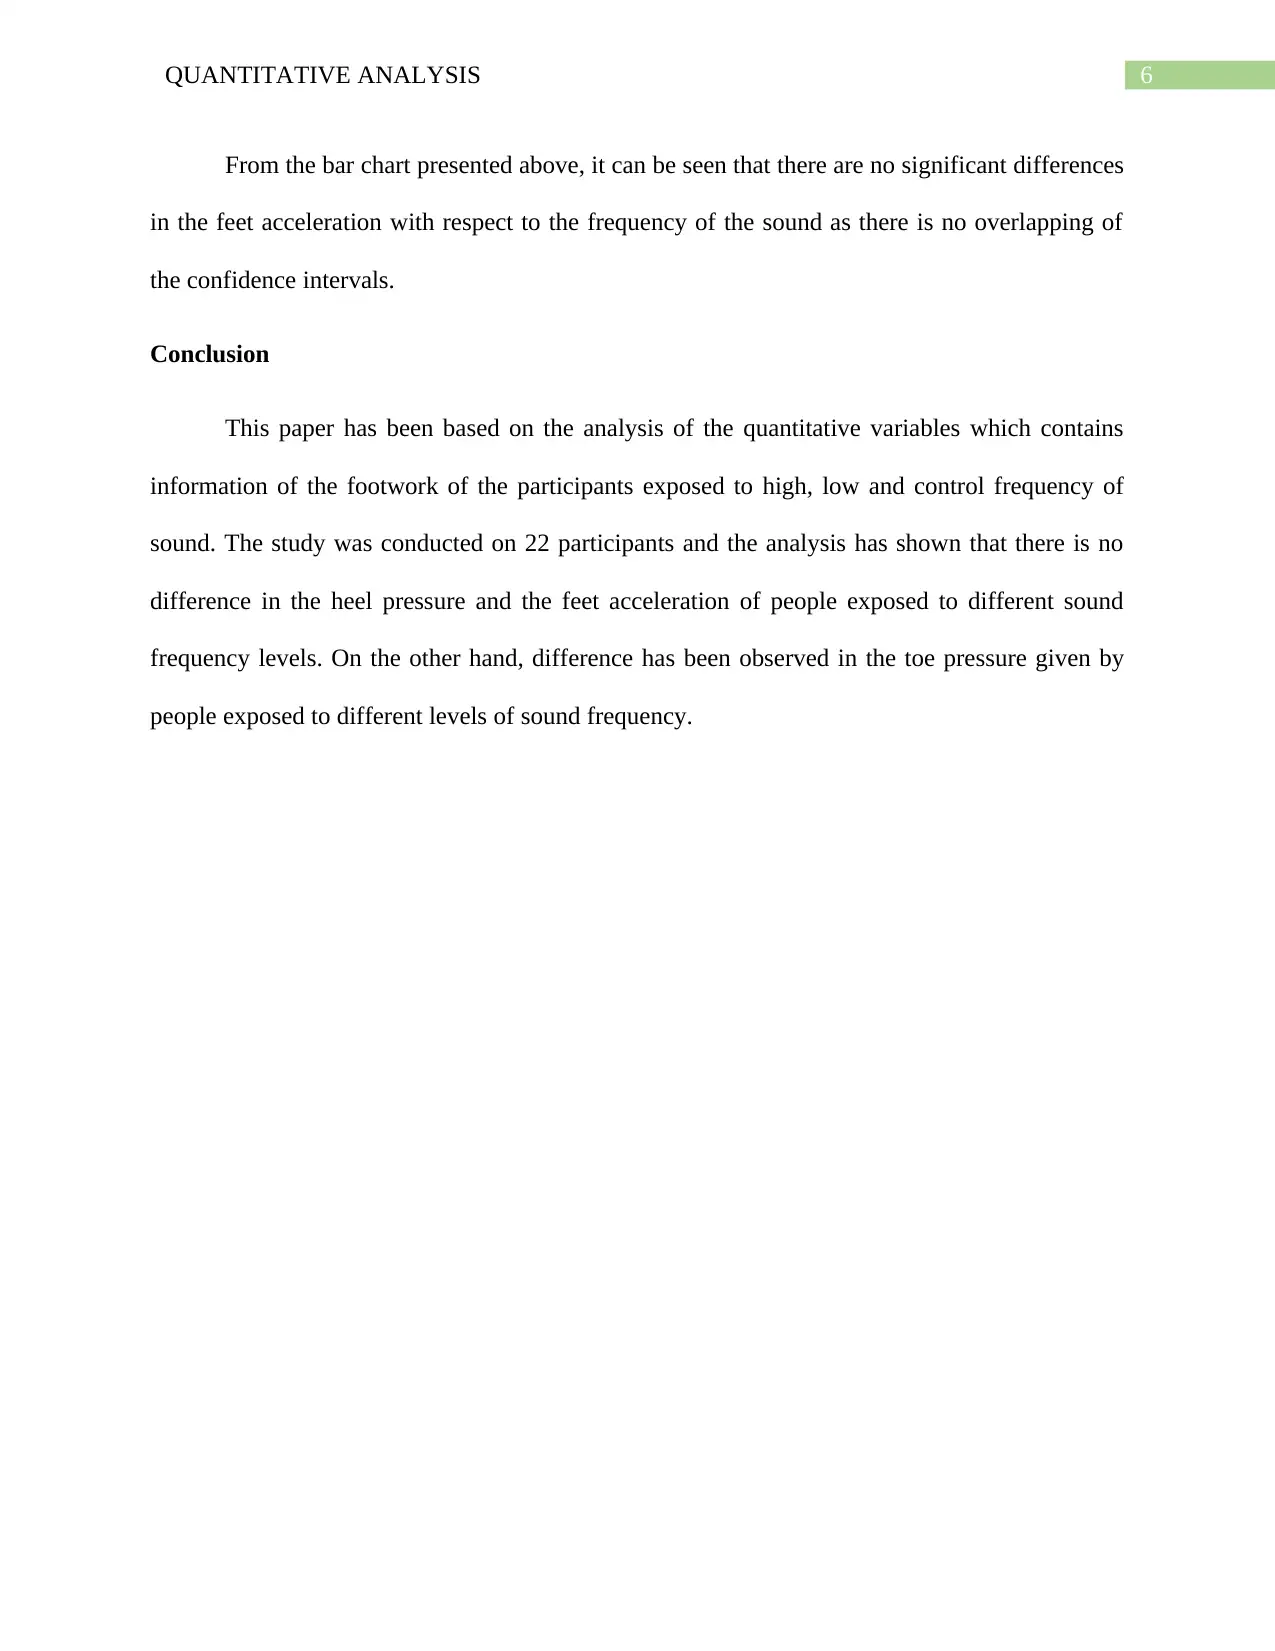
This report presents a quantitative analysis of a footwear study, investigating the behavioral changes of users with varying audio interfaces in footwear. The study involved 22 participants, and the analysis addressed data issues such as missing values, which were handled by replacing them with attribute averages. Descriptive statistics were calculated for attributes like age, shoe size, and weight. Confidence intervals were computed for galvanic skin response and the proportion of positive valence across different sound frequencies (high, low, and control). Hypothesis testing was conducted to assess differences in heel pressure, toe pressure, and feet acceleration concerning sound frequency. The findings indicated no significant differences in heel pressure and feet acceleration, while toe pressure showed significant variations across sound frequency levels. The study concludes that the audio interface influences user behavior, specifically affecting toe pressure, and provides insights into the impact of sound frequency on user responses.
1 out of 7
Related Documents


Your All-in-One AI-Powered Toolkit for Academic Success.
+13062052269
info@desklib.com
Available 24*7 on WhatsApp / Email
![[object Object]](/_next/static/media/star-bottom.7253800d.svg)
Copyright © 2020–2026 A2Z Services. All Rights Reserved. Developed and managed by ZUCOL.