EXSC 610: Analyzing ECG Leads, Electrode Placement & Axis Quadrant
VerifiedAdded on 2022/10/17
|8
|1664
|18
Essay
AI Summary
This EXSC 610 essay comprehensively addresses key aspects of electrocardiography (ECG). It explains the determination and interaction of leads I, II, and III, including how to verify proper connections using Einthoven's triangle. The essay details electrode placement during resting ECGs and contrasts it with placement during stress tests, explaining the reasons for these differences. Furthermore, it elucidates how a normal axis is determined, methods for determining axis quadrant, and quantitative methodologies for axis determination using lead I and aVF measurements. The essay references the course textbook and other scholarly sources to support its explanations of ECG principles and techniques.

Running head: CHAPTER 5
CHAPTER 5
Name of the Student
Name of the University
Author Note
CHAPTER 5
Name of the Student
Name of the University
Author Note
Paraphrase This Document
Need a fresh take? Get an instant paraphrase of this document with our AI Paraphraser

1CHAPTER 5
1. How are leads I, II, and III determined; why is there an interaction; and how you
can determine if you have a good connection using the interaction of these leads?
The standard electrocardiogram (ECG) consists of twelve leads. Out of twelve leads six
leads are referred as limb leads. These leads are situated on the extremities (arms and
legs) of an individual. These six leads are lead I, II, III, aVl, aVR, aVF. Out of these six
limb leads the three limb leads (Lead I, II and III) are basically referred as bipolar limb
leads. These are referred as bipolar leads because one lead is positive whereas the other
lead is negative. These two electrodes are equidistantly placed from heart. These bipolar
limb leads record the flow of electricity in the direction from negative electrode to
positive electrode. According to Novel Laureate physiologist Willem Einthoven, these
three bipolar limb leads are connected by Einthoven’s triangle (Hampton, 2013). This
Einthoven’s triangle is the main key factor in order to develop an interaction among
bipolar limb leads. Considering the orientation of these bipolar leads I, II and III in an
individual, it has been observed that the summation of voltage present in lead I and III is
equal to lead II (Dunbar & Saul, 2009). The interaction between the three bipolar limb
leads exist as
Lead I: Right Atrium (-) to Left Atrium (+)
Lead II: Right Atrium (-) to Left Leg (+)
Lead III: Left Atrium (-) to Left Leg (+)
In order to confirm whether a good connection exists among these bipolar limb leads or
not, the Einthoven’s triangle summation formula has to be checked. If a positive deflection is
observed in ECG due to the movement of a depolarization wave towards the positive
electrode then lead I + lead III= lead II. This formula thus evaluates the proper connection
between these three bipolar limb leads (Hampton, 2013).

2CHAPTER 5
2. Describe in detail where electrodes are placed during a resting ECG and how they
differ during a stress test. Explain why they differ.
12-lead ECG that signifies a spatiotemporal information regarding the electrical activity of
an individual’s heart, is placed during a resting ECG in different orientations.
Bipolar limb leads (horizontal plane) are placed as:
Lead I: RA (-) to LA (+) (Right Left, or lateral)
Lead II: RA (-) to LL (+) (Superior Inferior)
Lead III: LA (-) to LL (+) (Superior Inferior)
Augmented unipolar limb leads (frontal plane) are placed as:
Lead aVR: RA (+) to [LA & LL] (-) (Rightward)
Lead aVL: LA (+) to [RA & LL] (-) (Leftward)
Lead aVF: LL (+) to [RA & LA] (-) (Inferior)
Unipolar (+) chest leads (horizontal plane) are placed as:
Leads V1, V2, V3: (Posterior Anterior)
Leads V4, V5, V6:(Right Left, or lateral)
This type of ECG placement is applicable for resting supine ECGs. ECG is normally
recorded in the supine position. However, in some cases ECG can be performed in different
conditions. When ECG is recorded during a stress test, it has been observed that the limb
leads are placed in a different position. During stress test, the limb electrodes are placed onto
the trunk of the human body which is referred as torso whereas the chest electrodes are
placed in the same position. This type of lead placement can be referred as Mason-Likar Lead
placement (Dunbar & Saul, 2009).
⊘ This is a preview!⊘
Do you want full access?
Subscribe today to unlock all pages.
Trusted by 1+ million students worldwide

3CHAPTER 5
The electrode placement differs during stress exercise test from the resting supine position in
order to avoid the tripping hazard of that particular individual (Fletcher et al., 2013).
Moreover, if electrode placement is not different in stress exercise test from the resting
supine position the results of ECG would be unreadable due to the presence of different
instrumental artifacts.
3. Explain how a normal axis is determined and how to determine axis quadrant.
The overall electrical activity of the heart is denoted by a normal ECG axis. The normal
ECG axis can also be referred as an electrical axis of the heart. According to the concept of
electrophysiology, an electrical vector is comprised of both the magnitude and direction of
the action potential (Dunbar & Saul, 2009). The action potential occurs due to the presence of
a single myocyte. The electrical axis is thus made up of summation of all individual vectors
generated due to depolarization wave.
In order to determine an axis quadrant, the ventricular (QRS) axis of ECG acts as an
important determinant.
Normal Axis = QRS axis ranges from -30° and +90°.
Left Axis Deviation = QRS axis is always less than -30°.
Right Axis Deviation = QRS axis is always greater than +90°.
There are several methods for ECG axis interpretation. One of the methods for ECG axis
interpretation is the quadrant method (Dunbar & Saul, 2009).
The quadrant method is solely dependent upon the lead I and aVF. Generally a positive QRS
complex depicts that the ventricular axis resides in the same direction of that lead.
Paraphrase This Document
Need a fresh take? Get an instant paraphrase of this document with our AI Paraphraser
4CHAPTER 5
On the other hand, a negative QRS complex depicts that the ventricular axis resides exactly in
the opposite direction of the lead. The ventricular axis can also be perpendicular if the QRS
complex remains isoelectric in a lead (Goldberger, Goldberger & Shvilkin, 2017).
4. Explain in detail how axis can be determined using a quantitative methodology.
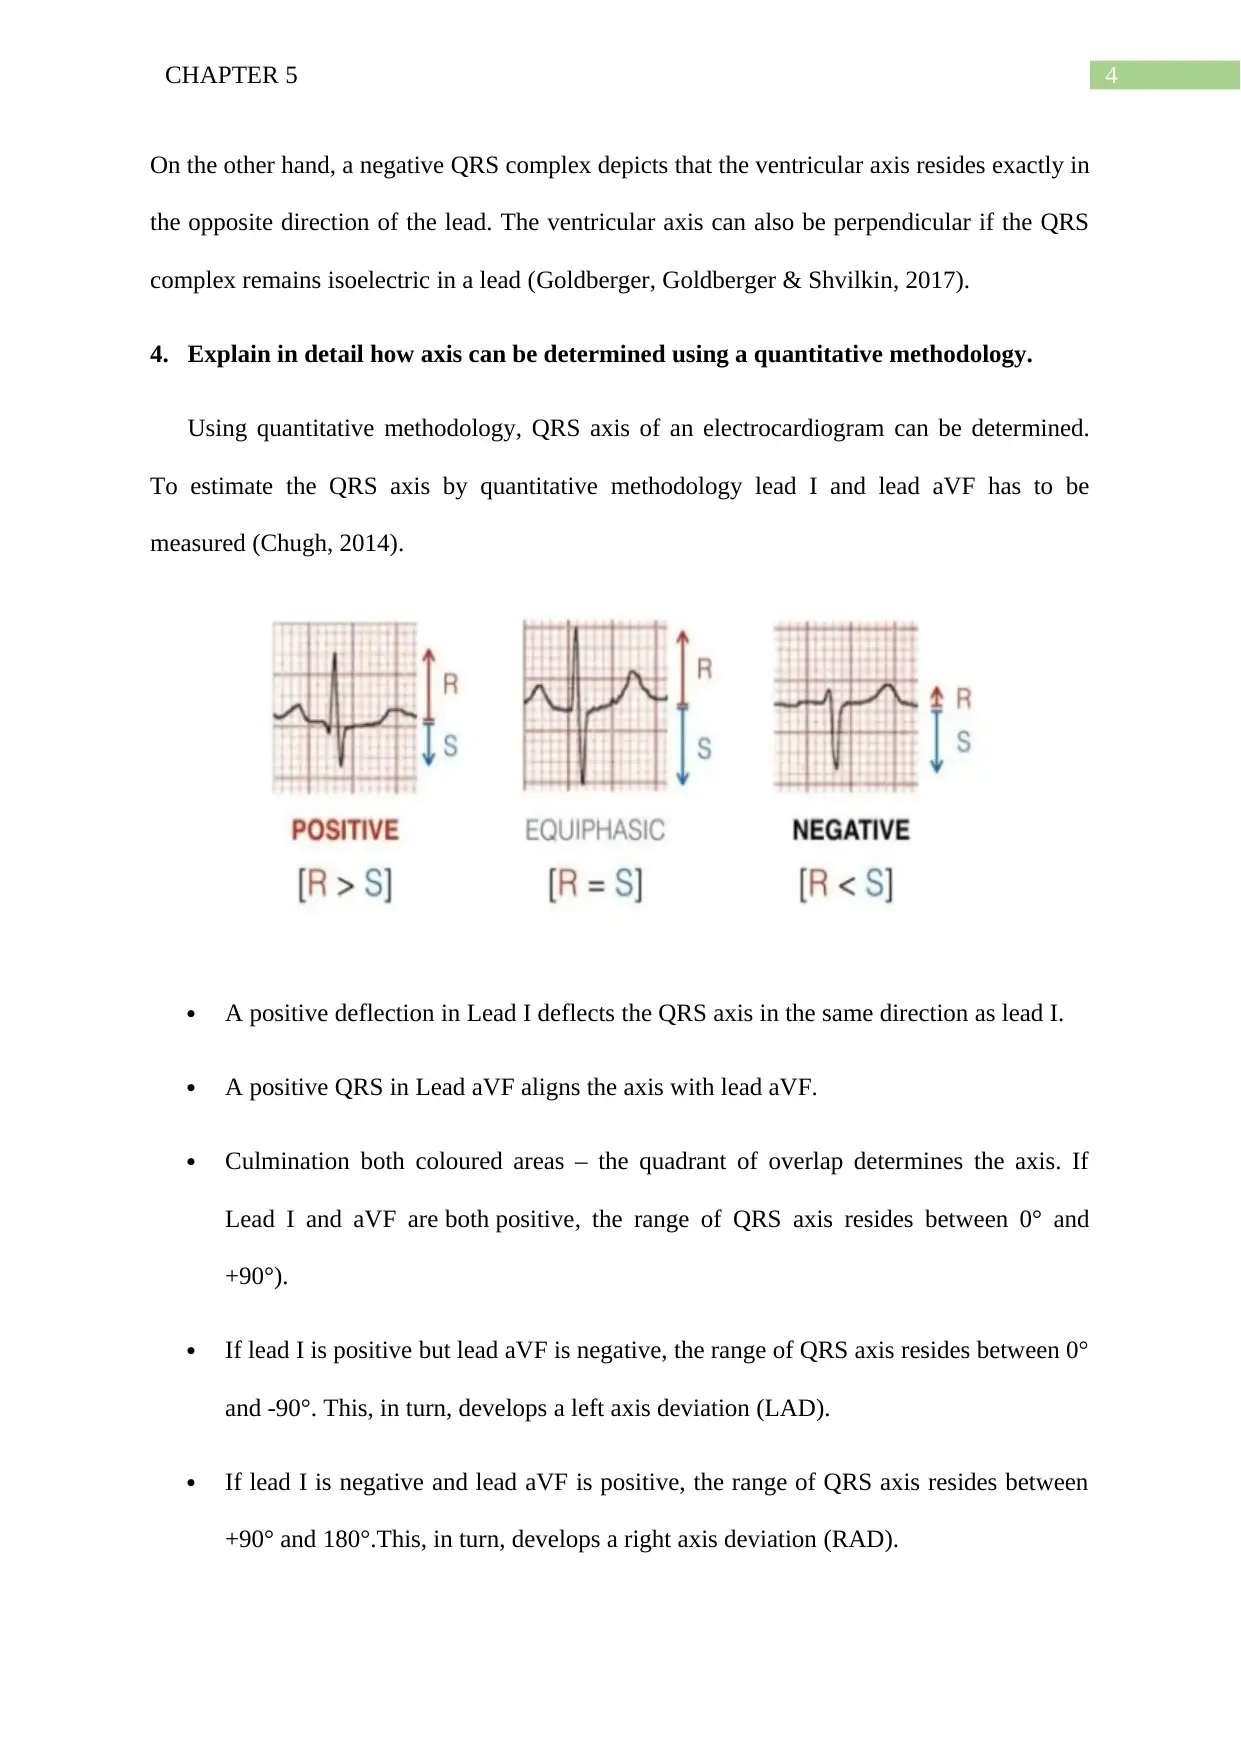
Using quantitative methodology, QRS axis of an electrocardiogram can be determined.
To estimate the QRS axis by quantitative methodology lead I and lead aVF has to be
measured (Chugh, 2014).
A positive deflection in Lead I deflects the QRS axis in the same direction as lead I.
A positive QRS in Lead aVF aligns the axis with lead aVF.
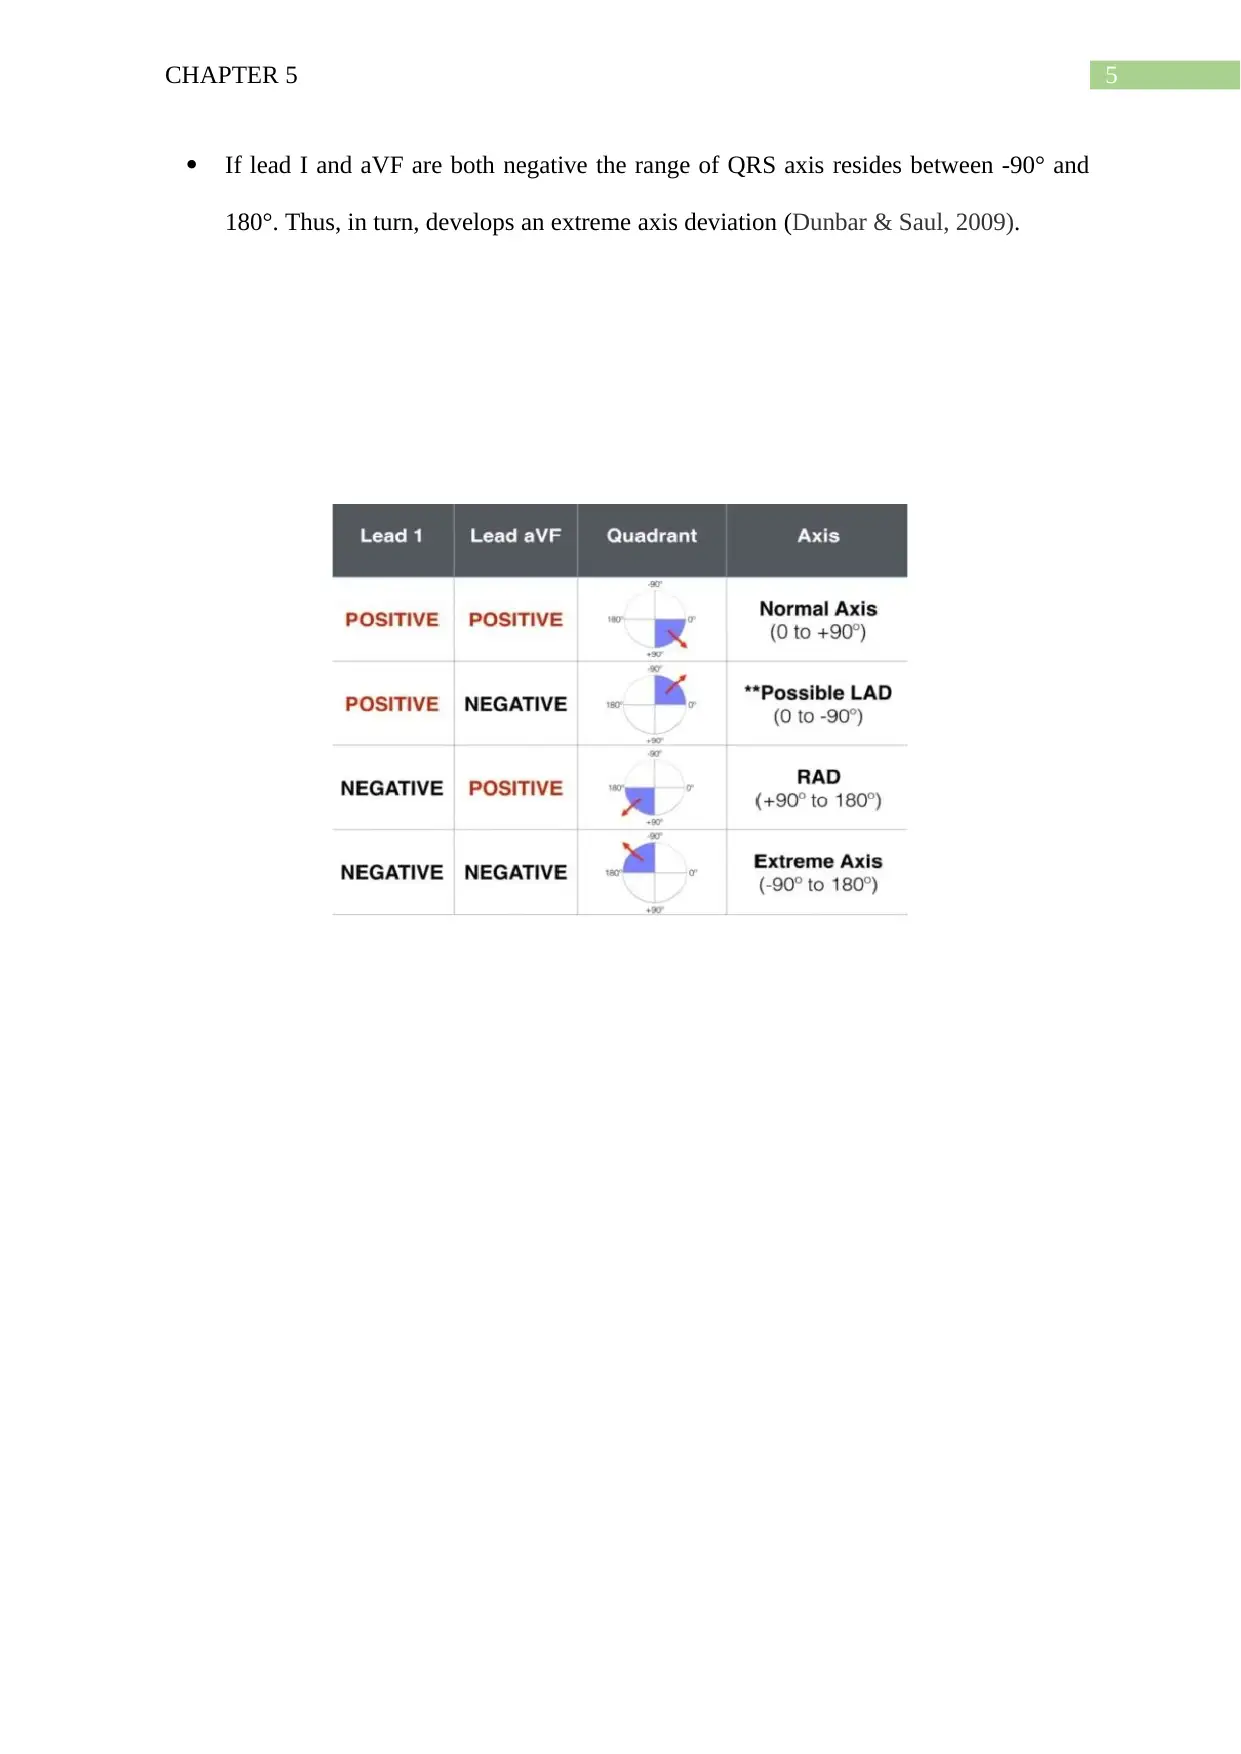
Culmination both coloured areas – the quadrant of overlap determines the axis. If
Lead I and aVF are both positive, the range of QRS axis resides between 0° and
+90°).
If lead I is positive but lead aVF is negative, the range of QRS axis resides between 0°
and -90°. This, in turn, develops a left axis deviation (LAD).
If lead I is negative and lead aVF is positive, the range of QRS axis resides between
+90° and 180°.This, in turn, develops a right axis deviation (RAD).
On the other hand, a negative QRS complex depicts that the ventricular axis resides exactly in
the opposite direction of the lead. The ventricular axis can also be perpendicular if the QRS
complex remains isoelectric in a lead (Goldberger, Goldberger & Shvilkin, 2017).
4. Explain in detail how axis can be determined using a quantitative methodology.
Using quantitative methodology, QRS axis of an electrocardiogram can be determined.
To estimate the QRS axis by quantitative methodology lead I and lead aVF has to be
measured (Chugh, 2014).
A positive deflection in Lead I deflects the QRS axis in the same direction as lead I.
A positive QRS in Lead aVF aligns the axis with lead aVF.
Culmination both coloured areas – the quadrant of overlap determines the axis. If
Lead I and aVF are both positive, the range of QRS axis resides between 0° and
+90°).
If lead I is positive but lead aVF is negative, the range of QRS axis resides between 0°
and -90°. This, in turn, develops a left axis deviation (LAD).
If lead I is negative and lead aVF is positive, the range of QRS axis resides between
+90° and 180°.This, in turn, develops a right axis deviation (RAD).
5CHAPTER 5
If lead I and aVF are both negative the range of QRS axis resides between -90° and
180°. Thus, in turn, develops an extreme axis deviation (Dunbar & Saul, 2009).
If lead I and aVF are both negative the range of QRS axis resides between -90° and
180°. Thus, in turn, develops an extreme axis deviation (Dunbar & Saul, 2009).
⊘ This is a preview!⊘
Do you want full access?
Subscribe today to unlock all pages.
Trusted by 1+ million students worldwide

6CHAPTER 5
References
American College of Sports Medicine. (2013). ACSM's guidelines for exercise testing and
prescription. Lippincott Williams & Wilkins.
Chugh, S. N. (2014). Textbook of clinical electrocardiography. JAYPEE BROTHERS
PUBLISHERS.
Dunbar, C. C., & Saul, B. (2009). ECG interpretation for the clinical exercise physiologist.
Baltimore, MD: Lippincott Williams & Wilkins. ISBN 978-0-7817-7865-7
Fletcher, G. F., Ades, P. A., Kligfield, P., Arena, R., Balady, G. J., Bittner, V. A., ... & Gulati,
M. (2013). Exercise standards for testing and training: a scientific statement from the
American Heart Association. Circulation, 128(8), 873-934.
Goeirmanto, L., Mengko, R., & Rajab, T. L. (2016, April). Comparison of the calculation
QRS angle for bundle branch block detection. In IOP Conference Series: Materials
Science and Engineering (Vol. 128, No. 1, p. 012037). IOP Publishing.
Goldberger, A. L., Goldberger, Z. D., & Shvilkin, A. (2017). Clinical Electrocardiography:
A Simplified Approach E-Book: A Simplified Approach. Elsevier Health Sciences.
Hampton, J. (2013). The ECG in practice. Elsevier Health Sciences. Retrieved from:
https://books.google.co.in/books?
hl=en&lr=&id=XSSAAAAQBAJ&oi=fnd&pg=PP1&dq=Hampton,+J.+(2013).
+The+ECG+in+practice.
+Elsevier+Health+Sciences.&ots=NaUPdvqZ9m&sig=LAOq5F6M1cPc22mktBjSqA
czcz4#v=onepage&q=Hampton%2C%20J.%20(2013).%20The%20ECG%20in
%20practice.%20Elsevier%20Health%20Sciences.&f=false. Access date: 23-09-2019
Hampton, J. (2013). The ECG Made Easy E-Book. Elsevier Health Sciences. Retrieved from:
https://books.google.co.in/books?
hl=en&lr=&id=MTeYAAAAQBAJ&oi=fnd&pg=PP1&dq=Hampton,+J.+(2013).
Paraphrase This Document
Need a fresh take? Get an instant paraphrase of this document with our AI Paraphraser

7CHAPTER 5
+The+ECG+in+practice.
+Elsevier+Health+Sciences.&ots=TkLTWuvJyY&sig=cW4lg_QdiGRoqAeksTHQqj
1qu54#v=onepage&q&f=false Access date: 23-09-2019
+The+ECG+in+practice.
+Elsevier+Health+Sciences.&ots=TkLTWuvJyY&sig=cW4lg_QdiGRoqAeksTHQqj
1qu54#v=onepage&q&f=false Access date: 23-09-2019
1 out of 8

Your All-in-One AI-Powered Toolkit for Academic Success.
+13062052269
info@desklib.com
Available 24*7 on WhatsApp / Email
![[object Object]](/_next/static/media/star-bottom.7253800d.svg)
Unlock your academic potential
Copyright © 2020–2026 A2Z Services. All Rights Reserved. Developed and managed by ZUCOL.