Analysis of Gear Pump Performance Characteristics - ENG1083
VerifiedAdded on 2023/04/11
|12
|2022
|124
Report
AI Summary
This report details an experiment conducted to analyze the performance characteristics of a gear pump, focusing on input power, flow rate, and overall efficiency. The experiment involved manipulating pump settings and monitoring sensor readings to generate characteristic curves. The results indicate that input power increases proportionally with outlet pressure, while flow rate decreases and stabilizes. Overall efficiency increases and decreases sharply during pump closing and opening, respectively. The findings are compared to theoretical models, with slight deviations attributed to experimental errors. The report concludes that gear pumps offer advantages in low-efficiency scenarios compared to other pump types. Desklib provides access to this report along with a wealth of study resources for students.

CHEMICAL ENGINEERING
By Name
Course
Instructor
Institution
Location
Date
By Name
Course
Instructor
Institution
Location
Date
Paraphrase This Document
Need a fresh take? Get an instant paraphrase of this document with our AI Paraphraser

PERFORMANCE CHARACTERISTICS OF A GEAR PUMP
Abstract
Characteristic curves present the best way of describing and understanding the operating
characteristic of a gear pump. The objective of the experiment was to study the characteristics
curves for a specific gear pump that were working at the design speed. The aim is attained
through setting the pump at various conditions which involved altering the pump settings as well
as the sensors and taking the multiple measurements when the pump was closing and opening.
The pump characteristic which was studied using characteristic curves included input power,
flow rate, and overall efficiency. The input power increases almost proportionately, the flow rate
decreases and then remains constant while the overall efficiency sharply increases and decreases
when the pump is closing and opening respectively with an increase in the outlet pressure of the
pump. The results of this experiment relatively compare with the theoretical and published
literature with the obtained characteristics curves slightly deviating from that in Figure 1. The
changes in the parameters are the same when the pump was in closing state as when in opening
state with the only difference being the behavior of the overall efficiency. There is variation in
the pressure when the pump is opening and when closing which results in a change in the flow
rate.
Introduction
The gear pump is a type of rotary pump that offers the pumping action via the meshing of gears.
The pumping action is conducted through a transfer as well as monitoring of liquids, and it is
also used for the transfer of power from the suction chamber to the impulse chamber. The
transfer of fluid occurs via the casing interior in pockets through the meshing of gears in

pumping fluid to discharge from the suction side under pressure. A gear pump may generate a
very high frequency that in turn enhances the ripples fluctuation of the flow rate of delivery in
the impulse chambers as well as suction (Zhou, Hao, and Hao, 2016).
Such gear pumps may operate on very high differential pressure in a manner in which the outlet
side pressure could be higher than that of inlet pressure. Nonetheless, some clearances enable the
transfer of the dynamic seal parts as well as allowing the fluid to slip back and lower its
efficiency. The significant components of the gear pump include casing, suction, and gear wheel
alongside the delivery pipe. The casing is used in making contacts between the liquid that is to be
moved as well as the gear wheel. The gear wheel pump offers the platform for intermeshing of
two gears that are identical where one of them is linked to driving shaft even as the other one
rotates as a result of the driving shaft (Broerman, White, and Al-Khaldi, 2016). The suction pipes
are made of a circular shape that links to the gear to delivery and suction.
Aim
Examine the performance of a gear pump
Objectives
Understand various components of the gear pump
Compare performance and efficiency of the gear pump
Materials and Methods
Materials
⊘ This is a preview!⊘
Do you want full access?
Subscribe today to unlock all pages.
Trusted by 1+ million students worldwide

FM52 Gear Pump Demonstration Unit
IFD7 Armfield Interface device
Compatible PC with Armfield FM52 software
Procedure
Through controlling the gear pump at a maintained speed at the same time enhancing the back
pressure against which work to be done by the pump
Figure 1
Where ρ is taken as constant (the working fluid is treated as incompressible), g defines the
gravitational acceleration as Q represents the flow rate of volume of fluid as shown by flow
meter while H is the change in the entire head between the outlet and inlet of the pump (Shim et
al., 2017).
The losses if fluid friction in the pump is demonstrated is F as shown in equation 1 and needs a
hydraulic efficiency Eh to be described as:
Eh = Fluidpowerabsorbed ( P1 )
Powersupplied t h egears ( Ph ) ×100 %
Paraphrase This Document
Need a fresh take? Get an instant paraphrase of this document with our AI Paraphraser

The speed, as well as the torque of the motor shaft for Armfield FM22 Gear Pump Unit, is
directly shown using the speed controller which supplies the pump (Broerman, White, and Al-
Khaldi, 2016). Such is after that used in the calculation of the power provided by the motor, P0
with the aid of the equation P0= 2 πnT
60
The general efficiency E0 is calculated as Eh-Em: Eo = Powerabsorbed ( P1 )
Powersupplied t h emotor ( P0 ) × 100 %
Procedure
1. It should be ascertained that the valve is open entirely and the pump set at 80% and
established that the pup begins operation. The sensor display should be checked and
affirmed that the flow rate rises from zero as soon as the pump starts to work.
2. The is selected to take records to the pump settings as well as the readings of the
sensor in the table of results.
3. The needle valve is slightly closed to offer a small deviation in the outlet pressure as well
as flow readings. The icon is selected again.
4. The needle valve is continually closed in small increments and each of the corresponding
readings against time is recorded (Shim et al., 2017).
5. A final set of readings is taken upon the needle valve is fully opened, and then a new
sheet of results is generated using the icon
6. A second set of the readings is made through the opening of the needle valve at minimal
increments to the point where the valve is opened fully
7. The pump is set to 0% and then switched off
Results
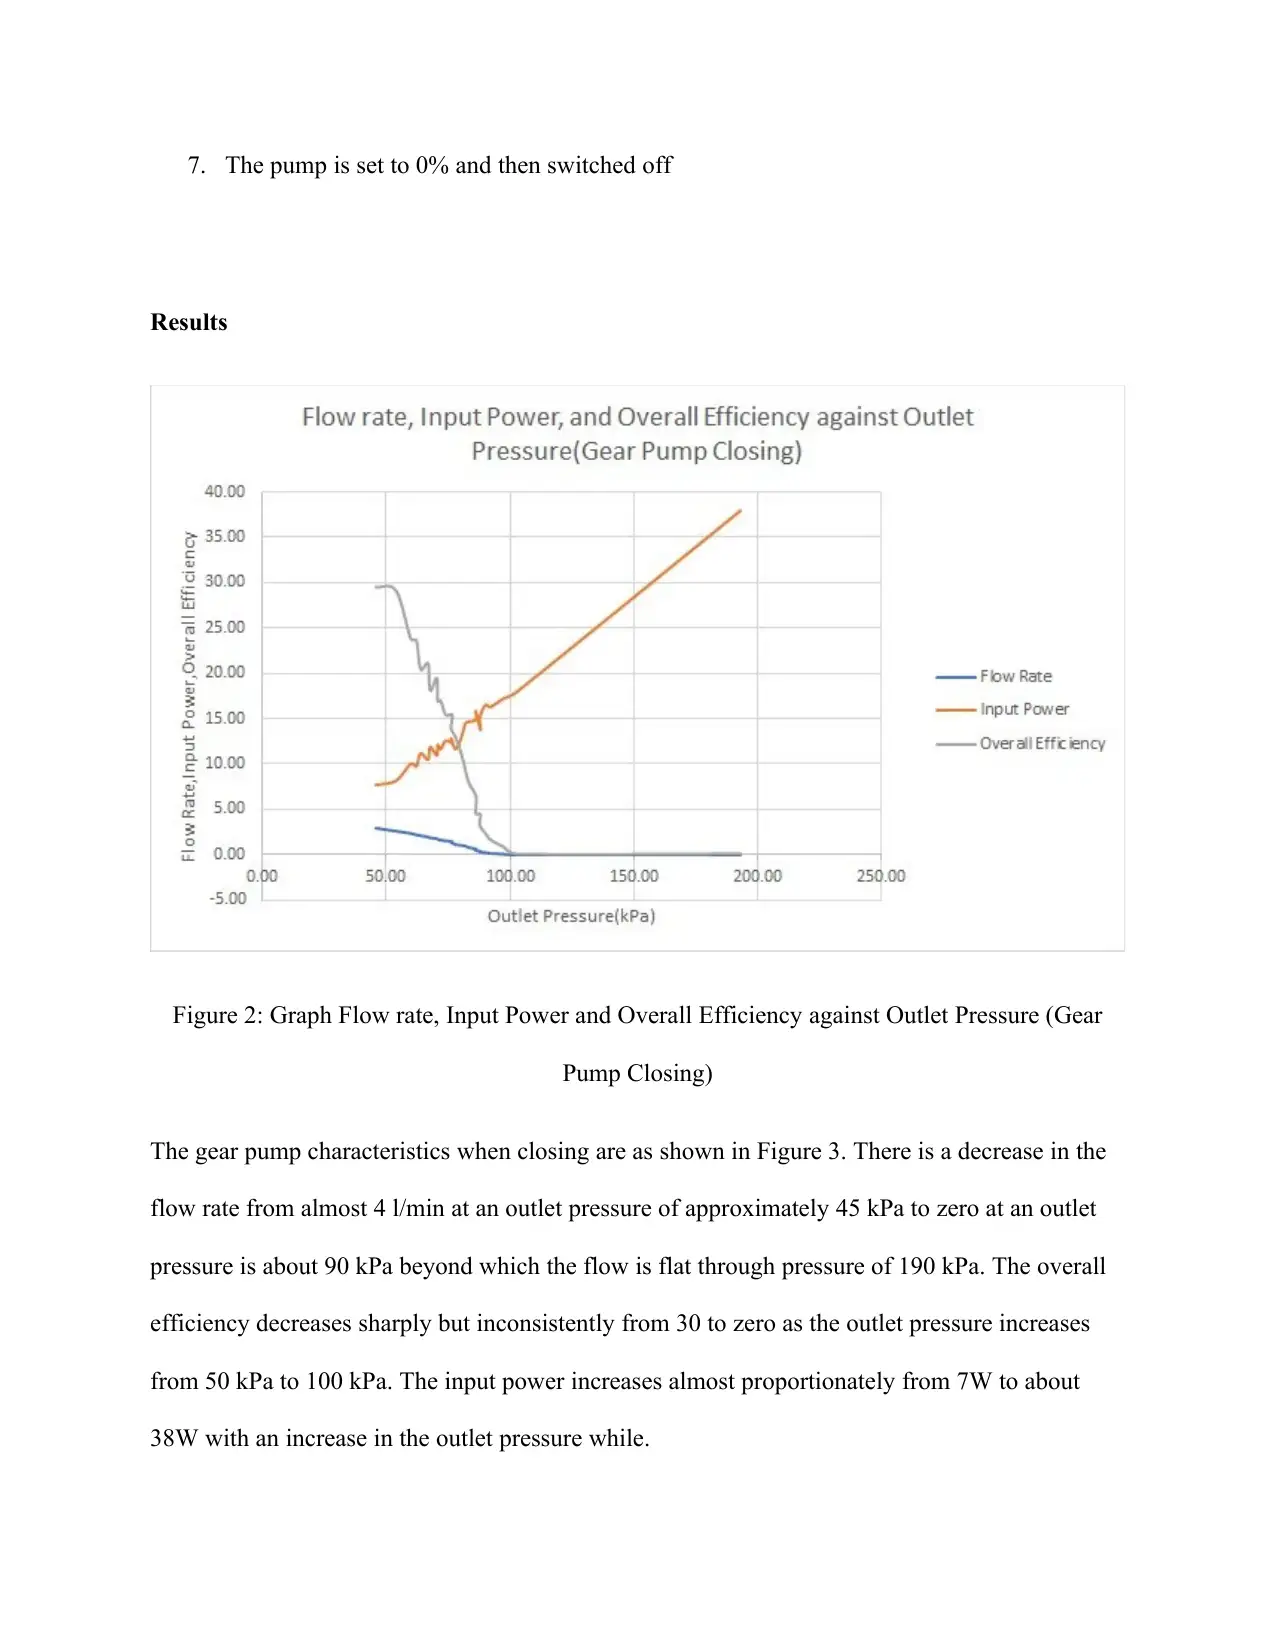
Figure 2: Graph Flow rate, Input Power and Overall Efficiency against Outlet Pressure (Gear
Pump Closing)
The gear pump characteristics when closing are as shown in Figure 3. There is a decrease in the
flow rate from almost 4 l/min at an outlet pressure of approximately 45 kPa to zero at an outlet
pressure is about 90 kPa beyond which the flow is flat through pressure of 190 kPa. The overall
efficiency decreases sharply but inconsistently from 30 to zero as the outlet pressure increases
from 50 kPa to 100 kPa. The input power increases almost proportionately from 7W to about
38W with an increase in the outlet pressure while.
Results
Figure 2: Graph Flow rate, Input Power and Overall Efficiency against Outlet Pressure (Gear
Pump Closing)
The gear pump characteristics when closing are as shown in Figure 3. There is a decrease in the
flow rate from almost 4 l/min at an outlet pressure of approximately 45 kPa to zero at an outlet
pressure is about 90 kPa beyond which the flow is flat through pressure of 190 kPa. The overall
efficiency decreases sharply but inconsistently from 30 to zero as the outlet pressure increases
from 50 kPa to 100 kPa. The input power increases almost proportionately from 7W to about
38W with an increase in the outlet pressure while.
⊘ This is a preview!⊘
Do you want full access?
Subscribe today to unlock all pages.
Trusted by 1+ million students worldwide

Figure 3: Graph of Flow rate, Input Power and Overall Efficiency against Outlet Pressure (Gear
Pump Opening)
The characteristics of the gear pump when opening are as shown in Figure 3. There is a sharp but
inconsistent increase in the overall efficiency from zero to 35 with an increase in the outlet
pressure from zero to about 30 kPa. The input power increases almost proportionately from 7W
to about 38W with an increase in the outlet pressure while the flow rate decreases from about 4
l/min when the outlet pressure is about 45 kPa to zero when the outlet pressure is almost 90 kPa
beyond which the flow remains constant at zero through a pressure of 190 kPa.
Paraphrase This Document
Need a fresh take? Get an instant paraphrase of this document with our AI Paraphraser

Discussion
The characteristics of a gear pump when running under various conditions are noted and
represented in graphs from the experiments conducted. These characteristic curves are essential
in the definition of the properties of the gear pump as just the shape as well as the size may not
be adequate in the selection of a pump for a specific purpose. Standard tests were carried out as
per the procedures outlined in the lab manual and the characteristic curves generated (Ertürk,
Vernet, Castilla, Gamez-Montero and Ferre, 2011).
Initially, the experiment studies the pump characteristics when under closing conditions and the
flow rate, overall efficiency and input power behavior under varied amount of outlet pressure is
noted. It is observed that the input power increases while the other variables: overall efficiency
and flow decrease with an increase in the outlet power. The flow rate in gear pumps is a factor of
the size of the cavity between the gear teeth, the amount of slippage as well as the rotation speed
of the gears (Wan, Lin, Wang and Tang, 2017). There is pressure build-up in as fluid flows from
the inlet to the outlet of a pump.
The second experiment attempts to study the same parameters but when the gear pump is
opening. The changes in the parameters are the same as when the pump was closing as was in
experiment one with the only difference being the behavior of the overall efficiency. The flow
rate decreases from about 4 l/min when the outlet pressure is about 45 kPa to zero when the
outlet pressure is almost 90 kPa beyond which the flow remains constant at zero through
pressure of 190 kPa. When the pump is opening, the build-up pressure reduces and hence

allowing more volume to flow from the inlet to the outlet resulting in a decrease in the flow rate
(Ertürk et al., 2011).
The findings of this experiment concerning the obtained results demonstrate that the analysis
corresponds to the theoretical information regarding the working and principles of operation of
gear pumps. This is evident since the obtained graphs take the nature of the theoretical graph as
shown in Figure 1 (Wan, Lin, Wang and Tang, 2017). The experiment has fulfilled the aims and
objectives of the experiment as it has offered an in-depth comprehension of the performance of
gear pumps.
Conclusion
The input power increases almost proportionately, the flow rate decreases and then remains
constant while the overall efficiency sharply increases and decreases when the pump is closing
and opening respectively with an increase in the outlet pressure of the pump. The results of this
experiment relatively compare with the theoretical and published literature with the obtained
characteristics curves slightly deviating from that in Figure 1. The deviation is as a result of
errors due to the scientific tools and equipment, errors in calculations as well as human error in
the experiment besides differences in the conditions of performing experiment. Gear pumps are
advantageous in comparison to other pumps due to the use even under very low efficiencies, a
characteristic that is not achievable by other pumps.
⊘ This is a preview!⊘
Do you want full access?
Subscribe today to unlock all pages.
Trusted by 1+ million students worldwide

References
Broerman, E., White, B. and Al-Khaldi, F., 2016. Solving a Sever Vibration Problem in the
Downstream Piping of a Gear Pump. In Proceedings of the 32nd International Pump Users
Symposium. Texas A&M University. Turbomachinery Laboratories
Ertürk, N., Vernet, A., Castilla, R., Gamez-Montero, P.J. and Ferre, J.A., 2011. Experimental
analysis of the flow dynamics in the suction chamber of an external gear pump. International
Journal of Mechanical Sciences, 53(2), pp.135-144
Hao, X., Zhou, X., Liu, X. and Sang, X., 2016. Flow characteristics of external gear pump
considering trapped volume. Advances in Mechanical Engineering, 8(10), p.1687814016674100
Shim, S.B., Park, Y.J., Nam, J.S., Kim, S.C., Kim, J.M. and Kim, K.U., 2017. Development of a
rotary clap mechanism for positive-displacement rotary pumps: Pump performance
analysis. International Journal of Precision Engineering and Manufacturing, 18(4), pp.575-585
Wan, Z., Lin, Q., Wang, X. and Tang, Y., 2017. Flow characteristics and heat transfer
performance of half-corrugated microchannels. Applied Thermal Engineering, 123, pp.1140-
1151
Zhou, Y., Hao, S. and Hao, M., 2016. Design and performance analysis of a circular-arc gear
pump operating at high pressure and high speed. Proceedings of the Institution of Mechanical
Engineers, Part C: Journal of Mechanical Engineering Science, 230(2), pp.189-205
Paraphrase This Document
Need a fresh take? Get an instant paraphrase of this document with our AI Paraphraser

Appendix A
Outlet
Pressure
P1
[kPa]
Flow
Rate
Q
[l/min]
Overall
Efficiency
E
[%]
Input
Power
Pe
[W]
45.79 2.97 29.5 7.7
53.87 2.64 29.1 8.2
59.76 2.39 23.8 10.0
62.12 2.23 23.6 9.8
63.80 2.15 20.4 11.2
66.83 1.98 21.0 10.5
67.67 1.90 18.0 11.9
70.36 1.82 19.4 11.0
70.70 1.73 16.8 12.1
71.88 1.65 17.0 11.7
73.90 1.57 15.3 12.6
76.59 1.49 15.3 12.4
76.09 1.40 13.9 12.8
77.94 1.16 12.9 11.7
80.13 1.07 11.2 12.8
81.81 0.99 9.3 14.5
83.33 0.83 7.8 14.7
86.19 0.66 6.4 14.9
86.02 0.50 4.5 15.9
88.04 0.41 4.4 13.8
87.70 0.33 3.2 15.2
90.06 0.25 2.2 16.6
92.08 0.17 1.6 16.3
97.30 0.08 0.8 17.3
102.52 0.00 0.0 17.9
193.08 0.00 0.0 38.0
Table 1: Raw data of outlet pressure against power input Volume Flow Rate, Q (I/min), Overall
Efficiency, E (%) and Input Power, Pe (W)

⊘ This is a preview!⊘
Do you want full access?
Subscribe today to unlock all pages.
Trusted by 1+ million students worldwide
1 out of 12


Your All-in-One AI-Powered Toolkit for Academic Success.
+13062052269
info@desklib.com
Available 24*7 on WhatsApp / Email
![[object Object]](/_next/static/media/star-bottom.7253800d.svg)
Unlock your academic potential
Copyright © 2020–2025 A2Z Services. All Rights Reserved. Developed and managed by ZUCOL.