The Landscape Ecology of Cherry Ballart in La Trobe Wildlife Sanctuary
VerifiedAdded on 2023/06/07
|14
|4410
|343
AI Summary
This report focuses on the landscape ecology of Cherry Ballart in La Trobe University Wildlife Sanctuary. The study was carried out to establish the recovery of native species in the Sanctuary, with Cherry Ballart being the focus. The report provides data on the distribution pattern of Cherry Ballart and its dependence on pre-European River Red gums.
Contribute Materials
Your contribution can guide someone’s learning journey. Share your
documents today.
Running Head: LANDSCAPE ECOLOGY OF CHERRY BALLART
THE LANDSCAPE ECOLOGY OF
CHERRY BALLART IN THE LA
TROBE WILDLIFE SANCTUARY
Name
University
Abstract
Cherry Ballart is a fascinating plant
and its existence provides a rich history
about indigenous plants and animals in
Australia. The main focus in this report is on
Cherry Ballart in La Trobe University
Wildlife Sanctuary. A variety of data about
the plant was collected, including number of
Cherry Ballart trees in the study area, GBH
of each individual plant, and the distance
from each individual plant to the nearest
pre-European Red Gum tree. The data was
analyzed using different statistical tools such
as histograms and K-S test. Results obtained
show that distribution of Cherry Ballart in
the Sanctuary is not random, instead it is
influenced by the distribution of pre-
European River Red gums. This is because
Chery Ballart is a semi-parasitic plant that
depends on a host plant during younger
stages. The K-S test also showed that the
distribution of Cherry Ballart is not normal
hence the null hypothesis is rejected. Last
but not least, the number of small Cherry
Ballart trees was greater than the bigger
ones. This shows that restoration efforts of
this native species in the Sanctuary are
bearing fruits and the entire ecosystem will
benefit.
1. Introduction
Since European settlers left Australia
in the late 18th century, the country has
experienced extensive forest degradation
and deforestation. About 75% of Australia is
Secure Best Marks with AI Grader
Need help grading? Try our AI Grader for instant feedback on your assignments.
LANDSCAPE ECOLOGY OF CHERRY BALLART 2
covered in arid lands and inhospitable
deserts that do not support forest growth. As
a result, forest quality and cover has
significantly declined over the last six
decades, threatening the biodiversity of
native species. It is estimated that the
country has lost 40% of its forests
(Bradshaw, 2012). Victoria is termed as the
state that has lost the largest percentage of
its native vegetation since European
colonization. The state has lost nearly 66%
of its native vegetation since then (Turner,
Pressey, & Levin, 2009). This has been
contributed by various factors such as
increased human population,
industrialization, urban development,
climate change and other human activities
(Deo, Links between native forest and
climate in Australia, 2011); (Deo, Syktus, &
McAlpine, Impact of historical land cover
change on daily indices of climate extremes
including droughts in eastern Australia,
2009); (Meers, Enright, Bell, & Kasel,
2012). As a result, many indigenous plant
species in Australia have been lost (Guerin
& Lowe, 2012) and those remaining are
under threat (Bennett, et al., 2013); (Tozer,
Leishman, & Auld, 2014). But one of the
endangered native species that have endured
all these challenges is Cherry Ballart. This
plant species is the focus of this study.
Cherry Ballart (Exocarpos
cupressiformis) is one of the fascinating
plant species in Australia. The plant
resembles cypress tree but has small juicy
and sweet fruits (cherries). It has
inconspicuous flowers bunched on short
thorns. A fruit is formed from one flower on
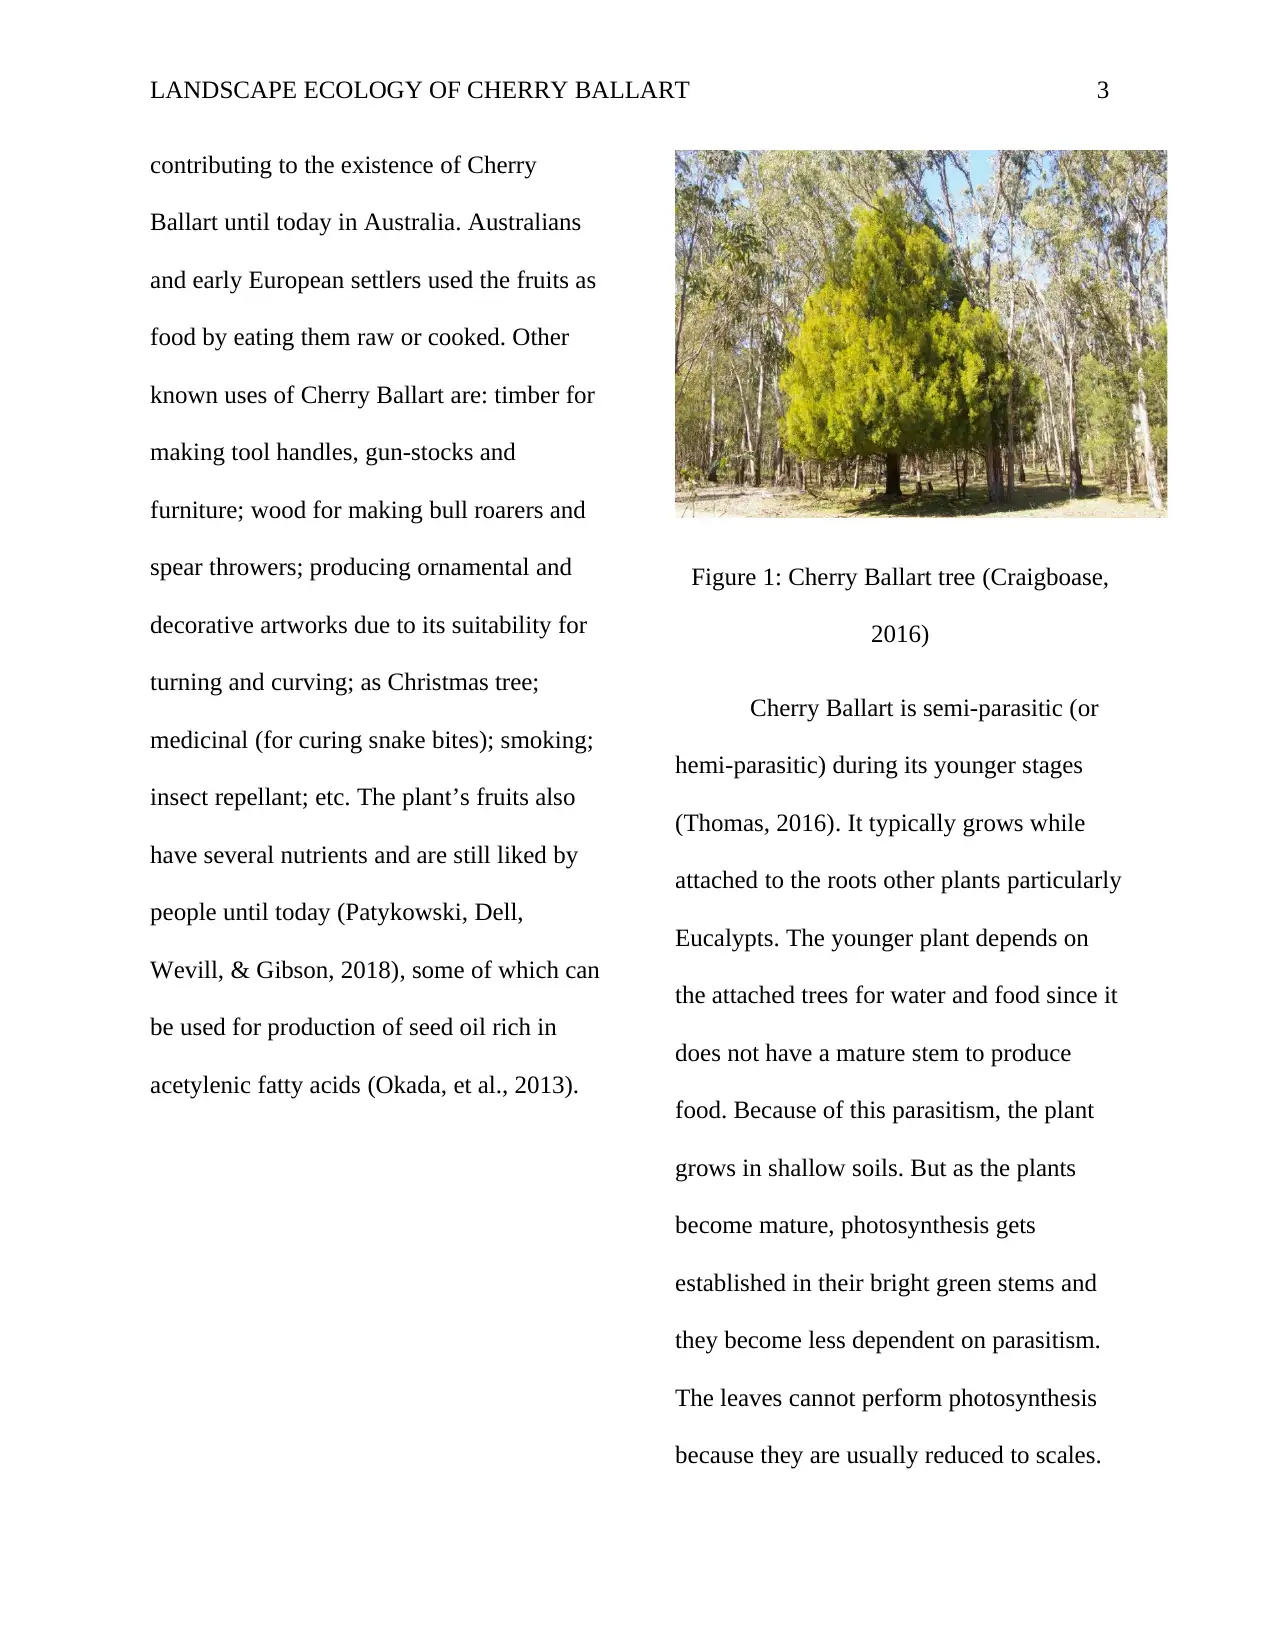
every thorn (Skraskova, 2018). The plant is
pyramidal in shape and usually 3 to 8 m tall,
as shown in Figure 1 below. It usually grows
in dry eucalypt woodland. Most of the
Australian forests are classified as either low
eucalypt forests or high eucalypt forests
(Australian Bureau of Rural Sciences, 2010).
This is one of factors that may be
covered in arid lands and inhospitable
deserts that do not support forest growth. As
a result, forest quality and cover has
significantly declined over the last six
decades, threatening the biodiversity of
native species. It is estimated that the
country has lost 40% of its forests
(Bradshaw, 2012). Victoria is termed as the
state that has lost the largest percentage of
its native vegetation since European
colonization. The state has lost nearly 66%
of its native vegetation since then (Turner,
Pressey, & Levin, 2009). This has been
contributed by various factors such as
increased human population,
industrialization, urban development,
climate change and other human activities
(Deo, Links between native forest and
climate in Australia, 2011); (Deo, Syktus, &
McAlpine, Impact of historical land cover
change on daily indices of climate extremes
including droughts in eastern Australia,
2009); (Meers, Enright, Bell, & Kasel,
2012). As a result, many indigenous plant
species in Australia have been lost (Guerin
& Lowe, 2012) and those remaining are
under threat (Bennett, et al., 2013); (Tozer,
Leishman, & Auld, 2014). But one of the
endangered native species that have endured
all these challenges is Cherry Ballart. This
plant species is the focus of this study.
Cherry Ballart (Exocarpos
cupressiformis) is one of the fascinating
plant species in Australia. The plant
resembles cypress tree but has small juicy
and sweet fruits (cherries). It has
inconspicuous flowers bunched on short
thorns. A fruit is formed from one flower on
every thorn (Skraskova, 2018). The plant is
pyramidal in shape and usually 3 to 8 m tall,
as shown in Figure 1 below. It usually grows
in dry eucalypt woodland. Most of the
Australian forests are classified as either low
eucalypt forests or high eucalypt forests
(Australian Bureau of Rural Sciences, 2010).
This is one of factors that may be
LANDSCAPE ECOLOGY OF CHERRY BALLART 3
contributing to the existence of Cherry
Ballart until today in Australia. Australians
and early European settlers used the fruits as
food by eating them raw or cooked. Other
known uses of Cherry Ballart are: timber for
making tool handles, gun-stocks and
furniture; wood for making bull roarers and
spear throwers; producing ornamental and
decorative artworks due to its suitability for
turning and curving; as Christmas tree;
medicinal (for curing snake bites); smoking;
insect repellant; etc. The plant’s fruits also
have several nutrients and are still liked by
people until today (Patykowski, Dell,
Wevill, & Gibson, 2018), some of which can
be used for production of seed oil rich in
acetylenic fatty acids (Okada, et al., 2013).
Figure 1: Cherry Ballart tree (Craigboase,
2016)
Cherry Ballart is semi-parasitic (or
hemi-parasitic) during its younger stages
(Thomas, 2016). It typically grows while
attached to the roots other plants particularly
Eucalypts. The younger plant depends on
the attached trees for water and food since it
does not have a mature stem to produce
food. Because of this parasitism, the plant
grows in shallow soils. But as the plants
become mature, photosynthesis gets
established in their bright green stems and
they become less dependent on parasitism.
The leaves cannot perform photosynthesis
because they are usually reduced to scales.
LANDSCAPE ECOLOGY OF CHERRY BALLART 4
Fruits of Cherry Ballart are attached
to colourful pedicels that attract birds. The
greenish, hard fruit is inedible when unripe.
When it matures, the fruit turns red or
yellowish and becomes an edible cherry.
The bird’s digestive juices weaken the hard
nut thus enabling easy germination of the
internal seed. The plant can also regenerate
from damaged or cut stumps and scatters
several suckers. Germination of the plant
also takes place through propagation of the
seed with Lucerne (Medicago sativa) and
Kangaroo Grass (Themeda triandra)
(Craigboase, 2016).
Even though Cherry Ballart may be
seen as an undesirable shrub, it plays a
critical role in native ecosystem particularly
as a source of food mammals and birds and
its nutrient-rich leaf litter is important in
nutrient-recycling. Previous studies have
shown that the number of birds in Australian
woodlands has declined significantly due to
deforestation and decline in forest cover
(Paton & O'Connor, 2009); (Sodhi, Brook,
Bradshaw, & Levin, 2009).
2. Material and Methods
The study area in this report was La
Trobe University Wildlife Sanctuary,
located on Melbourne (Bundoora) Campus.
The Sanctuary was created in 1967, the
same year that La Trobe University was
founded, as a project to restore and manage
indigenous fauna and flora (La Trobe
University, 2018a). The Sanctuary is now
over 50 years old and provides an
opportunity for the university community,
local residents and visitors to learn about
and experience biodiversity and natural
history of a broad variety of plants and
animal species (La Trobe University,
2018b). It is a remnant of River Red Gum
Plains Grassy Woodland, a much depleted
ecosystem in the north of Melbourne due to
urbanization, agriculture and commercial
developments. Even though the largest
portion of the Sanctuary has been re-
Secure Best Marks with AI Grader
Need help grading? Try our AI Grader for instant feedback on your assignments.
LANDSCAPE ECOLOGY OF CHERRY BALLART 5
vegetated, there are some pre-European trees
that still exist. Therefore the Sanctuary
currently contains a combination of
recovering and remnant natural vegetation.
This Sanctuary plays a big role as far as
regional conservation and biodiversity
protection is concerned because it provides
habitat, protects indigenous species,
provides organisms with food, and it is used
as a habitat passageway. Additionally, the
Sanctuary offers ecosystem services
including improving water quality, carbon
capture and it is also a vital amenity for the
University population.
This study was carried out bearing in
mind that the Sanctuary has been largely
cleared and is now set for conservation of
different species of plants and animals,
especially indigenous species. Therefore it
was important to carry out a study so as to
establish the recovery of native species in
the Sanctuary. The species selected for the
study was Cherry Ballart (Exocarpos
cupressiformis). The study entailed
establishing the landscape ecology of this
species.
We visited the block we had been
assigned on the site section of the Sanctuary
where to assess the population of Cherry
Ballart. Before commencing the actual
count, we familiarized ourselves with the
target species so as to establish if we could
easily distinguish it from other similar
species such as Black Sheoak
(Allocasuarina littoralis). We started
counting the number of Cherry Ballart plants
(both juveniles and adults) in each sub-
block. When we identified an individual
plant, we measured its girth at breast height
(GBH) and recorded the measurement in
centimeters (cm). GBH was taken to
represent age of the plant. When the plant
was shorter than 150 cm, we recorded the
measured GHB as 1 cm. The aim of this
measurement was to establish the population
of Cherry Ballart in the Wildlife Sanctuary
LANDSCAPE ECOLOGY OF CHERRY BALLART 6
and their age (which was represented by
size).
For every Cherry Ballart located, we
measured the distance from the tree to the
trunk of the closest pre-European Red Gum
tree and recorded the measurement in meters
(m). It is assumed that trees with a GHB of
314 cm has a diameter at breast height
(DBH) of 100 cm had been growing during
or near the European settlement time.
However, trees with GBH less than 314 cm
are most likely to have recruited after the
time of settlement, probably during the last
50 years when the La Trobe University
Wildlife Sanctuary was created. When the
distance from an individual Cherry Ballart to
the nearest European Red Gum tree was
greater 100 m, it was recorded as 120 m.
To establish if distribution of Cherry
Ballart in the reserve is non-random (i.e. is
influenced by the big trees), we chose
several pre-determined random points from
the GPS’s Find-GoTo function and
measured the distance between individual
point and the closest pre-European Red Gum
tree and recorded it in meters (m).
We carried out this counting and
measurement in different years. The first
count was done on Wednesday 22nd August
2017 while the second count was done on
Wednesday 21st August 2018. 84 and 120
trees were counted and measured in the
2017 and 2018 experiments respectively.
The raw data of Cherry Ballart GBH (cm),
DBH (cm), distance of observed Cherry
Ballart to nearest pre-European tree (m), and
distance of random point to pre-European
Red Gum tree (m) was recorded and is
provided in the Excel sheets.
The next step was to determine the
distribution pattern of Cherry Ballart and
test whether the species was more clustered
to the pre-European Red Gum than random
points. To do this, we created a histogram of
the frequency of observed Cherry Ballart vs.
distance from nearest pre-European Red
LANDSCAPE ECOLOGY OF CHERRY BALLART 7
Gum. The distance classes used had an
interval of 10 m. We also created a second
histogram of the frequency of random points
vs. distance from nearest pre-European Red
Gum. The distance classes used also had an
interval of 10 m. After creating the
histograms, we used two-sample
Kolmogorov-Smirnov (K-S) test to analyze
the frequency distribution of distances to the
nearest pre-European Red Gum of the
observed population of Cherry Ballart vs.
random points. Two-sample K-S test is a Z
nonparametric statistic that quantifies the
empirical distribution functions of two
samples (Antoneli, Passos, Lopes, &
Briones, 2018). This is one of the most
accurate and reliable non-parametric
techniques of comparing distribution of two
samples (Krzanowski & Hand, 2011). We
ran the K-S test in Excel. K-S test is a
statistical tool used for testing two samples
to determine if they are of the same
distribution (Zaiontz, Real Statistics Using
Excel, 2014).
3. Results
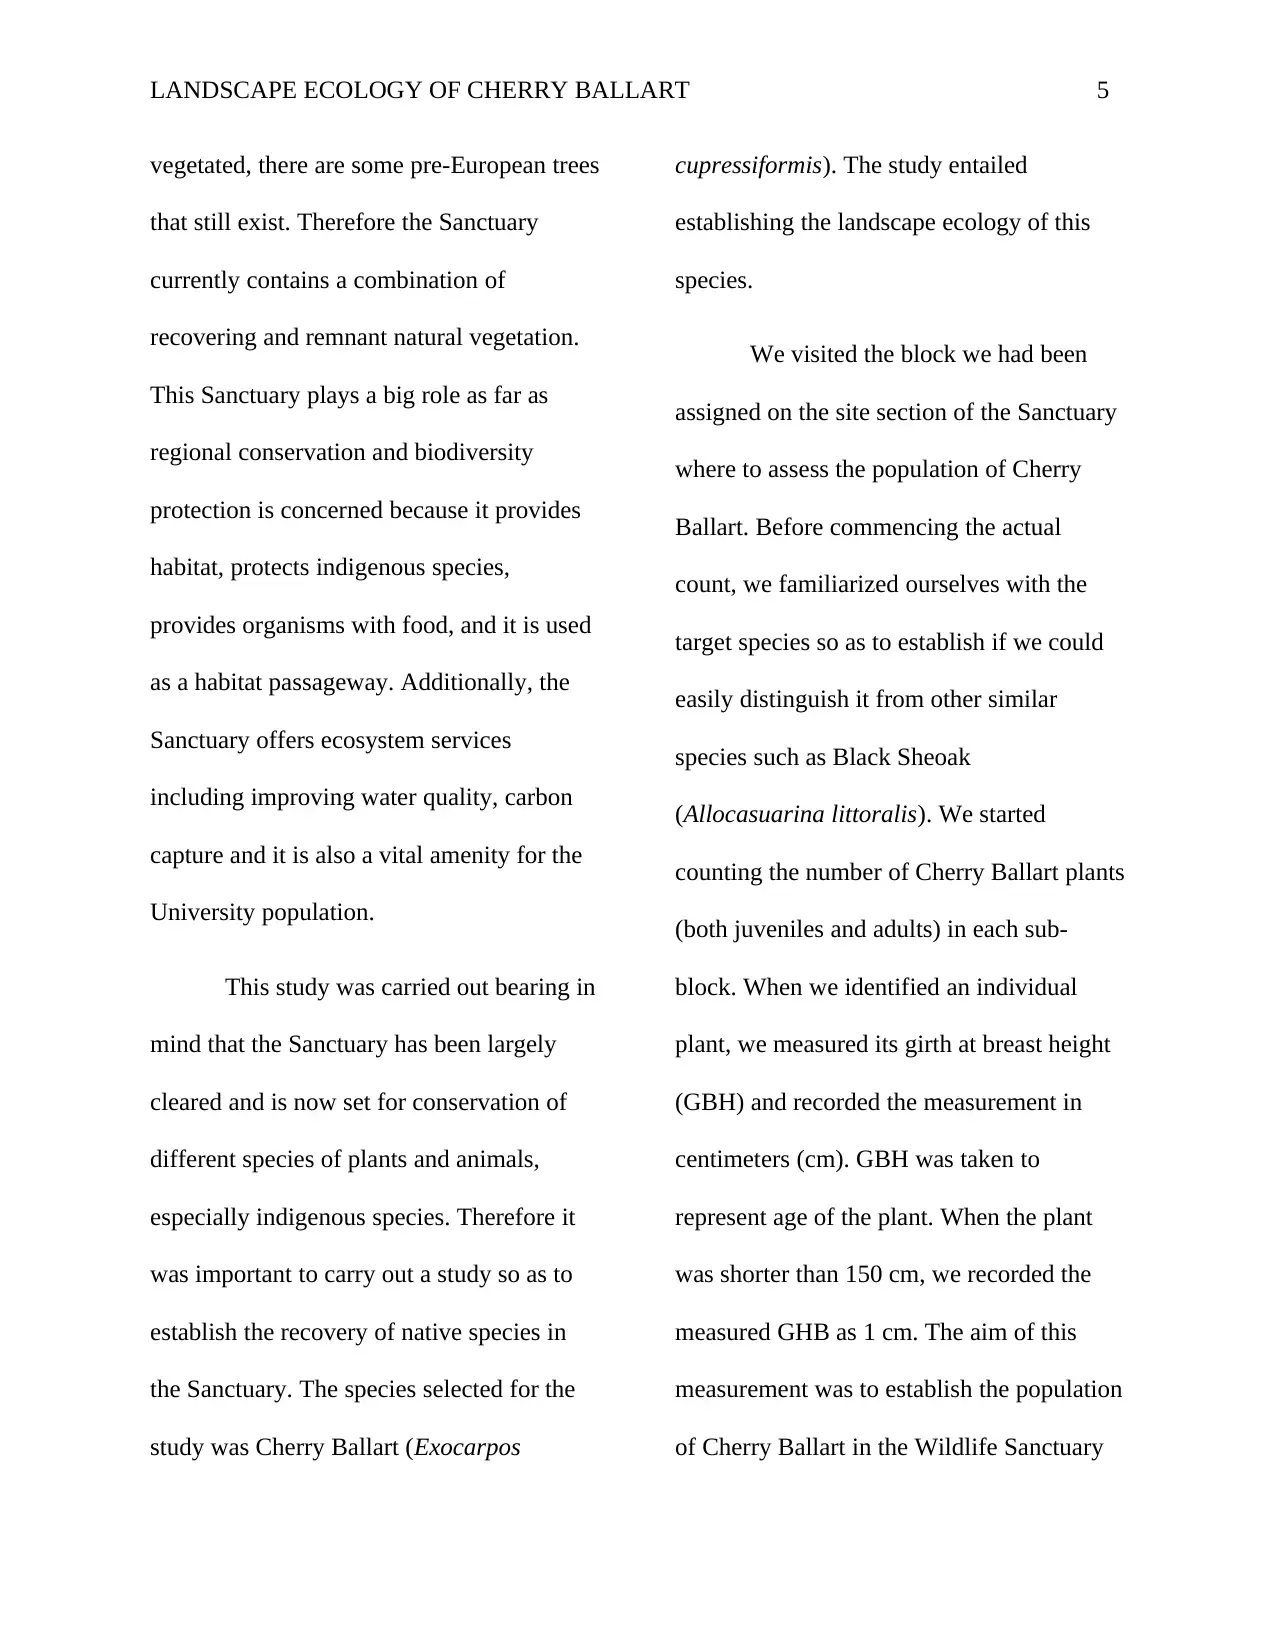
3.1. Distribution Patterns
The distance classes of the
histograms are expressed in exclusive form,
i.e. 0 – 10, 10 – 20, 20 – 30, etc. For the first
class interval (0 – 10), it means all values
from 0 and less than 10 while the second
class interval (10 – 20) means all values
from 10 but less than 20. The distribution
histograms from the data collected are
provided below
0-10 10-20 20-30 30-40 40-50 50-60 60-70 70-80 8
0
5
10
15
20
25
30
35
40
Frequency Histogram for Distance
Cherry Ballart to Nearest pre-Eu
Distance to Nearst pre-European
Frequency
Gum. The distance classes used had an
interval of 10 m. We also created a second
histogram of the frequency of random points
vs. distance from nearest pre-European Red
Gum. The distance classes used also had an
interval of 10 m. After creating the
histograms, we used two-sample
Kolmogorov-Smirnov (K-S) test to analyze
the frequency distribution of distances to the
nearest pre-European Red Gum of the
observed population of Cherry Ballart vs.
random points. Two-sample K-S test is a Z
nonparametric statistic that quantifies the
empirical distribution functions of two
samples (Antoneli, Passos, Lopes, &
Briones, 2018). This is one of the most
accurate and reliable non-parametric
techniques of comparing distribution of two
samples (Krzanowski & Hand, 2011). We
ran the K-S test in Excel. K-S test is a
statistical tool used for testing two samples
to determine if they are of the same
distribution (Zaiontz, Real Statistics Using
Excel, 2014).
3. Results
3.1. Distribution Patterns
The distance classes of the
histograms are expressed in exclusive form,
i.e. 0 – 10, 10 – 20, 20 – 30, etc. For the first
class interval (0 – 10), it means all values
from 0 and less than 10 while the second
class interval (10 – 20) means all values
from 10 but less than 20. The distribution
histograms from the data collected are
provided below
0-10 10-20 20-30 30-40 40-50 50-60 60-70 70-80 8
0
5
10
15
20
25
30
35
40
Frequency Histogram for Distance
Cherry Ballart to Nearest pre-Eu
Distance to Nearst pre-European
Frequency
Paraphrase This Document
Need a fresh take? Get an instant paraphrase of this document with our AI Paraphraser
LANDSCAPE ECOLOGY OF CHERRY BALLART 8
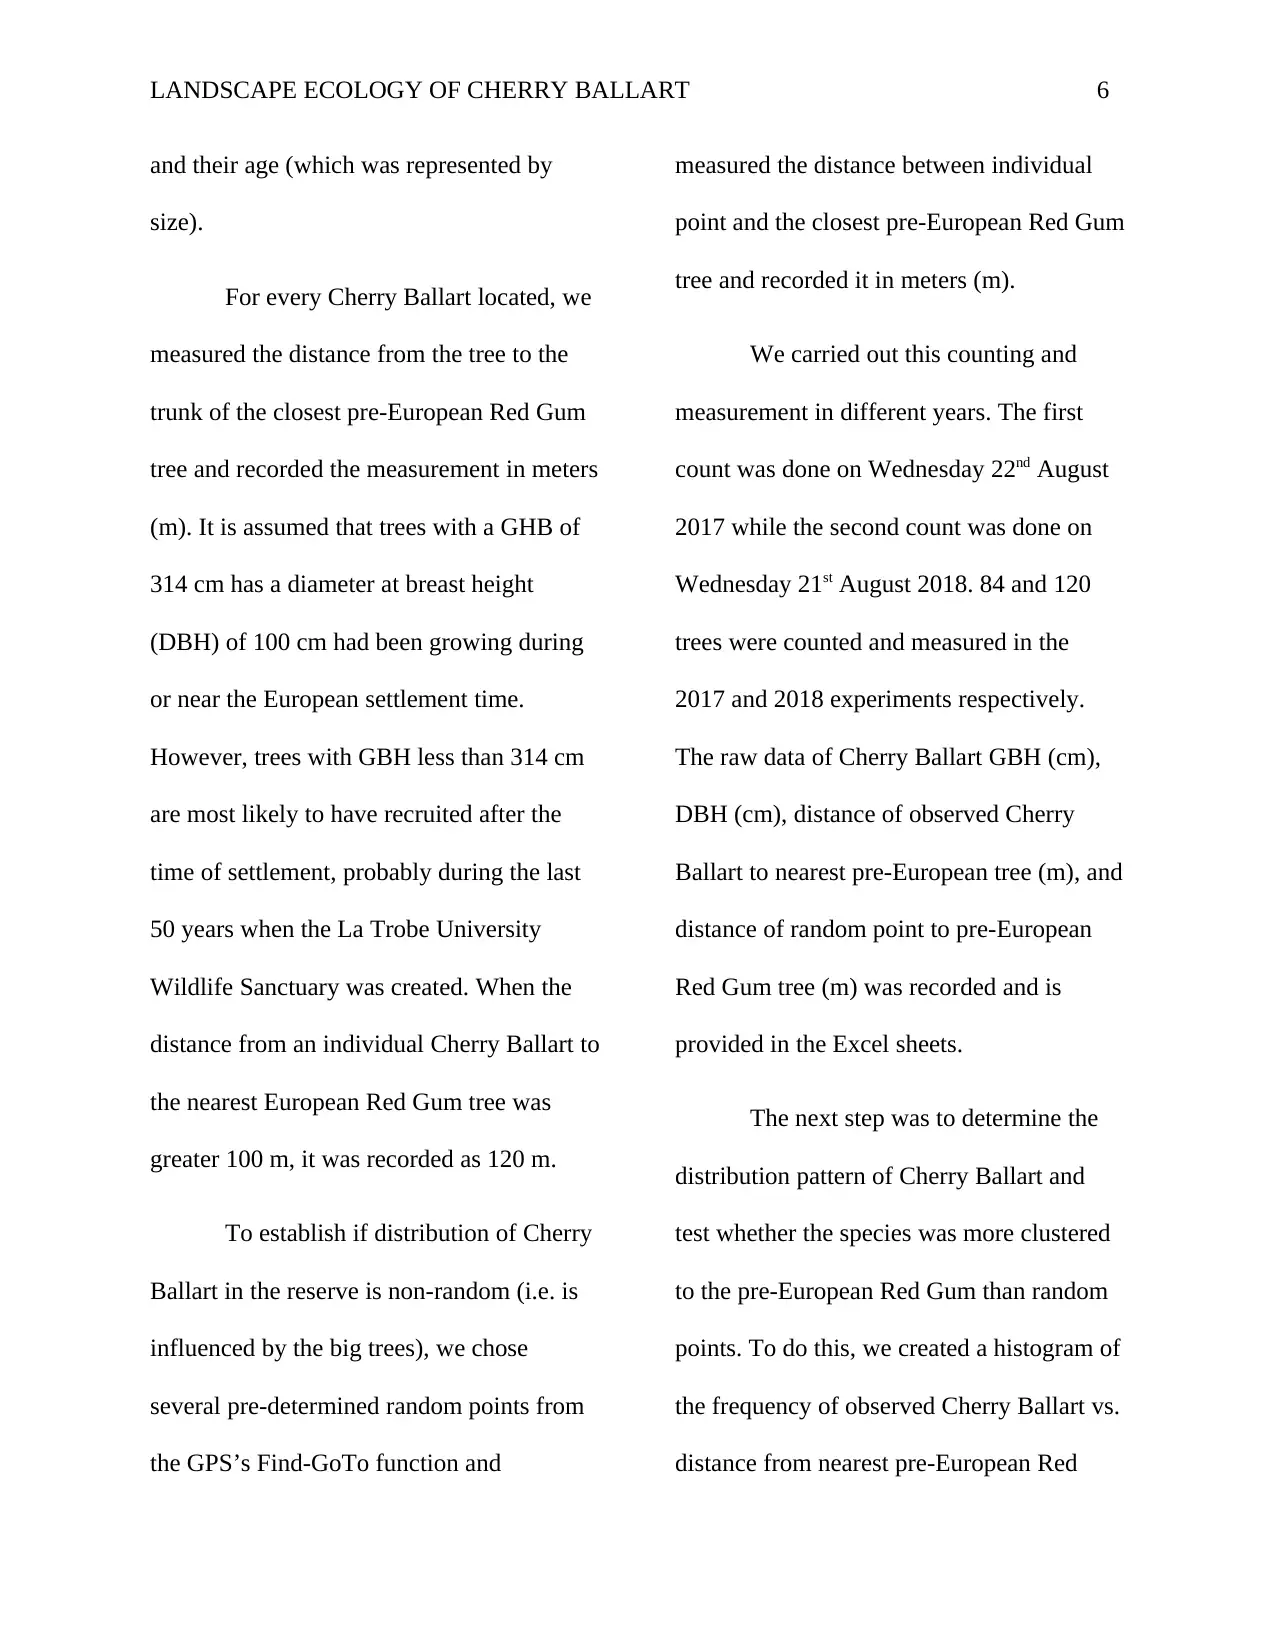
Figure 2: Histogram of Frequency of
Observed Cherry Ballart vs. Distance from
Pre-European Tree in 2017
0-10 10-20 20-30 30-40 40-50 50-60 60-70 70-80 80-90 90-100 100-
110 110-
120 120-
130
0
2
4
6
8
10
12
Frequency Histogram for Distance of Random Point to
Nearest pre-European Tree
Distance to Nearest pre-European Tree
Frequency
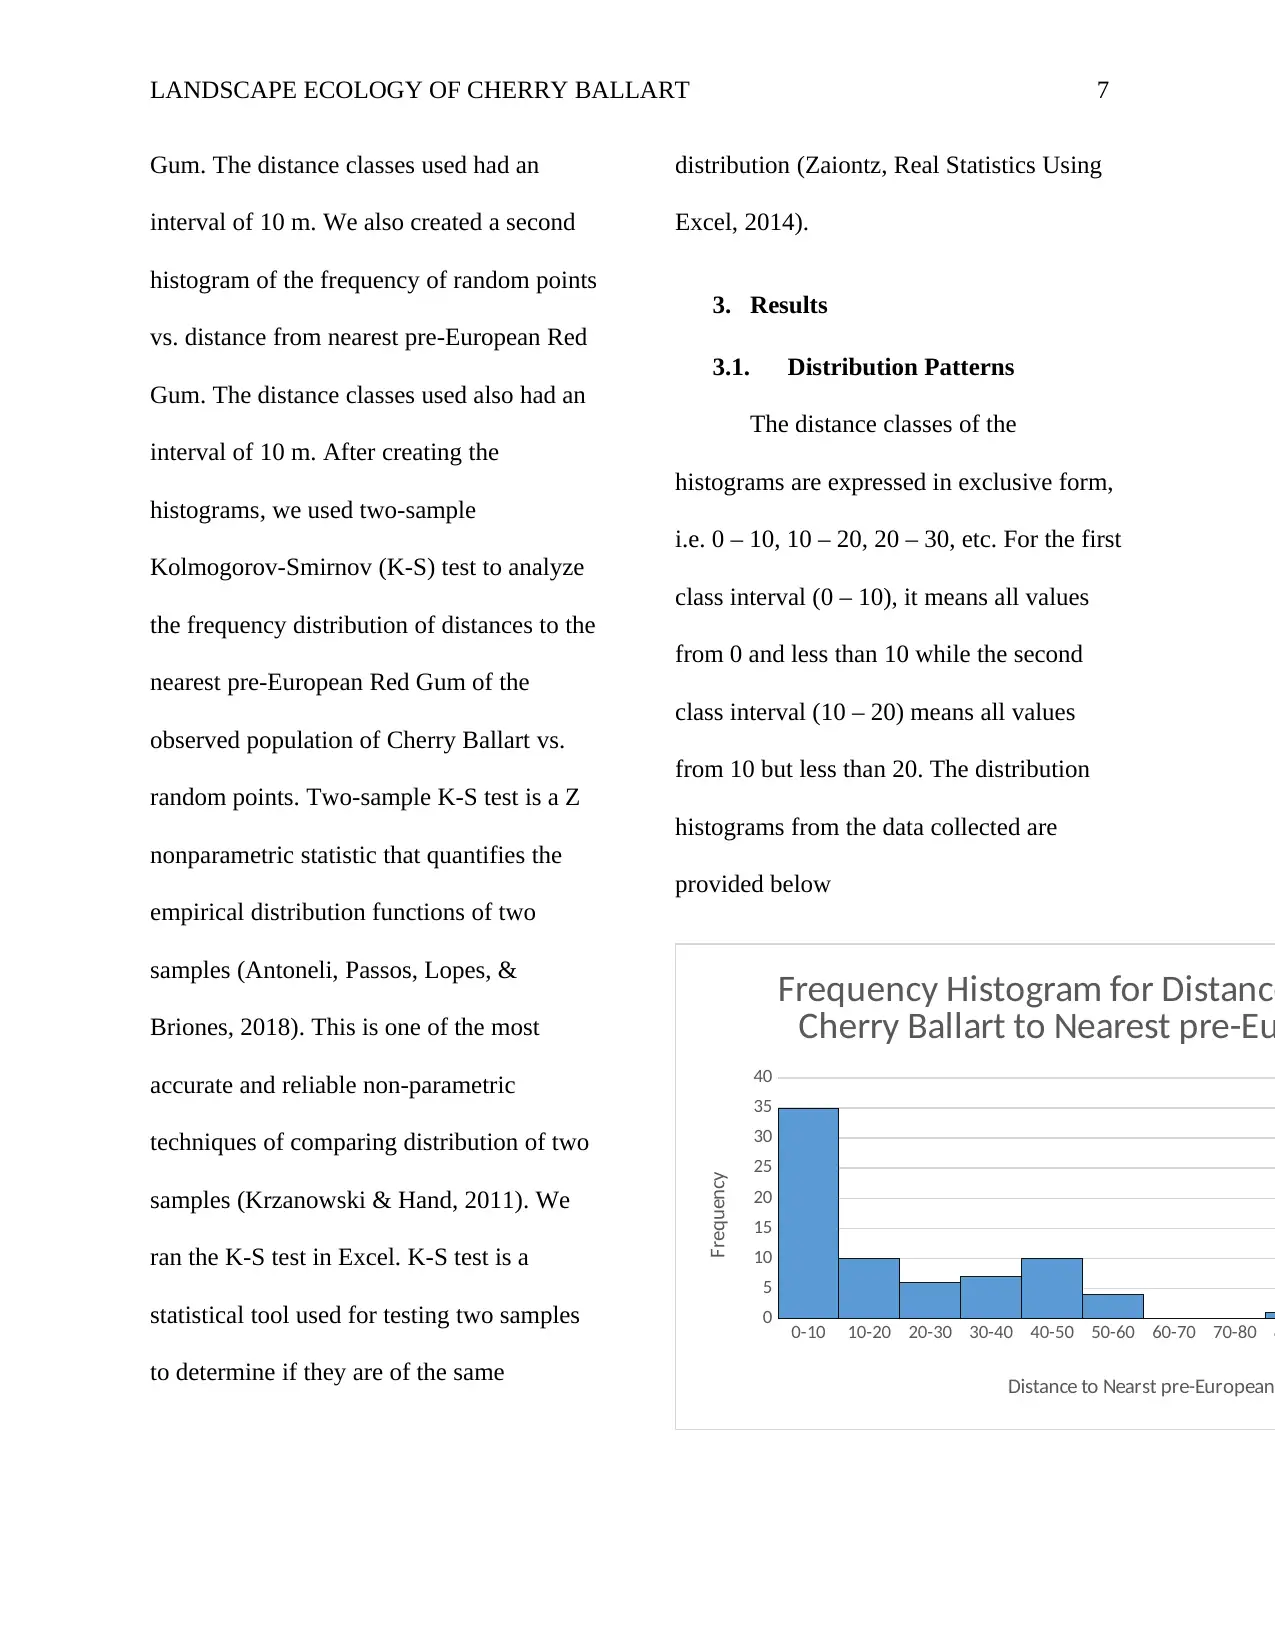
Figure 3: Histogram of Frequency of
Random Points vs. Distance from Pre-
European Tree in 2017
0-10 10-20 20-30 30-40 40-50 50-60 60-70 70-80 80-9
0
5
10
15
20
25
30
35
40
45
50
Frequency Histogram for Distance of Obs
Ballart to Nearest pre-European
Distance to pre-European Tree
Frequency
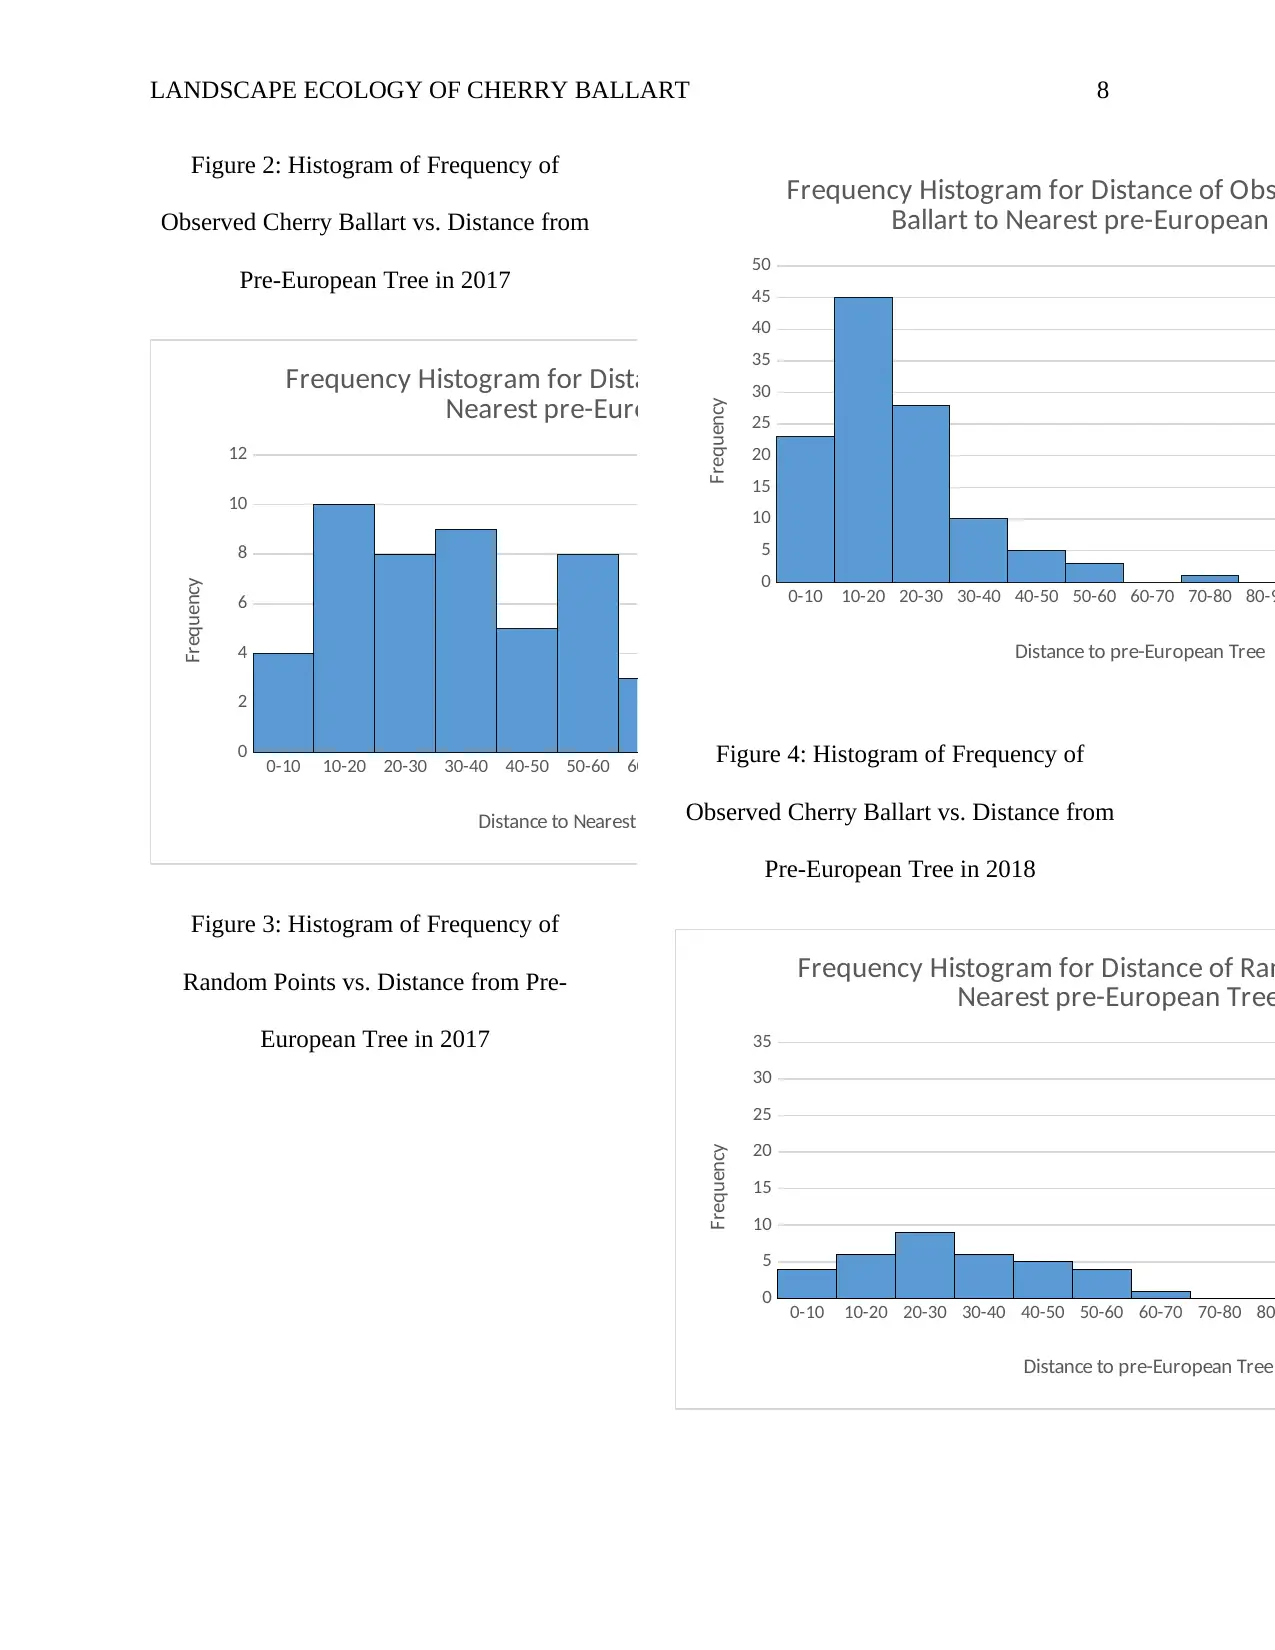
Figure 4: Histogram of Frequency of
Observed Cherry Ballart vs. Distance from
Pre-European Tree in 2018
0-10 10-20 20-30 30-40 40-50 50-60 60-70 70-80 80
0
5
10
15
20
25
30
35
Frequency Histogram for Distance of Ran
Nearest pre-European Tree
Distance to pre-European Tree
Frequency
Figure 2: Histogram of Frequency of
Observed Cherry Ballart vs. Distance from
Pre-European Tree in 2017
0-10 10-20 20-30 30-40 40-50 50-60 60-70 70-80 80-90 90-100 100-
110 110-
120 120-
130
0
2
4
6
8
10
12
Frequency Histogram for Distance of Random Point to
Nearest pre-European Tree
Distance to Nearest pre-European Tree
Frequency
Figure 3: Histogram of Frequency of
Random Points vs. Distance from Pre-
European Tree in 2017
0-10 10-20 20-30 30-40 40-50 50-60 60-70 70-80 80-9
0
5
10
15
20
25
30
35
40
45
50
Frequency Histogram for Distance of Obs
Ballart to Nearest pre-European
Distance to pre-European Tree
Frequency
Figure 4: Histogram of Frequency of
Observed Cherry Ballart vs. Distance from
Pre-European Tree in 2018
0-10 10-20 20-30 30-40 40-50 50-60 60-70 70-80 80
0
5
10
15
20
25
30
35
Frequency Histogram for Distance of Ran
Nearest pre-European Tree
Distance to pre-European Tree
Frequency
LANDSCAPE ECOLOGY OF CHERRY BALLART 9
Figure 5: Histogram of Frequency of
Random Points vs. Distance from Pre-
European Tree in 2018
3.2. K-S Test
The null hypothesis in this study was
that distributions of Cherry Ballart were the
same as those of Random Point
distributions. The value of Dn (biggest value
in column G from the K-S test in the Excel
file) is 0.205924. The distribution of the data
is said to be normal is the critical value Dn,α
is greater than Dn (Zaiontz, Kolmogorov-
Smirnov Test for Normality, 2018). From
the K-S Table, the value of Dn,α is obtained
as follows:
Dn,α = D120,0.05 = 1.36
√120 = 1.36
10.9545 =0.12415
Since Dn = 0.205924 > 0.12415 = Dn,α, it
means that the pattern of the data is not
normal distribution. Therefore the null
hypothesis that the data for the Cherry
Ballart are normally distributed is rejected.
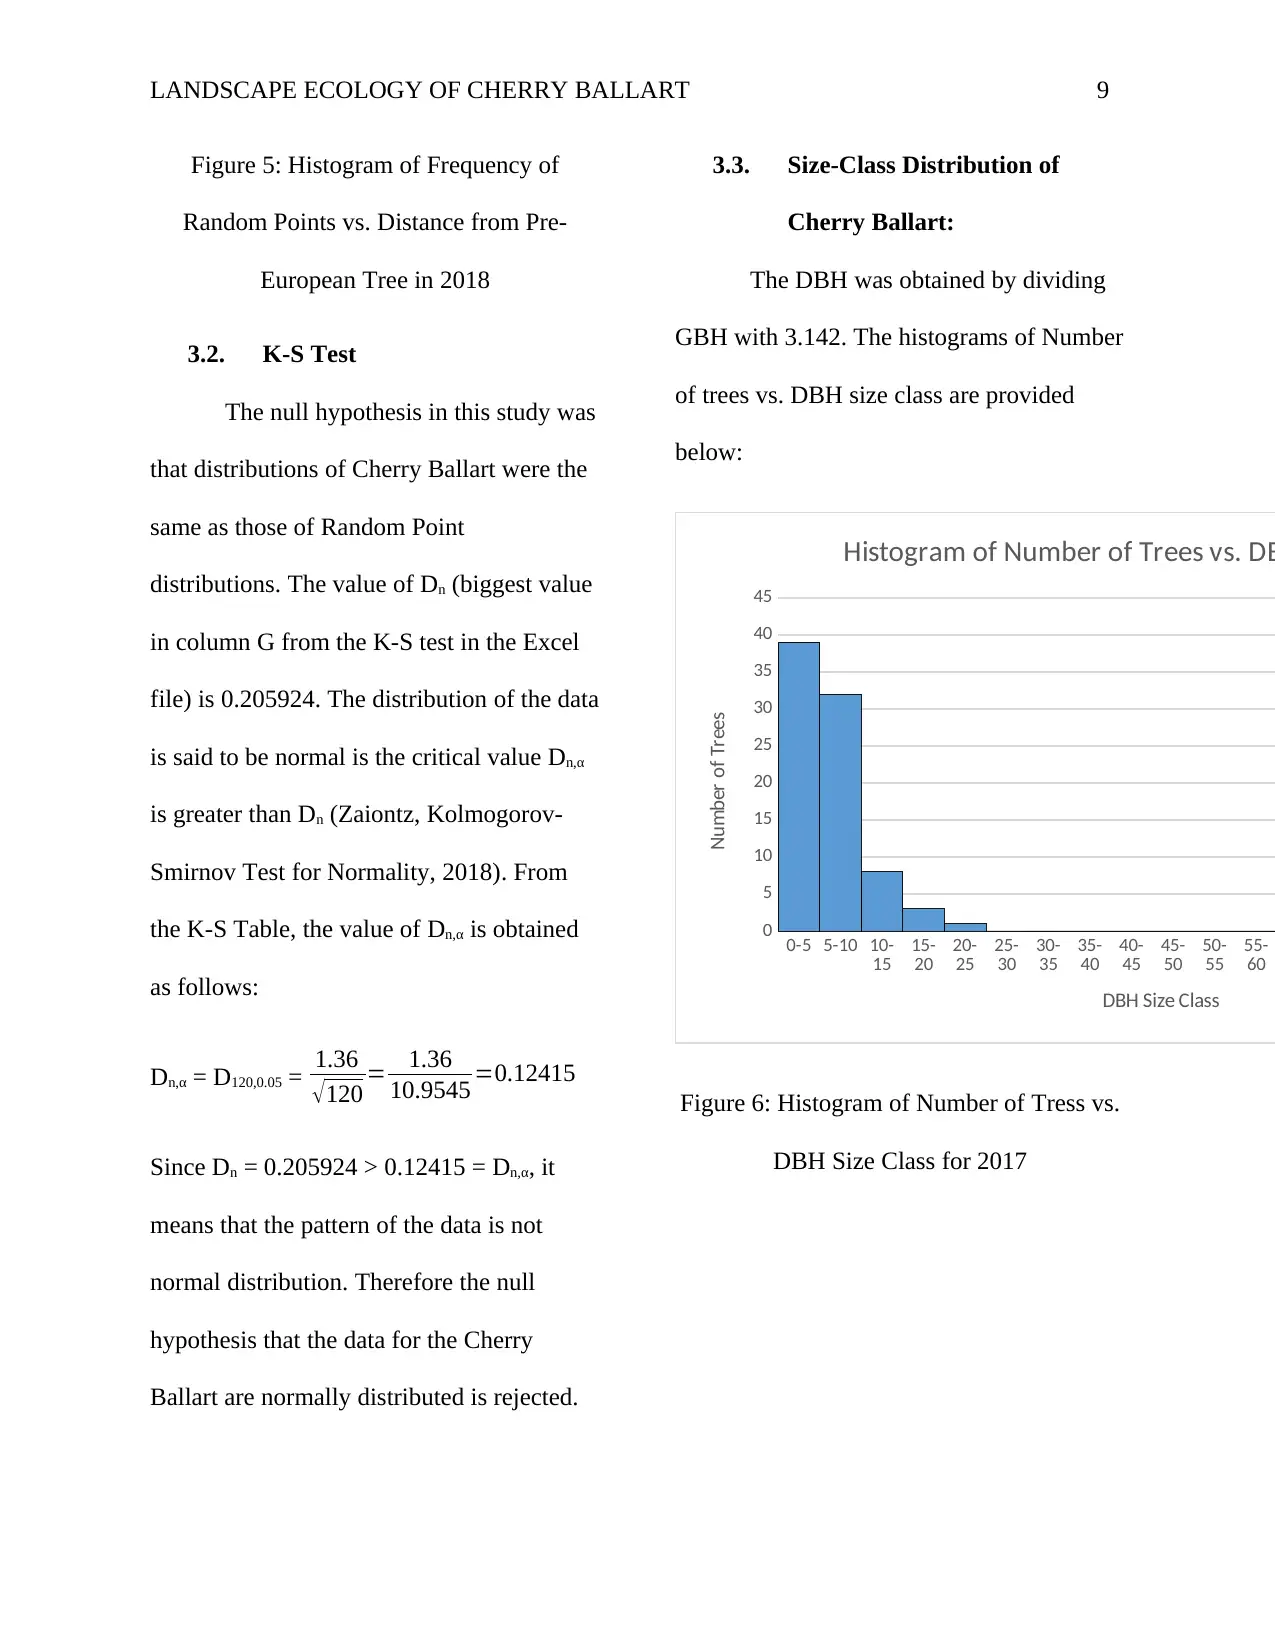
3.3. Size-Class Distribution of
Cherry Ballart:
The DBH was obtained by dividing
GBH with 3.142. The histograms of Number
of trees vs. DBH size class are provided
below:
0-5 5-10 10-
15 15-
20 20-
25 25-
30 30-
35 35-
40 40-
45 45-
50 50-
55 55-
60
0
5
10
15
20
25
30
35
40
45
Histogram of Number of Trees vs. DB
DBH Size Class
Number of Trees
Figure 6: Histogram of Number of Tress vs.
DBH Size Class for 2017
Figure 5: Histogram of Frequency of
Random Points vs. Distance from Pre-
European Tree in 2018
3.2. K-S Test
The null hypothesis in this study was
that distributions of Cherry Ballart were the
same as those of Random Point
distributions. The value of Dn (biggest value
in column G from the K-S test in the Excel
file) is 0.205924. The distribution of the data
is said to be normal is the critical value Dn,α
is greater than Dn (Zaiontz, Kolmogorov-
Smirnov Test for Normality, 2018). From
the K-S Table, the value of Dn,α is obtained
as follows:
Dn,α = D120,0.05 = 1.36
√120 = 1.36
10.9545 =0.12415
Since Dn = 0.205924 > 0.12415 = Dn,α, it
means that the pattern of the data is not
normal distribution. Therefore the null
hypothesis that the data for the Cherry
Ballart are normally distributed is rejected.
3.3. Size-Class Distribution of
Cherry Ballart:
The DBH was obtained by dividing
GBH with 3.142. The histograms of Number
of trees vs. DBH size class are provided
below:
0-5 5-10 10-
15 15-
20 20-
25 25-
30 30-
35 35-
40 40-
45 45-
50 50-
55 55-
60
0
5
10
15
20
25
30
35
40
45
Histogram of Number of Trees vs. DB
DBH Size Class
Number of Trees
Figure 6: Histogram of Number of Tress vs.
DBH Size Class for 2017
LANDSCAPE ECOLOGY OF CHERRY BALLART 10
0-5 5-10 10-15 15-20 20-25 25-30 30-35 35-40 40-45 45-50 50-55 55-60
0
5
10
15
20
25
30
35
40
45
50
Histogram of Number of Tress vs. DBH Size Class
DBH Size Class
Number of Trees
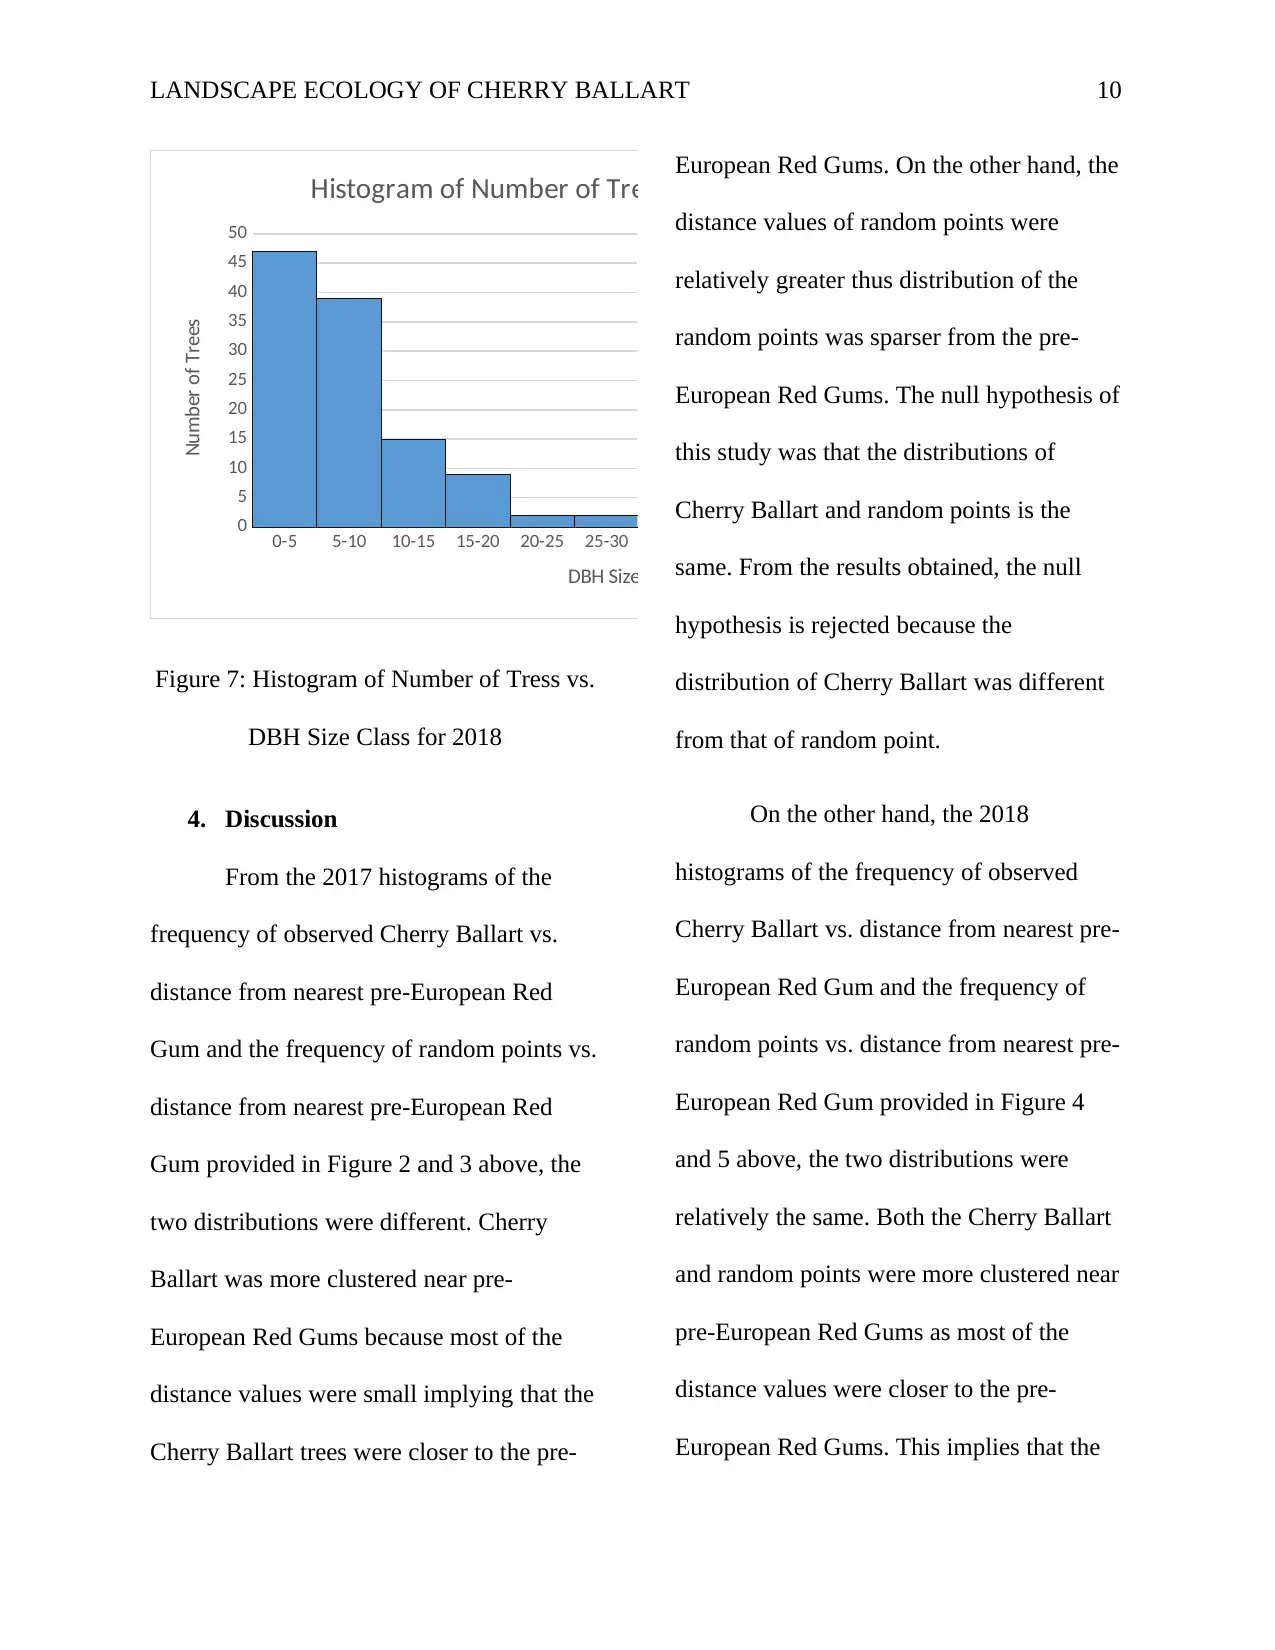
Figure 7: Histogram of Number of Tress vs.
DBH Size Class for 2018
4. Discussion
From the 2017 histograms of the
frequency of observed Cherry Ballart vs.
distance from nearest pre-European Red
Gum and the frequency of random points vs.
distance from nearest pre-European Red
Gum provided in Figure 2 and 3 above, the
two distributions were different. Cherry
Ballart was more clustered near pre-
European Red Gums because most of the
distance values were small implying that the
Cherry Ballart trees were closer to the pre-
European Red Gums. On the other hand, the
distance values of random points were
relatively greater thus distribution of the
random points was sparser from the pre-
European Red Gums. The null hypothesis of
this study was that the distributions of
Cherry Ballart and random points is the
same. From the results obtained, the null
hypothesis is rejected because the
distribution of Cherry Ballart was different
from that of random point.
On the other hand, the 2018
histograms of the frequency of observed
Cherry Ballart vs. distance from nearest pre-
European Red Gum and the frequency of
random points vs. distance from nearest pre-
European Red Gum provided in Figure 4
and 5 above, the two distributions were
relatively the same. Both the Cherry Ballart
and random points were more clustered near
pre-European Red Gums as most of the
distance values were closer to the pre-
European Red Gums. This implies that the
0-5 5-10 10-15 15-20 20-25 25-30 30-35 35-40 40-45 45-50 50-55 55-60
0
5
10
15
20
25
30
35
40
45
50
Histogram of Number of Tress vs. DBH Size Class
DBH Size Class
Number of Trees
Figure 7: Histogram of Number of Tress vs.
DBH Size Class for 2018
4. Discussion
From the 2017 histograms of the
frequency of observed Cherry Ballart vs.
distance from nearest pre-European Red
Gum and the frequency of random points vs.
distance from nearest pre-European Red
Gum provided in Figure 2 and 3 above, the
two distributions were different. Cherry
Ballart was more clustered near pre-
European Red Gums because most of the
distance values were small implying that the
Cherry Ballart trees were closer to the pre-
European Red Gums. On the other hand, the
distance values of random points were
relatively greater thus distribution of the
random points was sparser from the pre-
European Red Gums. The null hypothesis of
this study was that the distributions of
Cherry Ballart and random points is the
same. From the results obtained, the null
hypothesis is rejected because the
distribution of Cherry Ballart was different
from that of random point.
On the other hand, the 2018
histograms of the frequency of observed
Cherry Ballart vs. distance from nearest pre-
European Red Gum and the frequency of
random points vs. distance from nearest pre-
European Red Gum provided in Figure 4
and 5 above, the two distributions were
relatively the same. Both the Cherry Ballart
and random points were more clustered near
pre-European Red Gums as most of the
distance values were closer to the pre-
European Red Gums. This implies that the
Secure Best Marks with AI Grader
Need help grading? Try our AI Grader for instant feedback on your assignments.
LANDSCAPE ECOLOGY OF CHERRY BALLART 11
2018 data supports the null hypothesis that
the distribution of Cherry Ballart and
random points was the same.
This basically means that the spatial
patterning or distribution of Cherry Ballart
was significantly contributed by the old
(pre-European) trees. It attests to the fact
that Cherry Ballart trees are hemi-parasitic
during early stages of their life as they
depend on other host trees for food and
water uptake since they cannot support
photosynthesis. The parasitic nature of
Cherry Ballart makes it difficult to
propagate simply because even if the
seedling is dispersed either by wind, birds or
mammals, it is likely to fail to germinate if it
lands where there is no suitable host tree. It
can be concluded from the host-parasite-
disperser relationship that for the parasitic
plant to grow, it has to be dispersed and
propagated to a place where there is an
appropriate host tree that will provide the
necessary food and water until the tree
develops its system to start
photosynthesizing by itself.
The graphs in Figure 6 and 7 above
show that the number of Cherry Ballart trees
is concentrated on the left (at the smaller
tree sizes) and declines as the tree size
increases. This means that the number of
individual Cherry Ballart trees declines with
increasing size of trees implying that the
distribution pattern of the trees in the site
studied is reverse-J-shaped pattern. The
graphs were similar in both 2017 and 2018.
As a result of this, the Cherry Ballart trees
can be said to be producing seedlings that
are largely depended upon for dispersion
and propagation. Unfortunately, these
seedlings suffer mortality at varied phases
before they reach maturity. The fact that
majority of trees are of smaller size (less
than 50 years) means that restoration efforts
of Cherry Ballart in La Trobe University
Wildlife Sanctuary are working. The trees
had declined significantly due to various
LANDSCAPE ECOLOGY OF CHERRY BALLART 12
reasons, including climate change, which is
largely caused by human activities (Keenan,
2017). Studies have shown that forest
restoration has significant positive impacts
on the ecosystem (Hobbs & Levin, 2009).
Birds are among the species that benefit
most because they can fly from one area of
the forest to another and get food from
different plants (Ford, 2011). Thus the
ongoing efforts to restore Cherry Ballart will
benefit the entire ecosystem.
5. Conclusion
Generally, the results obtained from
this study show that distribution of Cherry
Ballart in La Trobe University Wildlife
Sanctuary is not random. This is because
most of the Cherry Ballart trees were found
to be closer to the pre-European Red Gum
trees, which are believed to be hosts of the
former during younger stages. Hence the
current distribution of Cherry Ballart in the
Sanctuary is still influenced by the
distribution of pre-European River Red
gums. In other words, the distribution of
Cherry Ballart is not random, which proves
the semi-parasitic nature of these trees. The
K-S test also showed that the pattern of the
data is not normal distribution hence the null
hypothesis that the data for the Cherry
Ballart are normally distributed is rejected.
References
LANDSCAPE ECOLOGY OF CHERRY BALLART 13
Antoneli, F., Passos, F., Lopes, L., & Briones, M. (2018). A Kolmogorov-Smirnov test for the molecular
clock based on Bayesian ensembles of phylogenies. PLOS ONE, 13(2).
Australian Bureau of Rural Sciences. (2010). Australia’s Forests at a Glance 2010: Australian Government
Department of Agriculture . Canberra: Australian Fisheries and Forestry.
Bennett, J., Cunningham, S., Connelly, C., Clarke, R., Thomson, J., & Nally, R. (2013). The interaction
between a drying climate and land use affects forest structure and above ground carbon‐
storage. Global Ecology and Biogeography, 22(12).
Bradshaw, C. (2012). Little left to lose: deforestation and forest degradation in Australia since European
colonization. Journal of Plant Ecology, 5(1), 109-120.
Craigboase. (2016). Cherry Ballart. Retrieved September 11, 2018, from
https://wildsoutheast.wordpress.com/2016/01/14/cherry-ballart/
Deo, R. (2011). Links between native forest and climate in Australia. Weather, 66(3), 64-69.
Deo, R., Syktus, J., & McAlpine, C. (2009). Impact of historical land cover change on daily indices of
climate extremes including droughts in eastern Australia. Geophys Res Lett, 36.
Ford, H. (2011). The causes of decline of birds of eucalypt woodlands: advances in our knowledge over
the last 10 years. Emu, 111(1), 1-9.
Guerin, G., & Lowe, A. (2012). Multi species distribution modelling highlights the Adelaide Geosyncline,‐
South Australia, as an important continental scale arid zone refugium.‐ ‐ Austral Ecology, 38(4).
Hobbs, R., & Levin, S. (2009). Restoration ecology: The Princeton Guide to Ecology. Princeton, NJ:
Princeton University Press.
Keenan, R. (2017). Climate change and Australian production forests: impacts and adaptation.
Australian Forestry, 80(4), 197-207.
Krzanowski, W., & Hand, D. (2011). Testing the difference between two Kolmogorov–Smirnov values in
the context of receiver operating characteristic curves. Journal of Applied Statistics, 38(3), 437-
450.
La Trobe University. (2018a). 50 Years of Wildlife at La Trobe . Retrieved September 11, 2018, from
https://50years.latrobe/get-involved/pitch-your-project/50-years-wildlife-la-trobe/
La Trobe University. (2018b). History of the area. Retrieved September 11, 2018, from
https://www.latrobe.edu.au/wildlife/about/history
Meers, T., Enright, N., Bell, T., & Kasel, S. (2012). Deforestation strongly affects soil seed banks in
eucalypt forests: Generalisations in functional traits and implications for restoration. Forest
Ecology and Management, 266(1), 94-107.
Okada, S., Zhou, X., Damcevski, K., Gibb, N., Wood, C., Hamberg, M., & Haritos, V. (2013). Diversity of
Δ12 Fatty Acid Desaturases in Santalaceae and Their Role in Production of Seed Oil Acetylenic
Fatty Acids. Journal of Biological Chemistry, 288(45), 32405-32413.
Paraphrase This Document
Need a fresh take? Get an instant paraphrase of this document with our AI Paraphraser
LANDSCAPE ECOLOGY OF CHERRY BALLART 14
Paton, D., & O'Connor, J. (2009). The state of Australia’s birds 2009. Restoring woodland habitats for
birds. Wingspan, 20(1), 1-28.
Patykowski, J., Dell, M., Wevill, T., & Gibson, M. (2018). Rarity and nutrient acquisition relationships
before and after prescribed burning in an Australian box-ironbark forest. AoB PLANTS, 10(3).
Skraskova, K. (2018). Exocarpos cupressiformis (Native cherry): Tasmanian bush nbble. Retrieved
September 11, 2018, from https://herbaethylacini.com.au/exocarpos-cupressiformis-native-
cherry/
Sodhi, N., Brook, B., Bradshaw, C., & Levin, S. (2009). Causes and consequences of species extinctions:
The Princeton Guide to Ecology . Princeton, NJ: Princeton University Press.
Thomas, R. (2016). Wild cherry tree full of charm. Retrieved September 11, 2018, from
https://www.thecourier.com.au/story/4042682/fruit-foliage-part-of-wild-cherrys-charm/
Tozer, M., Leishman, M., & Auld, T. (2014). Ecosystem risk assessment for Cumberland Plain Woodland,
New South Wales, Australia. Austral Ecology, 40(4).
Turner, W., Pressey, R., & Levin, S. (2009). Building and implementing systems of conservation areas, The
Princeton Guide to Ecology. Princeton, NJ: Princeton University Press.
Zaiontz, C. (2014). Real Statistics Using Excel. Retrieved September 11, 2018, from http://www.real-
statistics.com/non-parametric-tests/goodness-of-fit-tests/two-sample-kolmogorov-smirnov-
test/
Zaiontz, C. (2018). Kolmogorov-Smirnov Test for Normality. Retrieved September 11, 2018, from
http://www.real-statistics.com/tests-normality-and-symmetry/statistical-tests-normality-
symmetry/kolmogorov-smirnov-test/
1 out of 14
Your All-in-One AI-Powered Toolkit for Academic Success.
+13062052269
info@desklib.com
Available 24*7 on WhatsApp / Email
![[object Object]](/_next/static/media/star-bottom.7253800d.svg)
Unlock your academic potential
© 2024 | Zucol Services PVT LTD | All rights reserved.