Statistical Analysis: Chi-Square Test on Seed Color and Soil Types
VerifiedAdded on 2020/10/22
|6
|885
|170
Homework Assignment
AI Summary
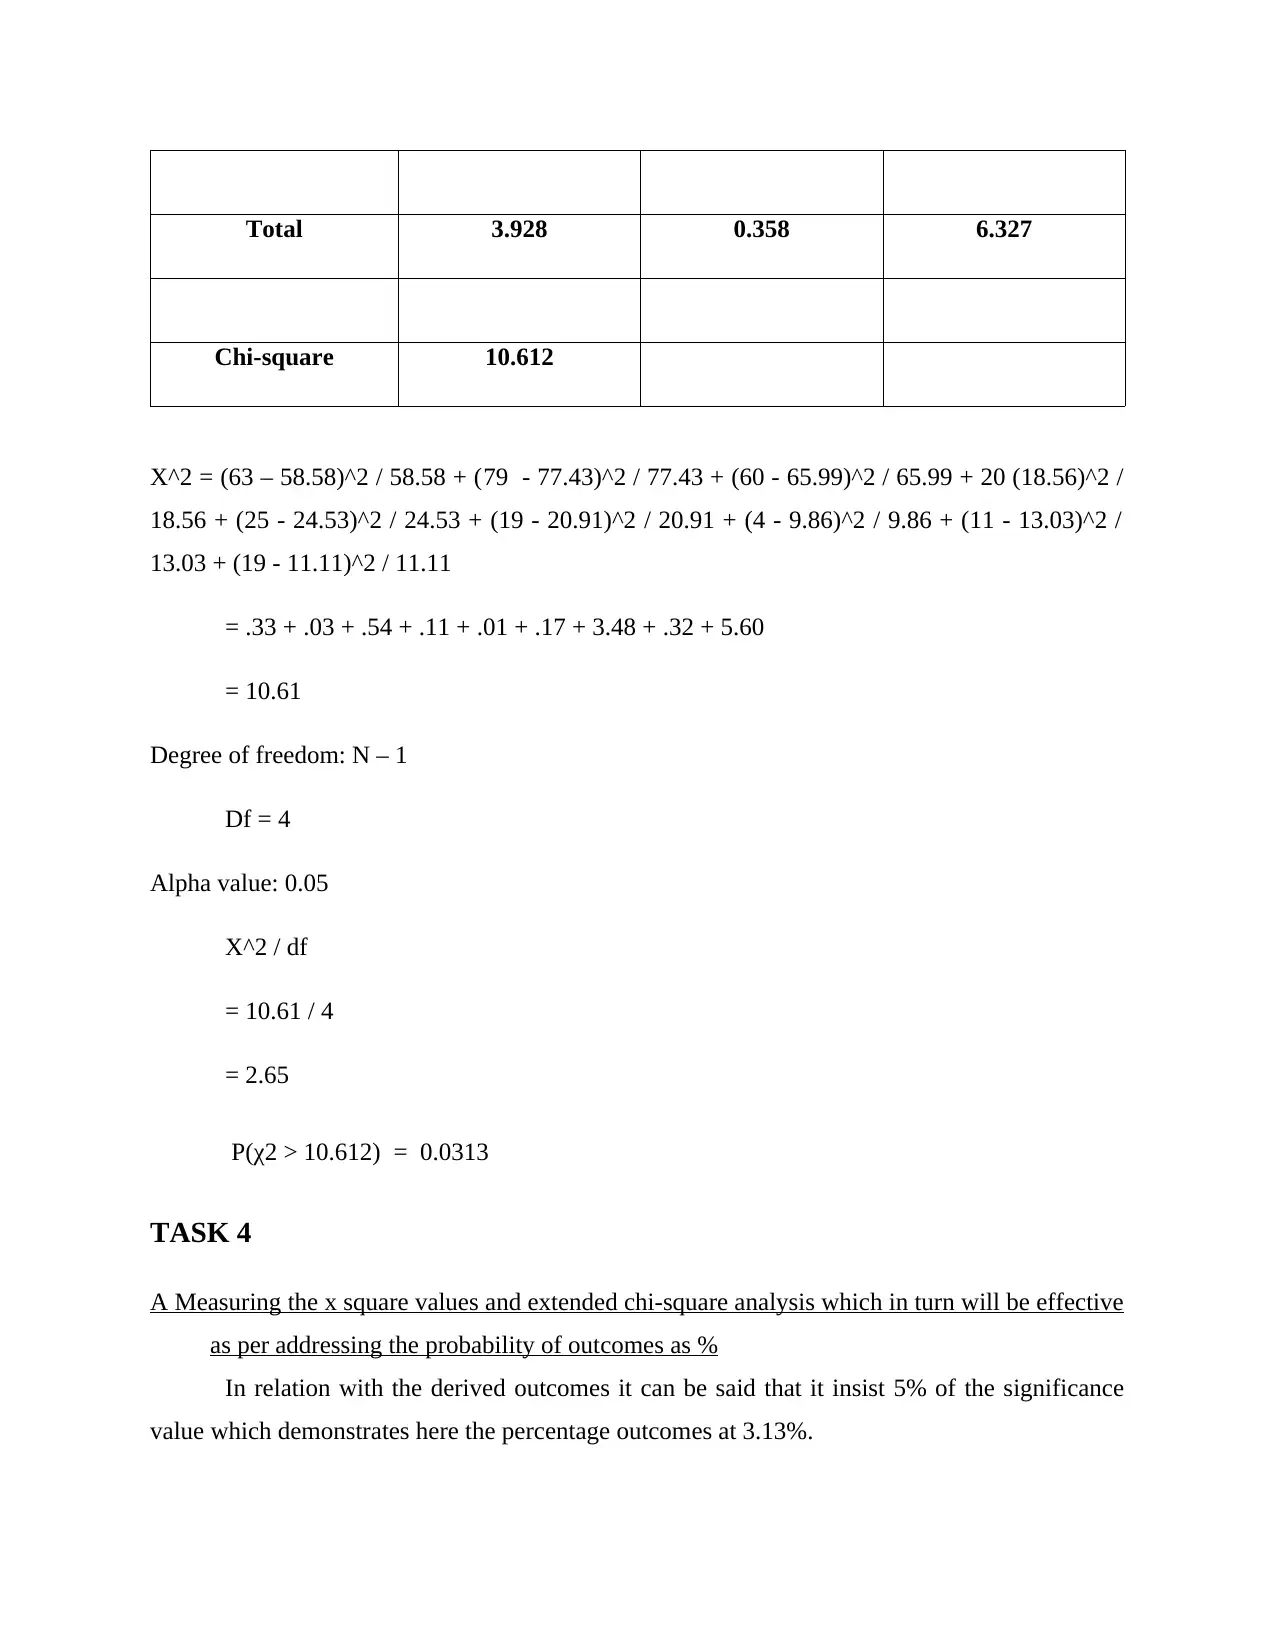
This assignment provides a comprehensive analysis of the Chi-Square Test, a statistical method used to determine the significance of the difference between observed and expected results. The solution presents three distinct tasks. Task 1 involves an initial Chi-Square test on plant data, includi...

TABLE OF CONTENTS
TASK 1............................................................................................................................................2
1....................................................................................................................................................2
TASK 2............................................................................................................................................2
TASK 3............................................................................................................................................3
CHI- SQUARE TEST..................................................................................................................3
TASK 4............................................................................................................................................5
A Measuring the x square values and extended chi-square analysis which in turn will be
effective as per addressing the probability of outcomes as %.....................................................5
B Determining the valuation of table which will address the significance value........................5
C Rejection of H0 on the basis of outcomes................................................................................5
Paraphrase This Document
Need a fresh take? Get an instant paraphrase of this document with our AI Paraphraser

TASK 1
1.
Number of plants Proportion
Red 18
17.59
(0.01)
1
1.41
(0.12)
19
Pink 22
22.22
(0.00)
2
1.78
(0.03)
24
White 10
10.19
(0.00)
1
0.81
(0.04)
11
50 4 54
χ2 = 0.203,
df = 2,
χ2/df = 0.10 ,
P(χ2 > 0.203) = 0.9036
TASK 2
Null hypothesis (H0): There is no significance difference in between colours of seeds and types
of seeds.
Alternative hypothesis (H1): There is a Significance difference between colours of seeds and
types of seeds.
Particulars Observed (O) Expected (E)
Observed -
expected
figure (O-E)
(O -
E)^2
(O - E)^2
/ E
Colour Frequency

Red 42 40 2 4 0.1
Pink 45 40 5 25 0.6
White 28 40 -12 144 3.6
Yellow 27 40 -13 169 4.2
purple 58 40 18 324 8.1
200 200 0 666 16.65
Average: Sum of values / N
= 200 / 5
= 40
Particulars Formulas Outcome
Degree of Freedom N - 1 5 – 1 = 4
Alpha value (α) 0.05
Critical X^2 value 16.65
TASK 3
CHI- SQUARE TEST
In relation with analysation the Chi square test of the given data set which insists that
there will be appropriate outcomes. It comprises with having effective control over creating the
hypothesis that will be effective in meeting the sampling distribution level and analysing the
hypothesis outcomes of the analysed data set. Moreover, to address the effective outcomes from
the analysed data set which insist that there will be appropriate gains and losses. Therefore, to
analyse the data set there have been implication of various techniques which will be effective as
per analysing relation between type of seeds as well as their colours. Thus, there will be
preparation of Two hypothesis such as:
Null Hypothesis (H0): There is no significance difference in between colours of seeds
and types of seeds.
Alternative hypothesis (H1): There is a Significance difference between colours of
seeds and types of seeds.
⊘ This is a preview!⊘
Do you want full access?
Subscribe today to unlock all pages.

Trusted by 1+ million students worldwide

Soil 1 Soil 2 Soil 3 Total
Green 63 79 60 202
Yellow/green 20 25 19 64
yellow 4 11 19 34
total 87 115 98 300
Expected
Soil 1 Soil 2 Soil 3 Total
Green 58.58 77.43 65.99 202
Yellow/green 18.56 24.53 20.91 64
yellow 9.86 13.03 11.11 34
total 87 115 98 300
x Soil 1 Soil 2 Soil 3
Green 4.42 1.567 -5.987
Yellow/green 1.44 0.467 -1.907
yellow -5.86 -2.033 7.893
x2 Soil 1 Soil 2 Soil 3
Green 0.333 0.032 0.543
Yellow/green 0.112 0.009 0.174
yellow 3.483 0.317 5.610
Paraphrase This Document
Need a fresh take? Get an instant paraphrase of this document with our AI Paraphraser

Total 3.928 0.358 6.327
Chi-square 10.612
X^2 = (63 – 58.58)^2 / 58.58 + (79 - 77.43)^2 / 77.43 + (60 - 65.99)^2 / 65.99 + 20 (18.56)^2 /
18.56 + (25 - 24.53)^2 / 24.53 + (19 - 20.91)^2 / 20.91 + (4 - 9.86)^2 / 9.86 + (11 - 13.03)^2 /
13.03 + (19 - 11.11)^2 / 11.11
= .33 + .03 + .54 + .11 + .01 + .17 + 3.48 + .32 + 5.60
= 10.61
Degree of freedom: N – 1
Df = 4
Alpha value: 0.05
X^2 / df
= 10.61 / 4
= 2.65
P(χ2 > 10.612) = 0.0313
TASK 4
A Measuring the x square values and extended chi-square analysis which in turn will be effective
as per addressing the probability of outcomes as %
In relation with the derived outcomes it can be said that it insist 5% of the significance
value which demonstrates here the percentage outcomes at 3.13%.

B Determining the valuation of table which will address the significance value
P(χ2 > 10.612) = 0.0313
C Rejection of H0 on the basis of outcomes
P < 0.05 so H1 is accepted.
P(χ2 > 10.612) = 0.0313
C Rejection of H0 on the basis of outcomes
P < 0.05 so H1 is accepted.
⊘ This is a preview!⊘
Do you want full access?
Subscribe today to unlock all pages.

Trusted by 1+ million students worldwide
1 out of 6

Your All-in-One AI-Powered Toolkit for Academic Success.
+13062052269
info@desklib.com
Available 24*7 on WhatsApp / Email
Unlock your academic potential
© 2024 | Zucol Services PVT LTD | All rights reserved.