Child and Infant Mortality in England and Wales
VerifiedAdded on 2023/06/07
|18
|2554
|245
AI Summary
This report discusses the changes in infant and child mortality rates in England and Wales, along with the causes of neonatal and premature deaths. It also analyzes the contributions made by the government to reduce these deaths and suggests strategies for reducing them.
Contribute Materials
Your contribution can guide someone’s learning journey. Share your
documents today.
Name of your degree
Academic year of submission
Your Name
“Child and Infant Mortality in
England and Wales”
Date of submission : Month Year
Academic year of submission
Your Name
“Child and Infant Mortality in
England and Wales”
Date of submission : Month Year
Secure Best Marks with AI Grader
Need help grading? Try our AI Grader for instant feedback on your assignments.

2
Table of Contents
1. Introduction..................................................................................................................................1
2. Objectives......................................................................................................................................1
3. Group Involvement.....................................................................................................................1
4. Methodology.................................................................................................................................3
Data Collection.................................................................................................................................. 3
Data Preparation........................................................................................................................... 10
Data Analysis.................................................................................................................................. 11
Results.............................................................................................................................................. 11
Conclusion....................................................................................................................................... 12
3. Project Management.............................................................................................................13
Project Plan..................................................................................................................................... 13
Project Collaboration................................................................................................................... 13
Learning reflection....................................................................................................................... 13
References.....................................................................................................................................14
List of Figures
Figure 1: Infant mortality rates in England and Wales overall
decreased from 1980 to 2018
Figure 2: Progress toward England's goal of halving stillbirths
and neonatal mortality from 2010 to 2018
Figure 3: Pregnancy-related illnesses, congenital defects, and
antepartum infections as a percentage of neonatal fatalities in
England and Wales from 2014 to 2018
Figure 4: England and Wales's neonatal death rate from 2006
to 2017
Figure 5: Percentage of newborn fatalities for England and
Wales from 2006 to 2017 by gestational age groups
Figure 6: Infant mortality rates in England's most and least
impoverished communities have gradually decreased since
2010
Figure 7: For England and Wales from 2011 to 2018, infant
mortality rates were categorized by the National Statistics
Socio-Economic Classification (NS-SEC) classes.
Figure 8: Ethnicity-specific infant mortality rates in England
and Wales, 2017
Secure Best Marks with AI Grader
Need help grading? Try our AI Grader for instant feedback on your assignments.
1. Introduction
Child mortality, often known as the under-five mortality rate, is the likelihood
that a child would pass away before reaching the age of exactly five, represented
as a ratio of 1 death for every 1,000 live births. And the rate of fatality of
infants, when subject to age-specific death rates for that time period, is the
likelihood that a child born in a certain year or period will pass away before
turning one. Instead of being expressed as a rate, infant mortality rate is really a
likelihood of death calculated from a life table and expressed as a rate per 1000
live births. The project discusses about the changes come in infant and child
mortality in the present year with comparison to previous years in England and
Wales (Ali, 2021). A brief study about the causes of neonatal and premature
deaths of babies and by understanding the conditions, developed strategies for
reducing these neonatal deaths in context with the contribution of government.
2. Objectives
The project has the objective to know the mortality rates in the England and Wales in
recent years and analyse the changes comes in it due to inequalities prevailing in the
society. The topic helps to communicate the groups about the social conditions of the UK
and how government is contributing towards the society to overcome this problem
(Bartickand Feldman-Winter, 2018). This study focuses on providing solutions to this
problem and how a person can contribute in reducing this problem by taking some
measures.
3. Group Involvement
Everyone collaborated as a team to gather trustworthy information that would be utilised
for specific analyses. After finishing the study, we decided who would be in charge of
each component of the group project. The aim of the project is to understand the causes of
death and inequalities due to which death occur and analyse the 2018 data with previous
1

year infant mortality rates. The main purpose of this project is to develop strategies for
reducing the neonatal and premature deaths and investigate the contributions made by the
government in response to the crisis (Marland, 2020). This project helps in educating the
group about various inequalities which lies in the society such as maternal age, ethnicity,
parents’ occupation, income, health, education, crime, birth weight, etc.
2
4. Methodology
Data Collection
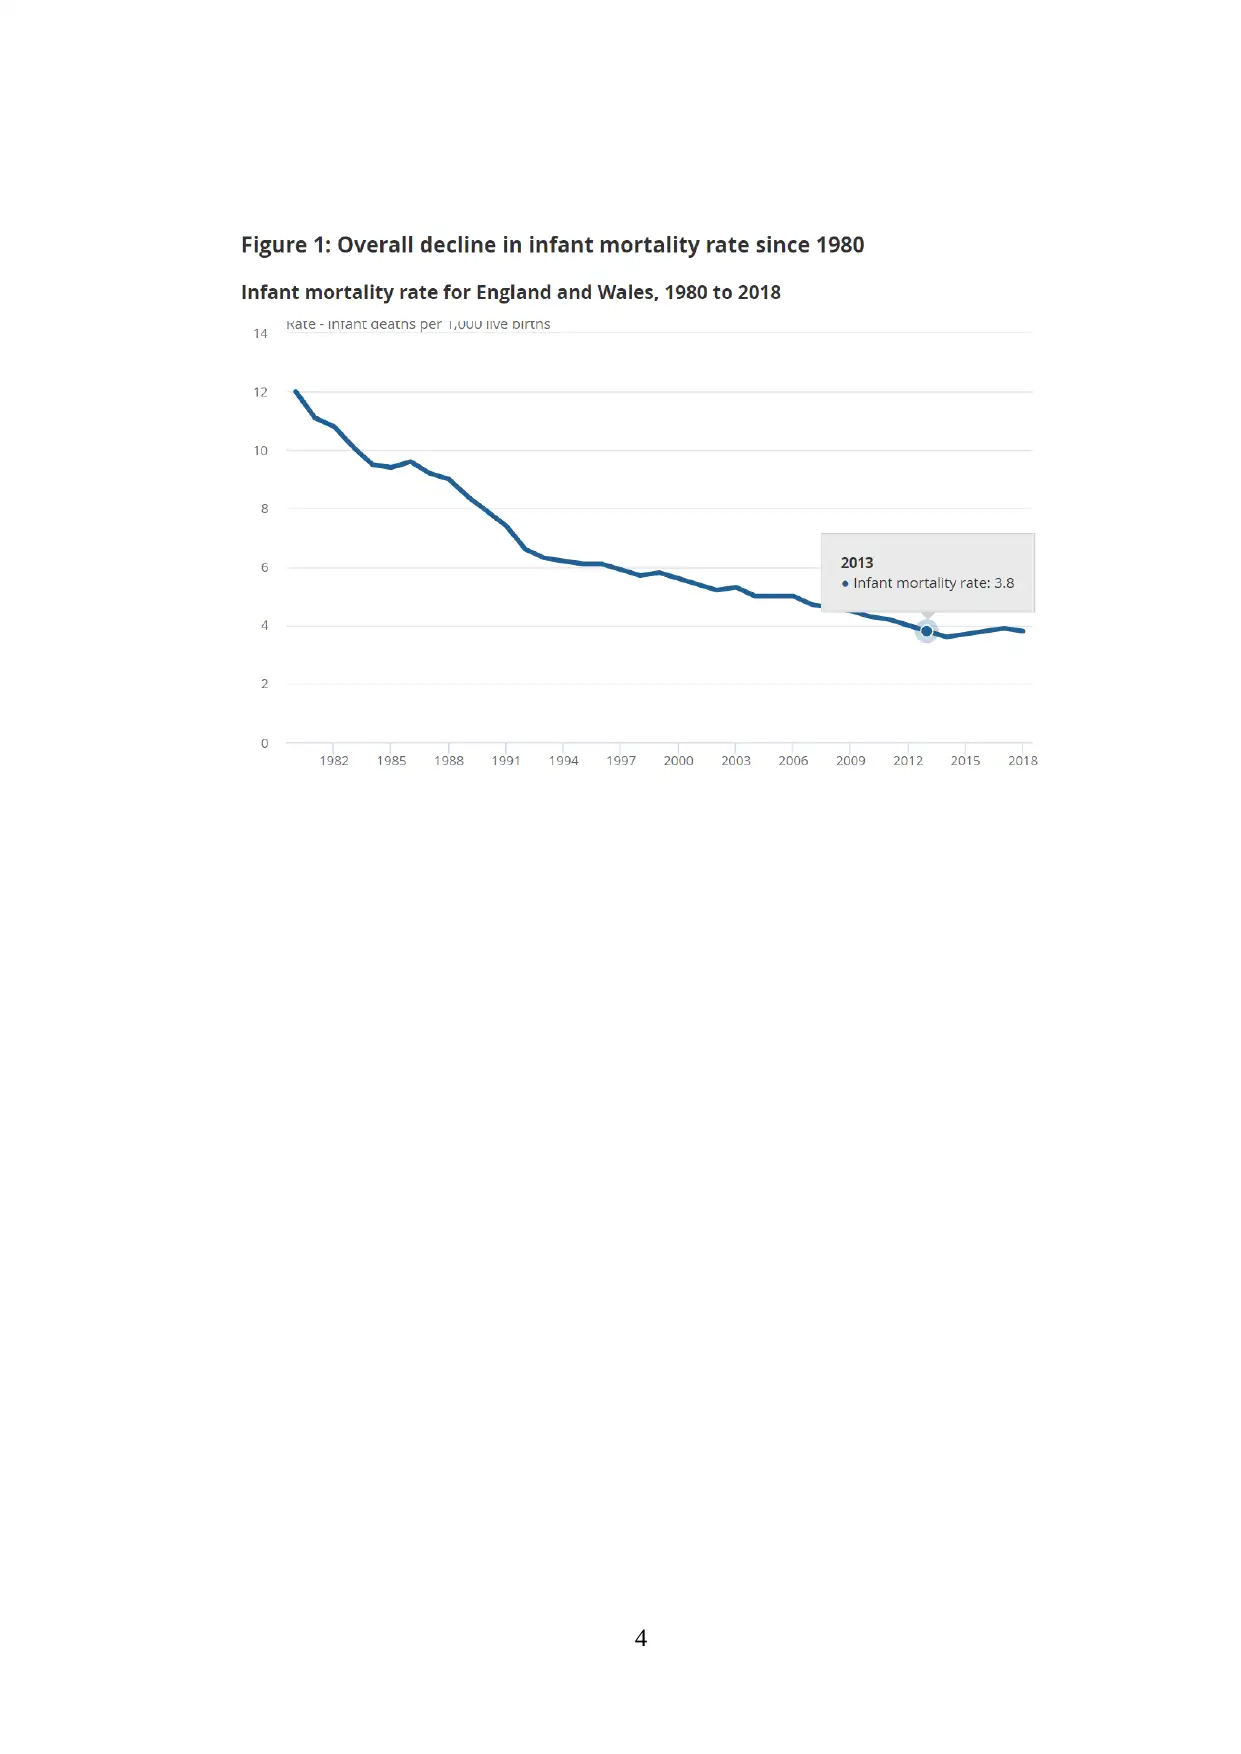
The information here is accumulated from the Office for National Statistics of
UK. There are figures given in the data which justify the infant mortality rates in the year
from 1980 to 2018.The graph depicts a general drop in England and Wales' infant death
rates from 1980. It shows the following notes such as deaths that have place in a calendar
year, infant deaths of those children under 1 year old, infant fatalities rate per 1000 live
births. The data collected in this report is deployed on either the birth year or the death
cohort, depending on which happened first (birth cohort). These figures are the best for
monitoring changes in patterns since they account for more late registrations and offer a
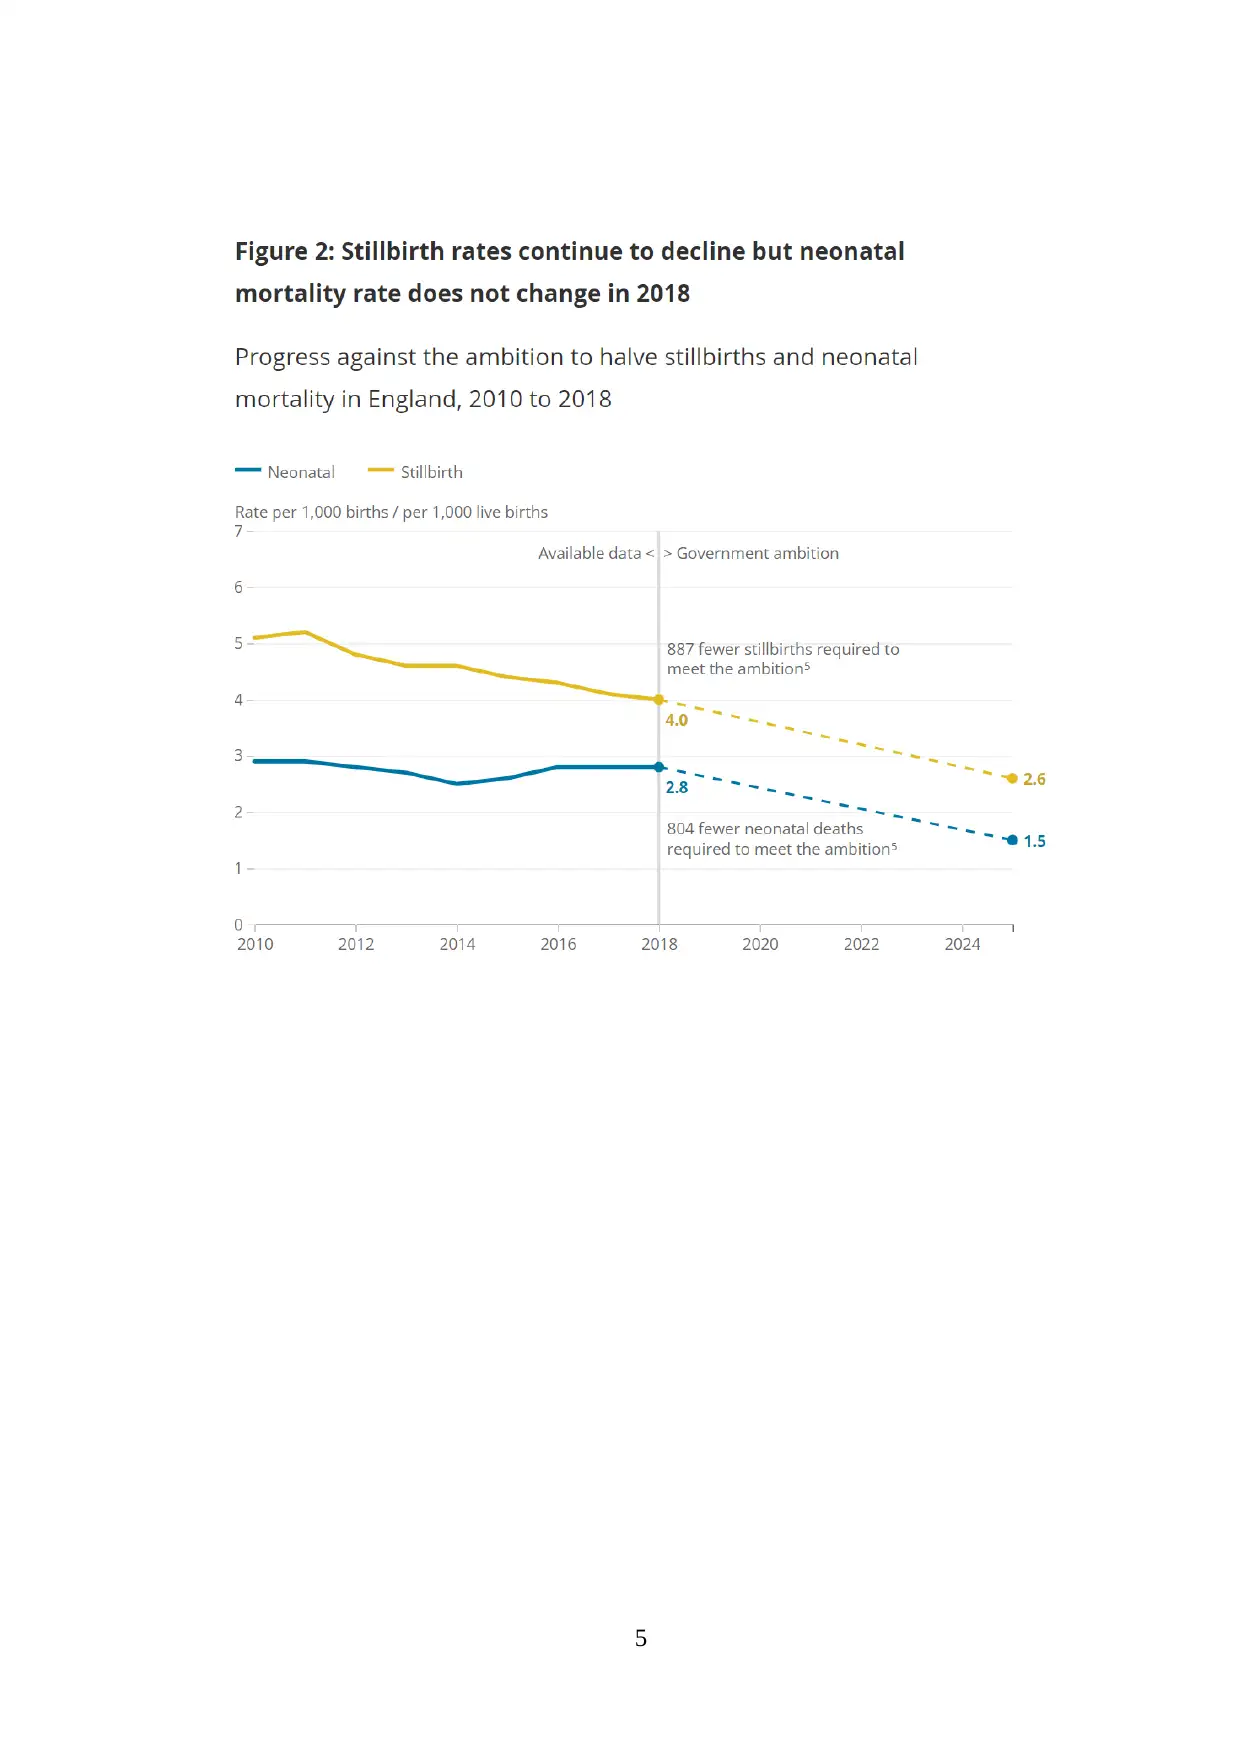
more accurate picture of what actually happened in any particular year. And the second
figure which is given on the site shows the efforts to reduce stillbirths and neonatal death
in England by half from 2010 to 2018 are making progress (Bhasin and Kohli, 2019).
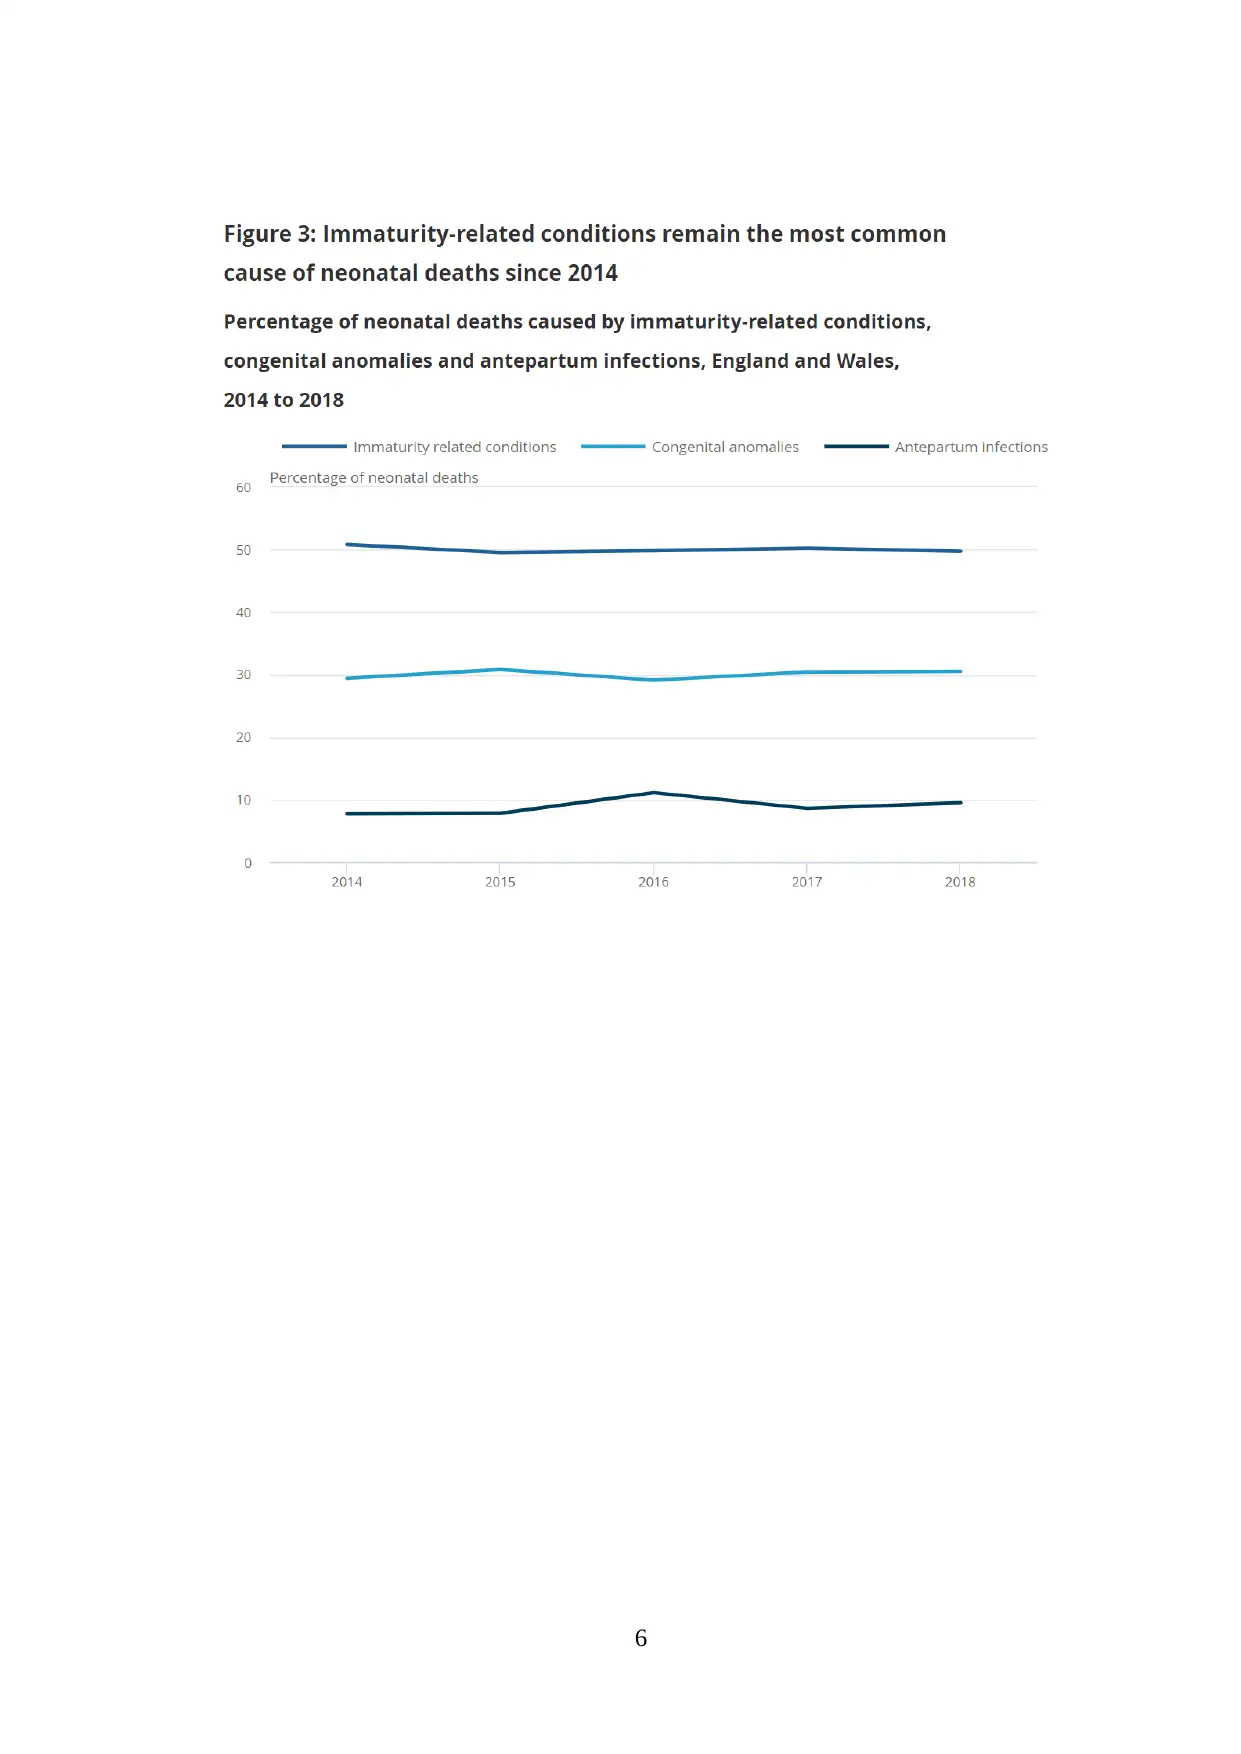
So as third one helps to analyse the Pregnancy-related illnesses, congenital
disorders, and ante partum infections as a percentage of neonatal fatalities in England and
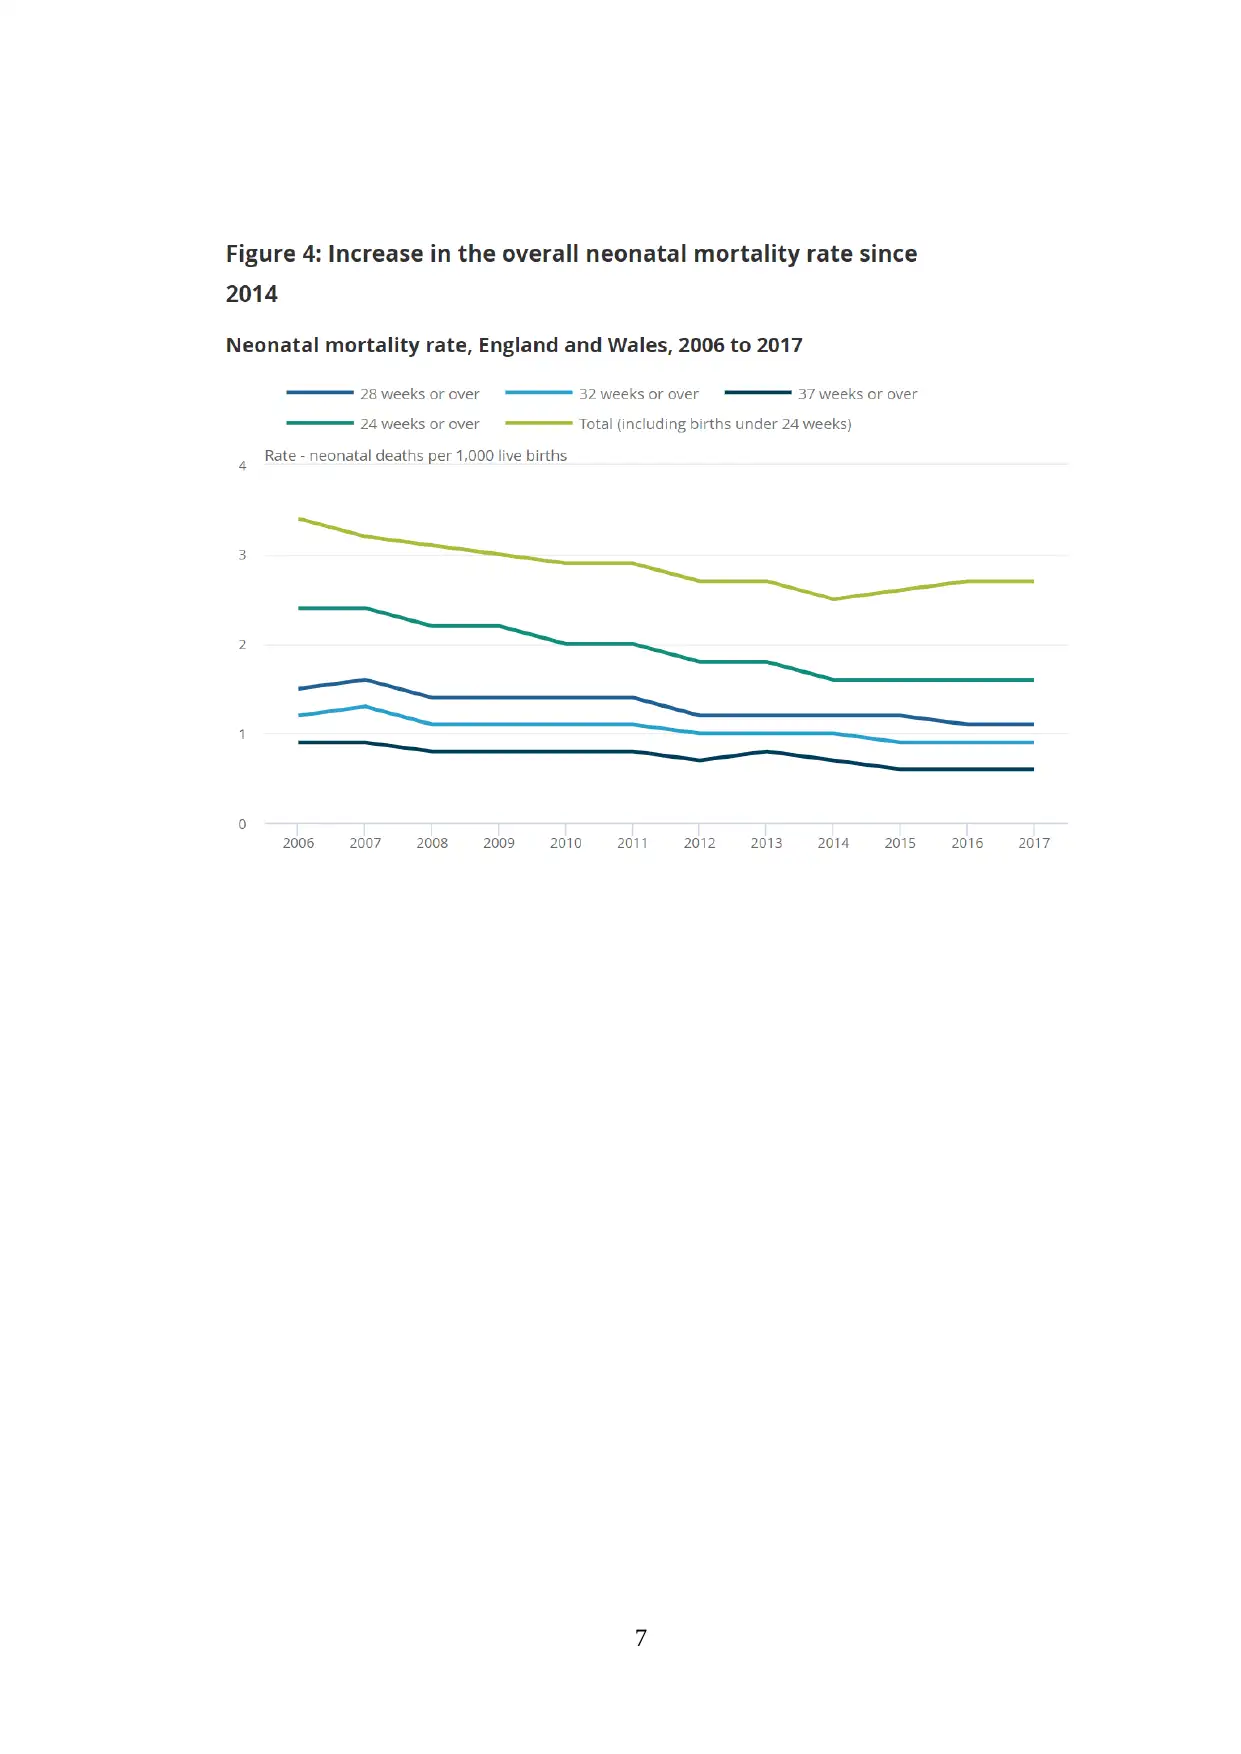
Wales from 2014 to 2018. And the fourth figure shows the increment in the overall rate of
neonatal mortality in England and Wales since 2006 to 2017. The trend given in
the newsletter for 24 weeks and over only is more similar with their findings since
information from the UK's Mothers and Babies: Reducing Risk via Audits and
Confidential Enquiries (MBRRACE-UK)excludes babies before 24 weeks gestational
age.
3
Data Collection
The information here is accumulated from the Office for National Statistics of
UK. There are figures given in the data which justify the infant mortality rates in the year
from 1980 to 2018.The graph depicts a general drop in England and Wales' infant death
rates from 1980. It shows the following notes such as deaths that have place in a calendar
year, infant deaths of those children under 1 year old, infant fatalities rate per 1000 live
births. The data collected in this report is deployed on either the birth year or the death
cohort, depending on which happened first (birth cohort). These figures are the best for
monitoring changes in patterns since they account for more late registrations and offer a
more accurate picture of what actually happened in any particular year. And the second
figure which is given on the site shows the efforts to reduce stillbirths and neonatal death
in England by half from 2010 to 2018 are making progress (Bhasin and Kohli, 2019).
So as third one helps to analyse the Pregnancy-related illnesses, congenital
disorders, and ante partum infections as a percentage of neonatal fatalities in England and
Wales from 2014 to 2018. And the fourth figure shows the increment in the overall rate of
neonatal mortality in England and Wales since 2006 to 2017. The trend given in
the newsletter for 24 weeks and over only is more similar with their findings since
information from the UK's Mothers and Babies: Reducing Risk via Audits and
Confidential Enquiries (MBRRACE-UK)excludes babies before 24 weeks gestational
age.
3
Paraphrase This Document
Need a fresh take? Get an instant paraphrase of this document with our AI Paraphraser
4
5
6
Secure Best Marks with AI Grader
Need help grading? Try our AI Grader for instant feedback on your assignments.
7
8
9
Paraphrase This Document
Need a fresh take? Get an instant paraphrase of this document with our AI Paraphraser
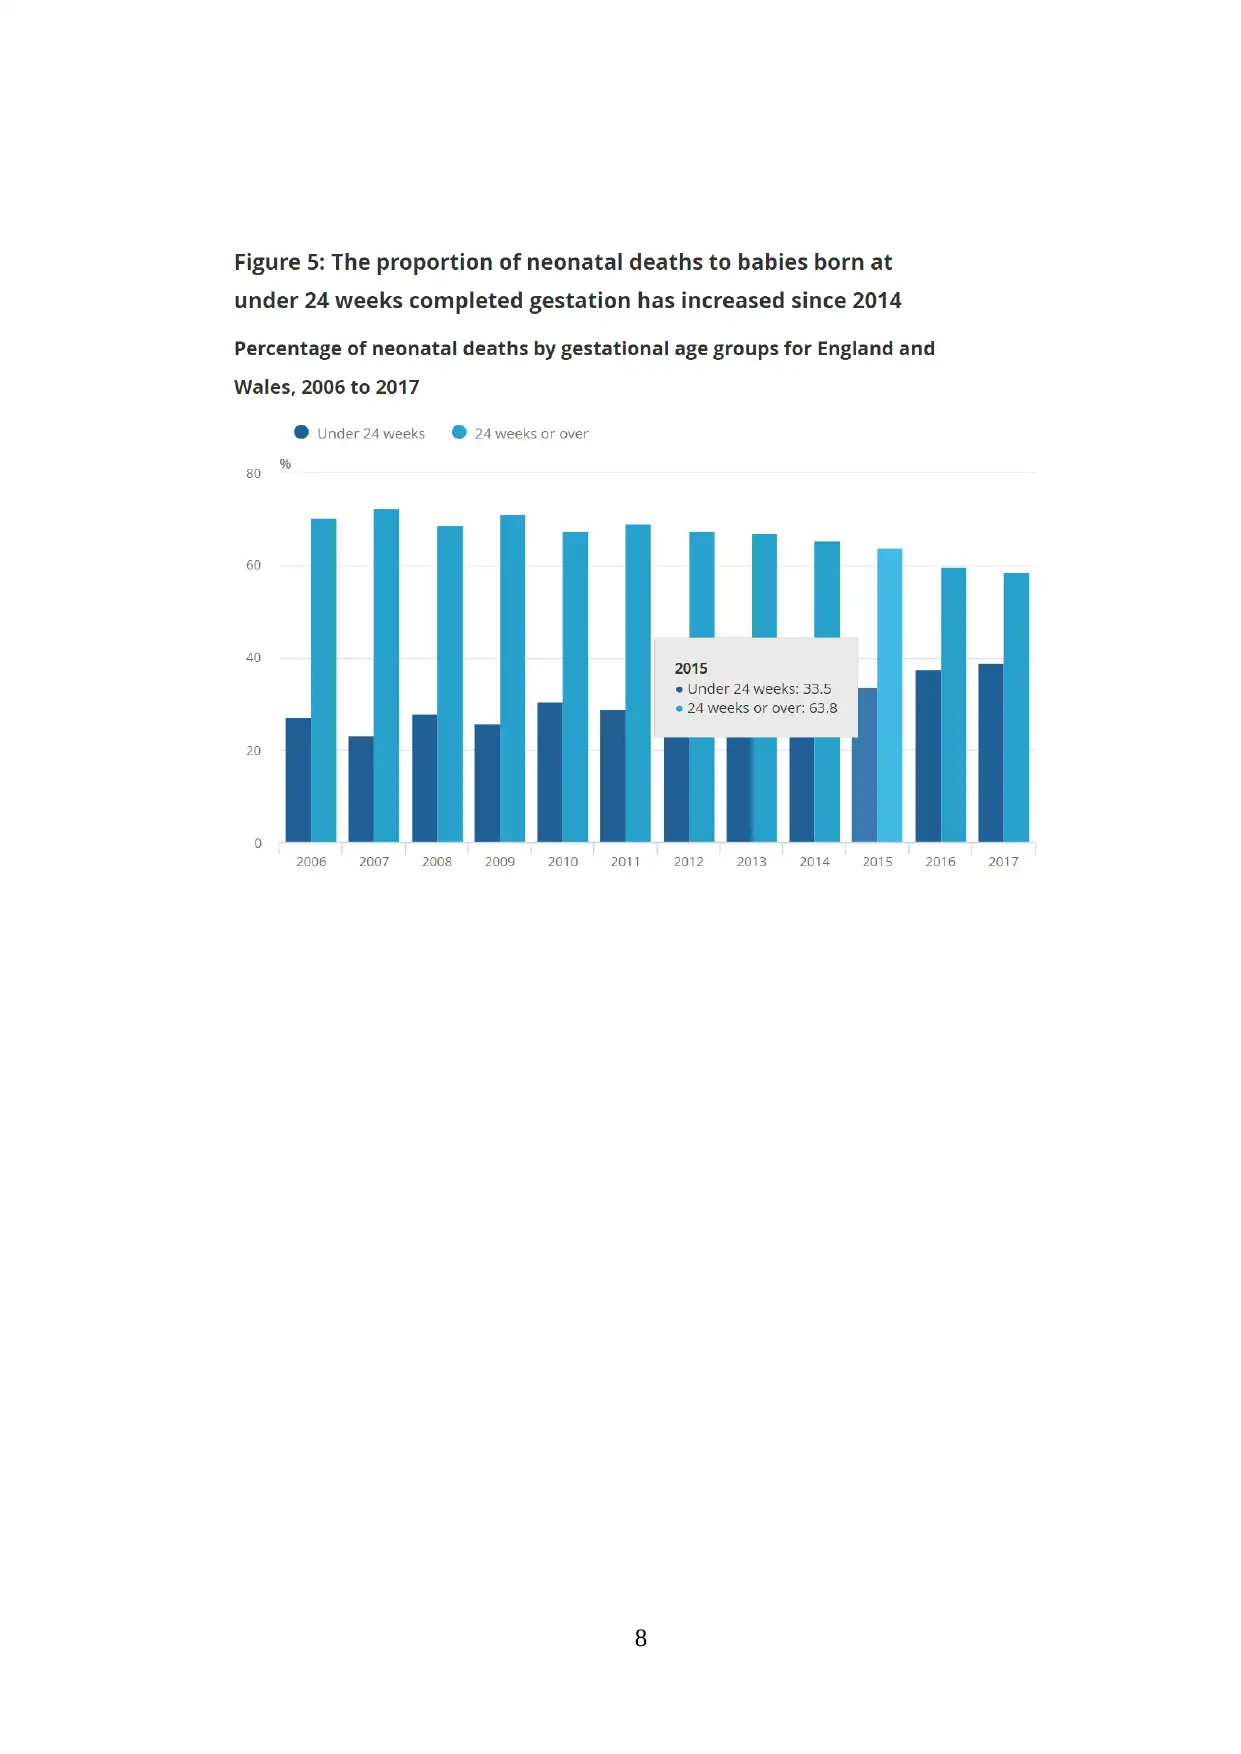
Data Preparation
According to the data prepared today, in England and Wales, the rate of infant mortality
was decreased a little but thankfully in 2018. This comes after a series of increases
between 2014 and 2017. However, the rate of newborn death stayed the same."The risk of
infant mortality increases with the sooner a baby is born, measured by the number of
completed weeks of pregnancy. The proportion of newborns born before 24 weeks of
gestation is one factor influencing the neonatal death rate. The most recent study reveals a
recent rise in this figure. In order to track progress toward the government goal of halving
the stillbirth and newborn death rates from 2010 by 2025, it is becoming more and more
important for policymakers and health professionals to take a closer look at these
trends(Fadda, 2020). The data is specifically processed with the help of figures given in
the national statistics site where the efforts of government and campaigns in England is
suggested and taken to reduce rates of newborn and stillbirth deaths by half by 2025 as
compared to 2010.
10
Data Analysis
Data is analysed through various figures which are provided by the Office for National
Statistics. There are various data sets given which shows the infant mortality rates for the
year 2018 and decline in the rate with comparison to past years. With the help of
registered data, it is easy to analyse and justify the death rates. The rate at which the
deaths of infant are analysed is infant death per 1000 live births. And there are various
government initiative programmes are launched to get the more accurate data as this is the
responsibility of the government to analyse the problem and take corrective measures as
soon as possible. In England, government initiatives and campaigns aim to reduce
newborn and stillbirth death rates by half by 2025 compared to 2010. This goal is only for
England because health is a devolved issue, meaning that each of the UK's individual
nations is responsible for it(Gun Kakasci and Durmaz, 2022).Rates of neonatal mortality
depending on the year of death, which are the first figures available for each particular
year, are used to measure progress toward this goal. The data in this report is based on
either the birth year or the death cohort, depending on which happened first (birth cohort).
Rates of neonatal mortality depending on the year of death, which are the first figures
available for each particular year, these are the finest statistics for observing changes in
patterns.
Results
The results which are concluded from the following figures shows thatIn
England and Wales, there were 2,488 infant fatalities total in 2018. The infant
mortality rate in England and Wales increased from the rate of 3.6 that was
published in 2014, which was the lowest rate ever, to 3.8 deaths per 1,000 live
births in 2018 from 3.9 in 2017. This is higher than the rate of 3.6 that was reported
in 2014. As of 2018, there were 4.8 fatalities per 1,000 live births, down from 5.8
deaths per 1,000 live births in 2010, moms who are 40 years of age or older have
had the greatest reductions in infant mortality (Hossain, 2020).In England and Wales,
the newborn mortality rate remained constant in 2018 at 2.8 fatalities on the rate
1000, Neonatal mortality increased recently, from 2.5 deaths per 1,000 live births in
2014 to 2.8 fatalities in 2017, due to a recent increase in the quantity of live births
that occur before 24 weeks of gestation.
11
Conclusion
From the above project, it is concluded that England and Wales saw a
decline in infant mortality rate in 2018 with comparison to past years.
And due to recent declines in birth rates,2018 had 2,488 child
fatalities in England and Wales (under 1 year old). The number is at its
lowest level since records have been kept, which was in 1980.And in
view of the statistician, the infant mortality rate in England and Wales
decreased little but thankfully in 2018. This comes after a series of
increases between 2014 and 2017. However, the rate of newborn
death stayed the same."The risk of infant mortality increases with the
sooner a baby is born, measured by the number of completed weeks
of pregnancy. The proportion of newborns born before 24 weeks of
gestation is one factor influencing the neonatal death rate.While a
detailed examination of these patterns is increasingly important for
policymakers and healthcare professionals to track advancements in
relation to the government's goal to halve the rates of stillbirth and
neonatal death from 2010 to 2025.
12
Secure Best Marks with AI Grader
Need help grading? Try our AI Grader for instant feedback on your assignments.

3. Project Management
Project Plan
Tasks Wk
1
Wk
2
Wk
3
Wk
4
Wk
5
Wk
6
Wk
7
Wk
8
Wk
9
Wk1
0
Wk1
1
Wk1
2
Identify individual
topic
Collect data from
…
Project Collaboration
The project is discussed in the meeting room and a proper
questionnaire is prepared by the team members to overview the
situation with respect of society’s opinion as the data provided or
mentioned on the site is familiar to the reality of the society which
actually England and Wales is facing(Manners, 2018).
Learning reflection
Different duties were given to team members. But before, it was not to be assumed that
responsibilities given to team members are equally challenging. This sense of injustice
and the various approaches put group members' ability to cooperate at danger. According
to the analysis, if the number of live births remained the same until 2025, the number of
newborn fatalities would have to decline by 804 from 1,742 in 2018 to 938 in 2025.
(Figure 2). There are so many inequalities such as parent occupation, income,
employment, ethnicity, maternal age, lower, premature baby, etc. due to which this
problem of Infant mortality occurs(Kidman and Heymann, 2018).To achieve the aim,
neonatal mortality rates based on the year the death was reported—the first data points
available for any given year—are used to gauge progress. The figures in this release are
calculated using the death cohort, or the death cohort plus one year. Depending on which
occurred first, the data in this release is based either on the birth year or the death cohort
(birth cohort). It is It is suggested that these figures as the better choices for monitoring
variations in trends since they incorporate more late registrations and offer a more
accurate picture of what actually happened in any given year.. In the end, the group was
successful, but the process might have been improved if they had had a chairperson to
assist promote collaboration when assignments were being distributed. It would certainly
propose this for next group projects in class and at work.
13
References
Ali, A., 2021. Current Status of Malnutrition and Stunting in Pakistani Children: What
Needs to Be Done?. Journal of the American College of Nutrition. 40(2). pp.180-
192.
Bartick, M. and Feldman-Winter, L., 2018. Skin-to-skin care cannot be blamed for
increase in suffocation deaths. The Journal of Pediatrics. 200. pp.296-297.
Bhasin, H. and Kohli, C., 2019. Myocardial dysfunction as a predictor of the severity and
mortality of hypoxic ischaemic encephalopathy in severe perinatal asphyxia: a
case–control study. Paediatrics and international child health. 39(4). pp.259-264.
Fadda, J., 2020. Climate change: an overview of potential health impacts associated with
climate change environmental driving forces. Renewable Energy and Sustainable
Buildings, pp.77-119.
Gun Kakasci, C. and Durmaz, A., 2022. A creative and practical approach to postpartum
discharge education: Pecha kucha training via smart phone. Health Care for
Women International, pp.1-21.
Hossain, B., 2020. Maternal empowerment and child malnutrition in Bangladesh. Applied
Economics. 52(14). pp.1566-1581.
Kidman, R. and Heymann, J., 2018. Prioritising action to accelerate gender equity and
health for women and girls: Microdata analysis of 47 countries. Global public
health. 13(11). pp.1634-1649.
Manners, I., 2018. Political psychology of European integration: The (re) production of
identity and difference in the Brexit debate. Political Psychology, 39(6),
pp.1213-1232.
Marland, H., 2020. Childbirth and maternity. In Medicine in the Twentieth Century (pp.
559-574). Taylor & Francis.
Moore, V. and Warin, M., 2022. The Reproduction of Shame: Pregnancy, Nutrition and
Body Weight in the Translation of Developmental Origins of Adult
Disease. Science, Technology, & Human Values. p.01622439221108239.
14
1 out of 18
Related Documents


Your All-in-One AI-Powered Toolkit for Academic Success.
+13062052269
info@desklib.com
Available 24*7 on WhatsApp / Email
![[object Object]](/_next/static/media/star-bottom.7253800d.svg)
Unlock your academic potential
© 2024 | Zucol Services PVT LTD | All rights reserved.