Data Analysis Plan: Understanding Chinese Gamers | Global Market
VerifiedAdded on 2023/06/14
|9
|1119
|182
Report
AI Summary
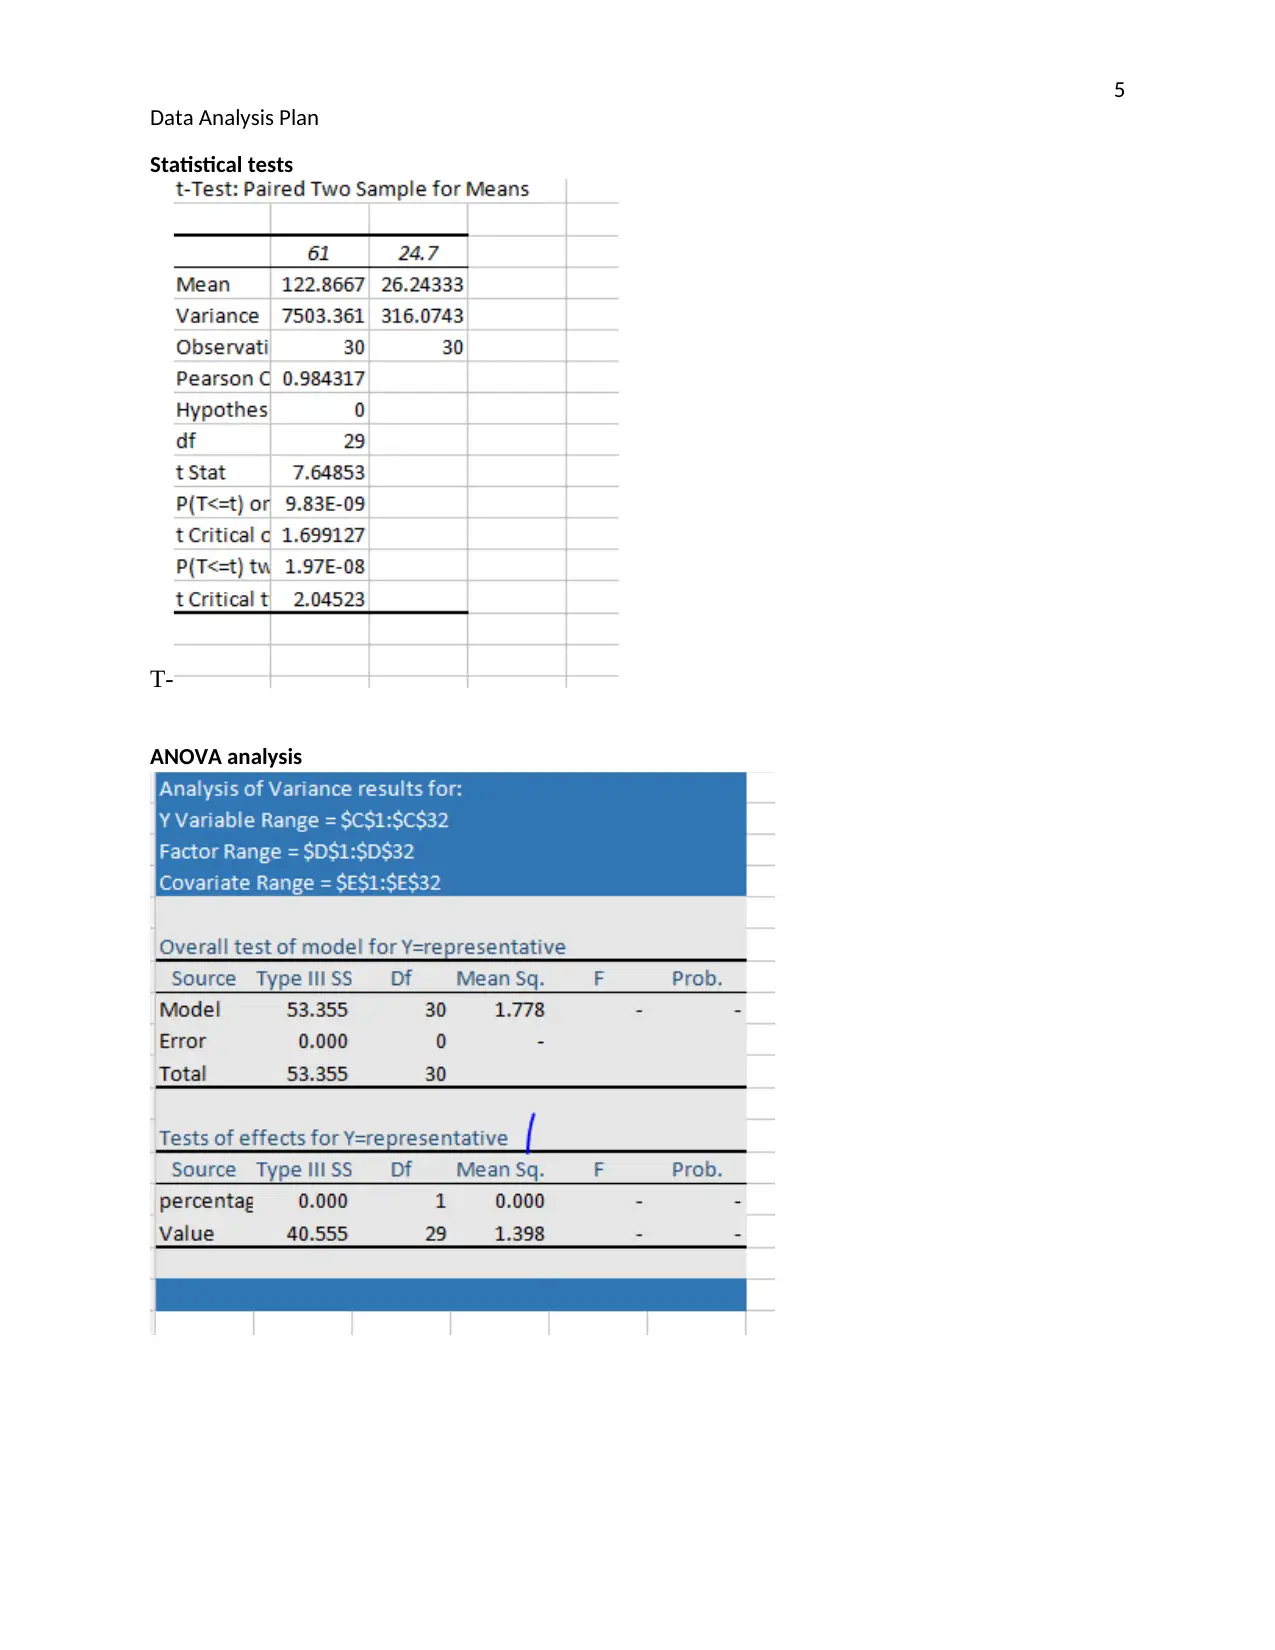
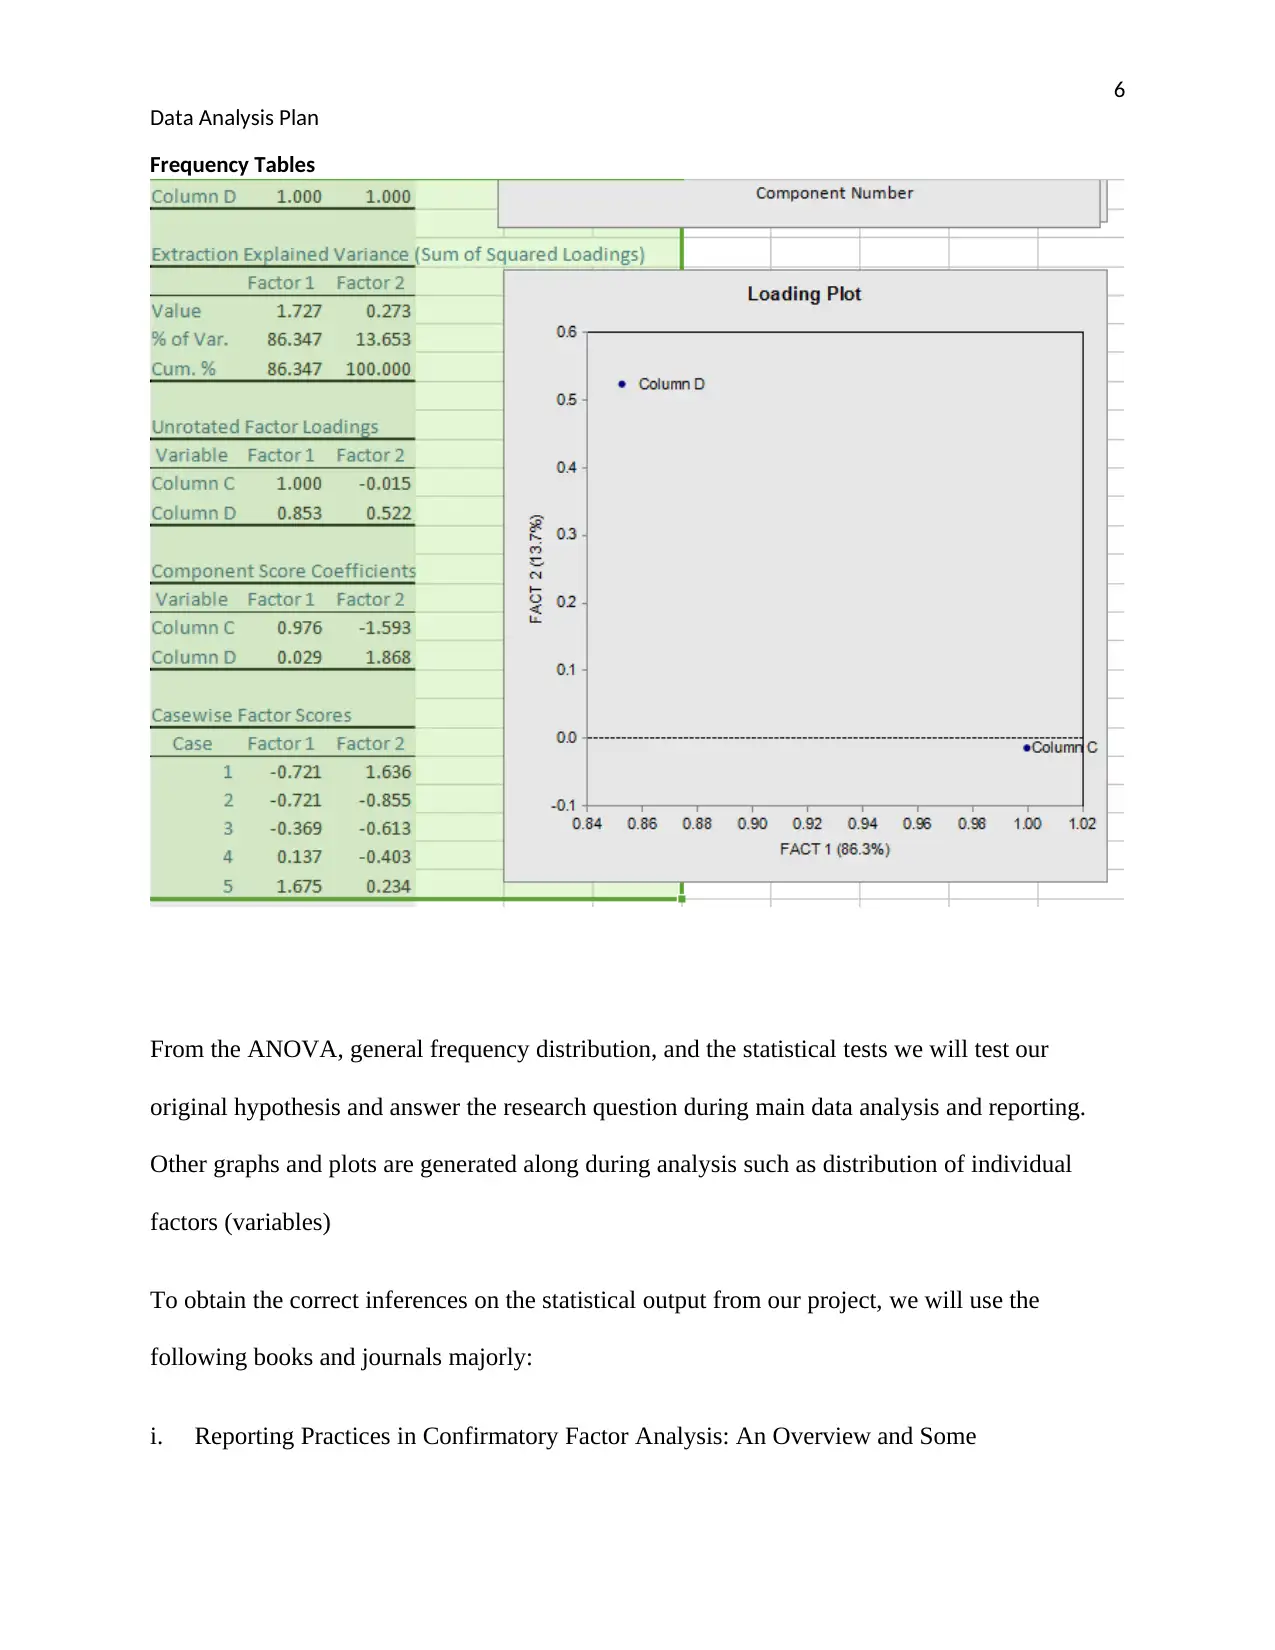
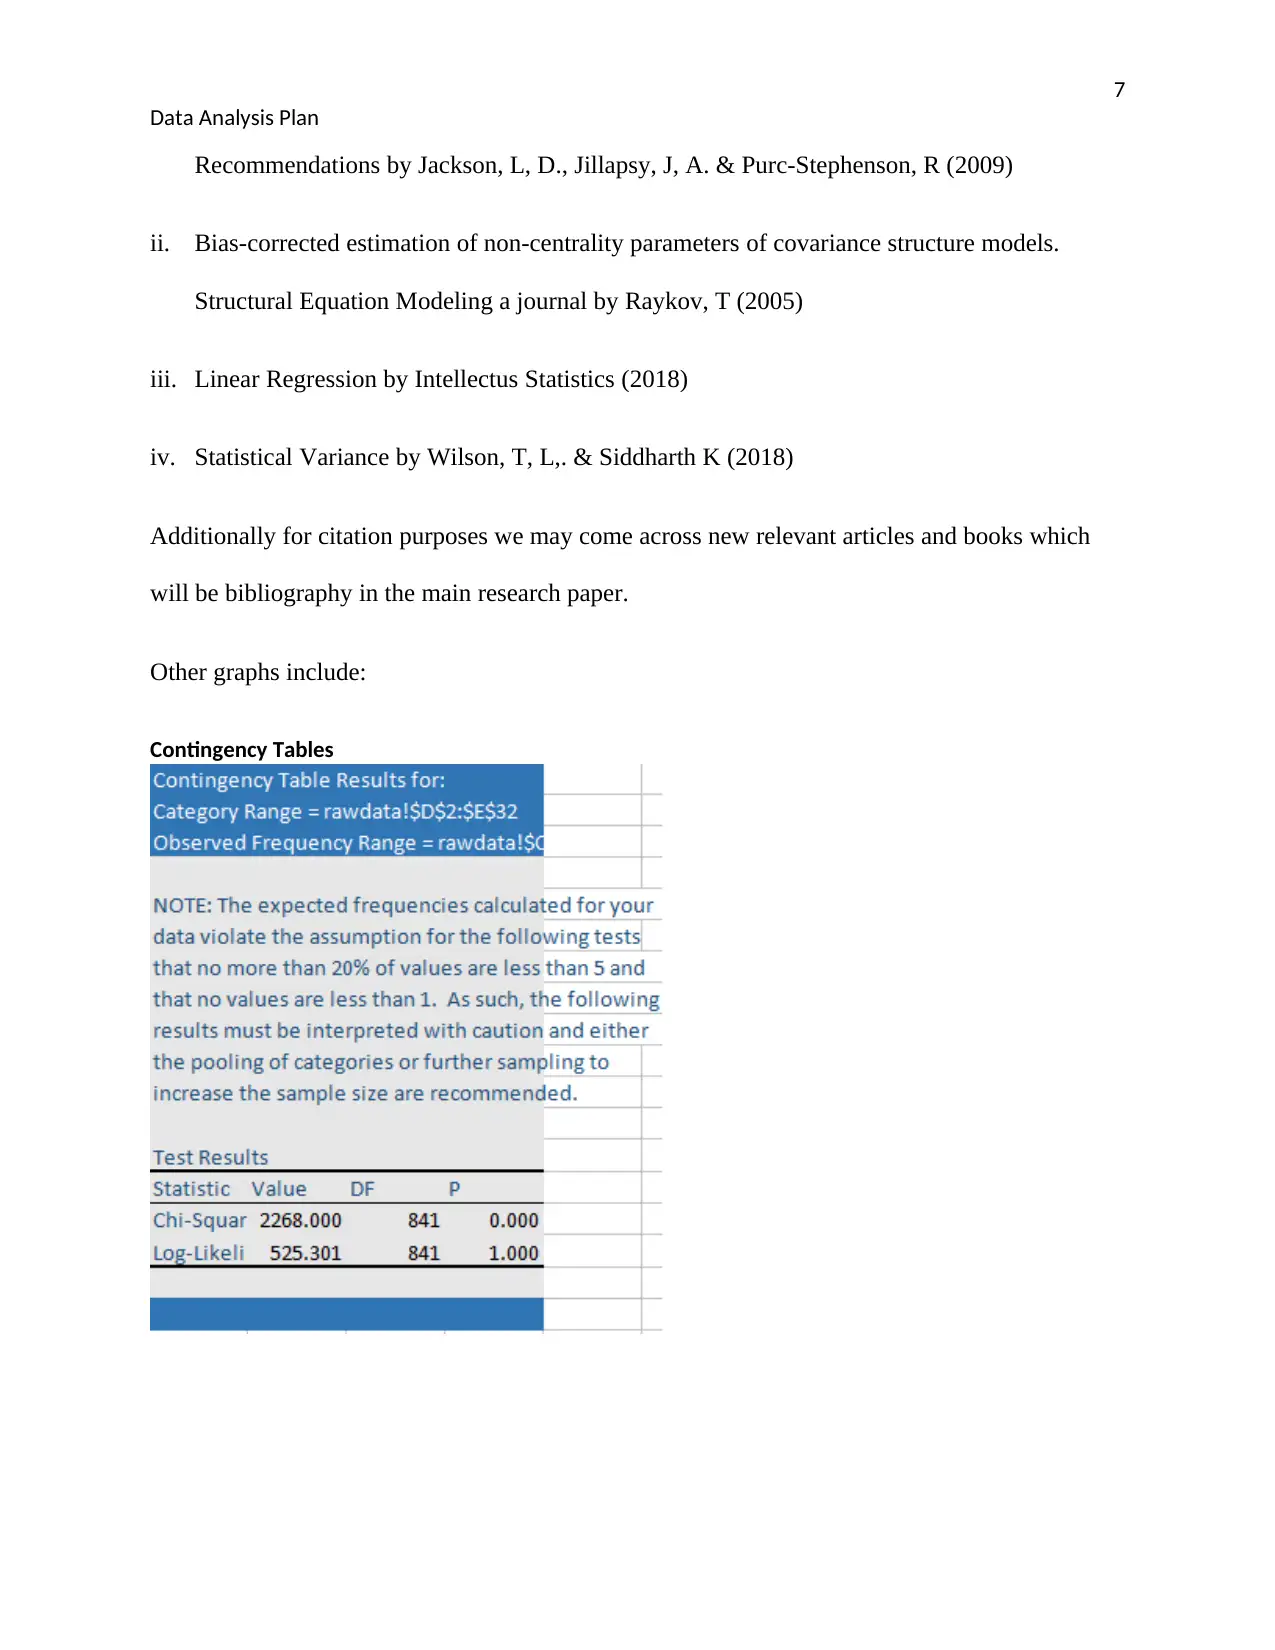
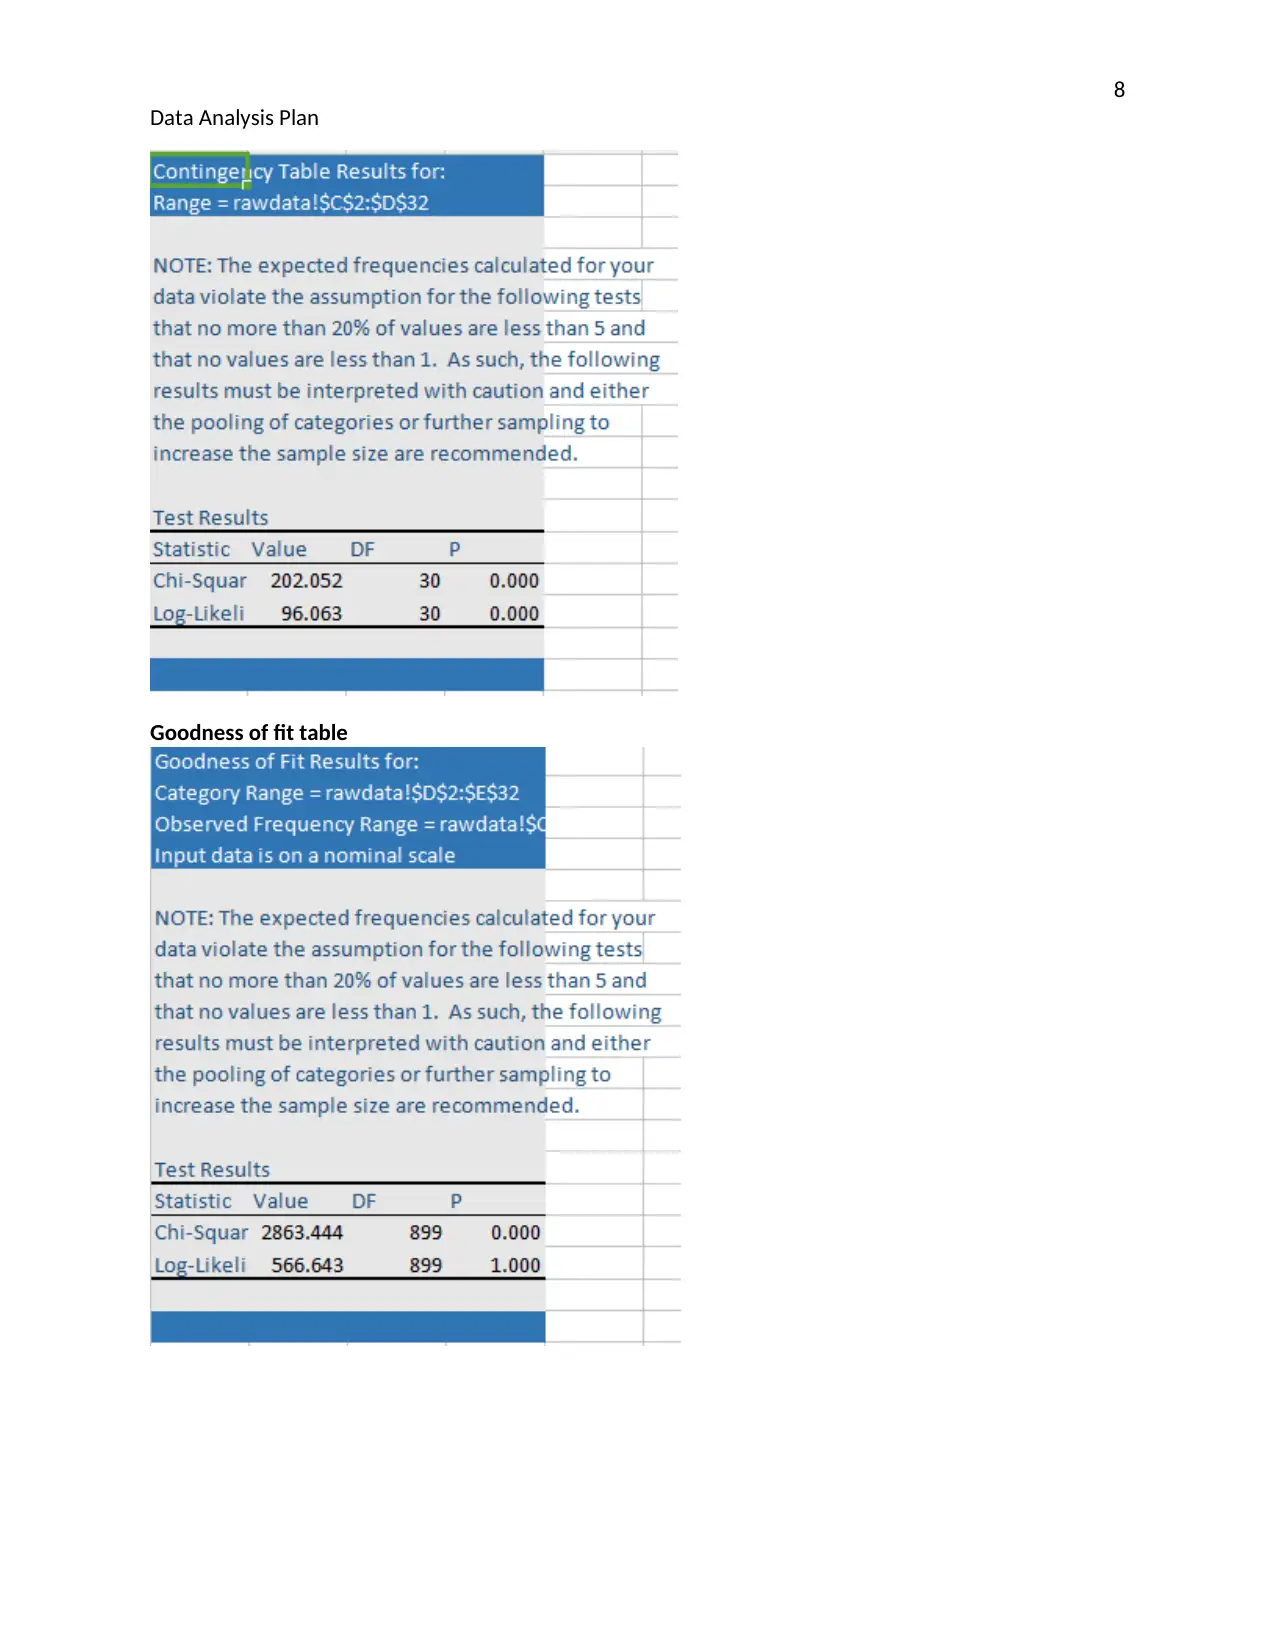
This report presents a data analysis plan designed to investigate the underlying patterns of Chinese gamers within the global market. The research aims to answer questions regarding the time spent gaming, influential factors, and the effects of gaming on Chinese consumers. The analysis utilizes a dataset from surveys conducted among Chinese gamers, focusing on variables such as gaming frequency, devices used, and time spent playing. Statistical methods including factor analysis, ANOVA, contingency analysis, descriptive statistics, and discriminant analysis are employed. The plan outlines the use of StatisticsXL software for conducting these analyses, detailing the process of comparing variables, testing hypotheses, and generating relevant statistical outputs. References to academic articles and research papers on gamer psychology are included to ensure accurate inferences and proper citation. The report also includes frequency tables, ANOVA analysis, contingency tables, goodness-of-fit tests, and factor analysis tables to provide a comprehensive overview of the data and its implications.

1
RUNNINGHEAD: Data Analysis Plan
Research Topic
What are the underlying patterns of the Chinese gamers in the global market
Type of paper:
Research analysis draft, general plan and preliminary process to analysis
Research Questions:
How much time does the average Chinese gamer consume playing video games
What are the common factors that influence gamers in our context the Chinese gamers.
What are the effects of playing video games on the Chinese game consumers?
Hypotheses:
Null hypothesis (H0): There are no a statistically significant factors that influence the perception
and intent to play among the Chinese gamers
Alternative Hypothesis
H1: There are statistically significant factors that influence the gaming behaviour of Chinese
gamers
In our analysis we used a data-set used generated from sample surveys conducted among two
groups on the factors that influence their desire to play video games as a means of passing time
or for other reasons. It contains 4 variables collected from 498 Chinese gamers spread across ,
however during our analysis; we dropped some redundant entries after data cleaning and
normalization. The variables that were considered to explain the behaviour of the gamers were:
i. How frequent the gamers played
Paraphrase This Document
Need a fresh take? Get an instant paraphrase of this document with our AI Paraphraser

2
Data Analysis Plan
ii. Devices used in playing games
iii. Whether the games were free or paid for
iv. How much time was spent by the players playing the games
To answer our research question we conducted :
i. Factor analysis
ii. Analysis of variance
iii. Contingency analysis
iv. Descriptive statistics
v. Discriminant analysis
An ANOVA test is used to explore existence of statistical significance among the factors
proposed to influence the Chinese gamers. The frequency of the factors were to be examined so
as to rank their importance.For such we employ ANOVA analysis for its efficiency to outline the
underlying relationship.
Tests carried out:
Chi-square test
To establish if the independent variables predict the dependent variable, the f-test will aid in
determining the linear regression of the null hypothesis
Assumptions assessed:
i. Linearity
ii. Homoscedasticity

3
Data Analysis Plan
Linearity assumes a straight-line relation between independent and dependent In the data
analysis, linearity and homoscedasticity examination will be by use of scatterplots. Therefore, if
we regress the response and predictor variables, we hope to find a relationship
Analysis output:
What is to be done:
Generating graphs and output the important statistics such as the loglikelihood and other tests
produced by the software to be used in testing the null and alternative hypothesis. The ANOVA
table will be key in identifying the important statistics such as:
mean of variances
Sum of squares
Source of variation
We will mostly use linear regression in plotting and fitting of the response variables with
independent variables.
Reference for our paper will be related to gaming articles and research paper for the gamers
psychology
Software used for analysis
Due to its lightweight and suitability at the moment we will use StatisticsXL software an add-in
for excel to conduct our data analysis needs. It generally does not involve codes, hence easy to
use for anyone requiring data insights.
Process for analysis using software
Comparing the interest variables through adding them into the variable space provided by
StatisticsXL such that the response variable is time taken to play games and frequency as
predictor variable, we used the contingency button under StatisticsXL add-in
⊘ This is a preview!⊘
Do you want full access?
Subscribe today to unlock all pages.

Trusted by 1+ million students worldwide

4
Data Analysis Plan
For the frequency table, we explored it using the frequency button to determine distribution of
the data, also We conducted ANOVA to test for the mean square regression and p-value using
the analysis of variance button where we fitted the response variable against predictor variables
to obtain the statistics for testing our hypothesis about the effect of video games on consumer
behaviour
We explored the descriptive statistics for different variables through loading the interest
variables and outputting the results. Additionally, the goodness of fit test was conducted using
the button for the goodness of fit process so as to test how the different variables perform when
fitted against time used by game players.
Using the plot button we generated the various plots through fitting the X-variable and Y-
variable. The plots provide general view for relationship between the variables. StatisticsXL
provided a way to plot the data through identifying the variables.
Factor analysis button in av provides space for testing the performance of the factors(variables)
against each other so that we can draw insights. The button for discriminant Analysis provides a
means to calculate the extracted explained variance, after clicking on the button we input the
variables that we wish to explore variance for and output the statistics. All the tables were then
copied into our report for explanation and inferring. Generally, our data analysis process
involved inputting the interest variables in the fields provided by StatisticsXL for analysis
Images of the general statistical results from use of statistical software
Paraphrase This Document
Need a fresh take? Get an instant paraphrase of this document with our AI Paraphraser

5
Data Analysis Plan
Statistical tests
T-
ANOVA analysis
Data Analysis Plan
Statistical tests
T-
ANOVA analysis

6
Data Analysis Plan
Frequency Tables
From the ANOVA, general frequency distribution, and the statistical tests we will test our
original hypothesis and answer the research question during main data analysis and reporting.
Other graphs and plots are generated along during analysis such as distribution of individual
factors (variables)
To obtain the correct inferences on the statistical output from our project, we will use the
following books and journals majorly:
i. Reporting Practices in Confirmatory Factor Analysis: An Overview and Some
⊘ This is a preview!⊘
Do you want full access?
Subscribe today to unlock all pages.

Trusted by 1+ million students worldwide

7
Data Analysis Plan
Recommendations by Jackson, L, D., Jillapsy, J, A. & Purc-Stephenson, R (2009)
ii. Bias-corrected estimation of non-centrality parameters of covariance structure models.
Structural Equation Modeling a journal by Raykov, T (2005)
iii. Linear Regression by Intellectus Statistics (2018)
iv. Statistical Variance by Wilson, T, L,. & Siddharth K (2018)
Additionally for citation purposes we may come across new relevant articles and books which
will be bibliography in the main research paper.
Other graphs include:
Contingency Tables
Paraphrase This Document
Need a fresh take? Get an instant paraphrase of this document with our AI Paraphraser

8
Data Analysis Plan
Goodness of fit table
Data Analysis Plan
Goodness of fit table

9
Data Analysis Plan
Factor analysis table
The tables will provide salient points from which we can derive our inferences. However in the paper we
will present the graphical output as data tables and separate graphs. s
Data Analysis Plan
Factor analysis table
The tables will provide salient points from which we can derive our inferences. However in the paper we
will present the graphical output as data tables and separate graphs. s
⊘ This is a preview!⊘
Do you want full access?
Subscribe today to unlock all pages.

Trusted by 1+ million students worldwide
1 out of 9
Related Documents

Your All-in-One AI-Powered Toolkit for Academic Success.
+13062052269
info@desklib.com
Available 24*7 on WhatsApp / Email
Unlock your academic potential
© 2024 | Zucol Services PVT LTD | All rights reserved.