Detailed Analysis of Building Codes, Performance, and Materials
VerifiedAdded on 2021/04/24
|8
|2502
|118
Homework Assignment
AI Summary
This assignment solution comprehensively addresses various aspects of building codes, construction practices, and material science. It covers topics such as building classifications, performance requirements, deemed-to-satisfy solutions, alternative solutions, and fire resistance. The document explores material suitability, including recycled materials, steel construction, and fire-resistant materials. It also delves into site preparation, roofing requirements, and structural considerations such as stress, strain, compression, and bending. Furthermore, it discusses active and passive fire protection measures, building documentation requirements, and worker facilities. The assignment provides insights into different building materials like fabric, rock, and concrete, and it explains compliance levels and solutions. This resource is designed to aid students in understanding civil engineering principles.
Question 1
Class 1 building
Class 2 building
Class 9 building
Class 6 building
Class 1 building
Class 3 building
Class 6 building
Class 3 building
Class 6 building
Class 6 building
Class 7 building
Class 9 building
Question 2
States that objectives are set according to the community expectations, the functional statements need
to show how the building meets its objective, performance requirements should establish how building
elements would achieve the functional statements and objectives and the building solution.
Question 3
I would follow the requirements of performance that direct the least level of performance for the
plumbing, buildings and drainage installations. The requirements of performance, as well as the
general supporting requirements, are the main code requirements. Masonry accessories have a
satisfactory performance requirement if considered in installation and construction in either the
AS 4773 or AS 3700.
Question 4
The standard has execution, specification and control earthwork testing guidance and is associated with
residential and commercial site preparation developments. In itself, it does not constitute earthwork
specification and with the specifier considering the project guideline applicability.
States the roofing needs protection from debris as well as loose materials in the process of construction.
Also, there needs to be the allocation of thermal movement in the process of installation. A movement
should be in joints as well as fastenings. There has to be the material separation between incompatible
materials. Cleaning should be done to remove any foreign materials.
Question 5
The three criteria used for DST are;
Formulation of performance solution whereby there is a combination of one or more of;
verification method, suitability evidence, comparing the deemed-to-satisfy method to the
performance solution and expert judgement.
Use of Deemed-to-satisfy solution by using a combination of these two; expert judgement and
suitability evidence.
Class 1 building
Class 2 building
Class 9 building
Class 6 building
Class 1 building
Class 3 building
Class 6 building
Class 3 building
Class 6 building
Class 6 building
Class 7 building
Class 9 building
Question 2
States that objectives are set according to the community expectations, the functional statements need
to show how the building meets its objective, performance requirements should establish how building
elements would achieve the functional statements and objectives and the building solution.
Question 3
I would follow the requirements of performance that direct the least level of performance for the
plumbing, buildings and drainage installations. The requirements of performance, as well as the
general supporting requirements, are the main code requirements. Masonry accessories have a
satisfactory performance requirement if considered in installation and construction in either the
AS 4773 or AS 3700.
Question 4
The standard has execution, specification and control earthwork testing guidance and is associated with
residential and commercial site preparation developments. In itself, it does not constitute earthwork
specification and with the specifier considering the project guideline applicability.
States the roofing needs protection from debris as well as loose materials in the process of construction.
Also, there needs to be the allocation of thermal movement in the process of installation. A movement
should be in joints as well as fastenings. There has to be the material separation between incompatible
materials. Cleaning should be done to remove any foreign materials.
Question 5
The three criteria used for DST are;
Formulation of performance solution whereby there is a combination of one or more of;
verification method, suitability evidence, comparing the deemed-to-satisfy method to the
performance solution and expert judgement.
Use of Deemed-to-satisfy solution by using a combination of these two; expert judgement and
suitability evidence.
Paraphrase This Document
Need a fresh take? Get an instant paraphrase of this document with our AI Paraphraser
Combining the deemed-to-satisfy solutions with performance solutions.
Question 6a
Use of recycled materials, use of steel construction materials and the use of dry but light materials.
Question 6b
The requirements leading to satisfaction of the deemed-to-satisfy involve complying with;
Resistance from different combined actions.
Determining of individual actions.
Determining the material structural resistance and construction forms.
Resistance to loads such as live loads. Dead loads and combined loads.
Question 7
Levels of fire resistance are to be graded according to the specifications of the type. In type A, the
following order of criteria has to be followed in fire resistance construction;
Structural adequacy.
Integrity.
Insulation.
In addition to these, the certifier has to issue an approval document with necessary schedules of safety
measures, lists, occupation certificate, determinations, and certificate of classification as well as the
certificate of compliance. An issuance of these documents allows rating of elements of safety in the fire.
Non-compliant buildings have to be nominated in logbooks of safety measures for annual statements.
Question 8
The criteria include;
Structural adequacy where the structure’s ability to maintain the capacity to bear load and stability after
testing is determined. The structure is deemed to fail if there is a collapse of the element or if the
element has deflection rate that is excessive to the prescribed limits.
The integrity that entails the door’s ability to keep off flames as well as hot gases if tested to these
specifications. Failure is deemed when flaming occurs continuously on the side of the door that is not
exposed. Also, failure occurs when openings exist allowing flames to reveal themselves.
Insulation whereby a door could maintain the temperature to a specified value below the limit on the
exposed surface to flames if tested accordingly. It is deemed to fail when temperature from a side that is
not exposed riding to exceed the predetermined value.
Question 9
An active determination is assessed by the installation or presence of communicating, detecting and
smoke control devices that could inform instances of the outbreak of fire. This is a proactive way of
extinguishing the fire. Such devices include;
Fire Break Glass Alarm.
Usable fire extinguishers.
Thermal and smoke detectors.
A passive determination is assessed by the full-scale test of an incorporated structural system with the
protection against fire by evaluation of the effectiveness of materials used for protection. There are
numerous methods used in the method that include;
Timber encasing.
Concrete filling.
Flame shields.
Question 10
Every individual solution has a unique performance solution. The solutions used are usually flexible in
attaining the outcomes together with the used technology. Solutions in performance would directly
address the required performance by the use of one or any other recommended method of assessment.
An alternative solution is known as the solution in the building that would comply with the required
performance as well as satisfying the provisions put in place in the deemed-to-satisfy criterion.
An example that falls under alternative solution is hinged-do0r automation. This method allows the
provision of better solutions in building and allows the provision of greater accessibility levels for users
in the concerned building.
Question 11
Three drawing copies of that show the floor plan for each level, sections, elevations, sizes,
dimensions and scaled structural member locations.
Three specified copies describing the methods and materials that are to be used for
constructing.
The use statement or the intended use of the building to be indicated on the plan allotment.
Three allotment plan copies that are scaled to not less than 1:500 or any other approved scale
that show the set sub-regulations.
Report or computational copy demonstrating the building‘s construction of compliance.
Question 12
Documents of submission as well as approval plans, duties of the site supervisors, and construction
builders, a design of the building and its construction, installation of the building’s exterior features, the
building’s occupation and miscellaneous features included.
Question 13
Detail drawings, component drawing, block plan, assembly drawings, floor plans, site plans, scale
drawings, perspective, technical drawings and concept drawings
Question 14
In multiple classifications, every building’s part has to be categorized separately as follows;
⊘ This is a preview!⊘
Do you want full access?
Subscribe today to unlock all pages.

Trusted by 1+ million students worldwide
(a)
(i) situations of parts with various purposes — if the area has a floor area that does not exceed the 10%
area, the minor use falls under a different classification while the major use classification would apply
for the remaining building.
(ii) The provisions of a situation (i) fail to apply in case the minor use of the building’s section is a
laboratory or classes 3, 2 or 4.(b) Machinery rooms, plant rooms, lift room, and many more of such
criteria should have a similar classification in the building's part of an area of construction.
(c) A building comprising of various classes has its parts complying with all the regulations and provisions
for the various classifications.
Question 15
The volume contains provisions that are general to the interpretation, application and operation that
are to be dealt with in the construction of buildings. It includes the use of alternatives that would be
deemed-to-satisfy to the provision of accreditation of certificate, there is also the use of performance
requirements in the process of construction and design.
Question 16
- verification method using computer system and application
- evidence of suitability as per NCC codes
- Experts judgement of the compliance of building solutions with performance requirements
- comparison with dts provisions
- use of documentation and other supporting evidence
Question 17
Suitability of building material
Materials used in the building are determined by the class of building which predicts the structure
toughness required. Materials are also influenced by the environmental conditions that are available
across the year. The ease of access to these materials also affects its suitability as well as the cost.
Fire resistance and building materials
Materials used should be having high limits that would lead to fire occurrence as well as leaving less
space for flame passing on them. The exposed side should have the capability of preventing the fire
from reaching the non-exposed side for longer durations.
Question 18
AS 2870 classifies the design, site and construction of single dwelling house residential and footings or a
structure that is similar having separate or detached common wall. These dwelling need not be vertically
below or above another. Residential slab and footings
AS 1684 covers the building practices, design criteria, bracing, tie-downs and span tables used in timber
framing. Residential Timber Framed Construction
Paraphrase This Document
Need a fresh take? Get an instant paraphrase of this document with our AI Paraphraser
AS 3700 provides a guide to the good practice of the materials required, workmanship, temporary
bracing, tolerances, compliance assessment and testing of site control. Masonry Structures
AS 2050 involve the requirement in roofing of buildings during the design and maintenance as well as
construction. Roof Tiling
AS 2047 entails the assertion of the least requirement in the compliance certificate on the warranty,
members participatory accreditation, commission to the code of conduct and the meeting of
requirements needed. Windows and doors
Question 19
Beam performance.
Columns performance.
Roof trusses performance.
Loading and loads.
Behavioural structure of materials.
Force system solutions.
Property sections.
Question 20
a. Stress and strain – when stress and strains were being experienced by a structure orstructural
materials they may break, be destroyed or be deformed. However, if the
materials used in building and construction was chosen based on the risk of the building
being exposed to stress and strain then there is a good chance that the structure and
materials may resist these forces and maintain their form. The use of foam and other
cushioning materials may help to achieve this goal.
b. Compression – compression may cause flattening and deformation to certain materials and
when that happens that may result in loss of purpose and function of that material
that may cause risk to the stability and formation of the building.
c. Bending – Bending may cause damage to the materials, for example, the foundation of the
building may collapse if there is an earthquake because it is unable to resist force from
the disaster.
Question 21
Fabric
They include the circular yurt that was revived with the use of developed tensile architecture as well as
the synthetic fabrics. Properties include water resistant and termite proof.
Rock
It is easily available and is the longest-serving building material with heavy density making it withstand
great compressive forces. Difficult to keep warm unless great resources.
Concrete
Consists of aggregate and binder composition. Has great compressive and tensile properties hence used
in the strengthening of steel rods.
Question 22
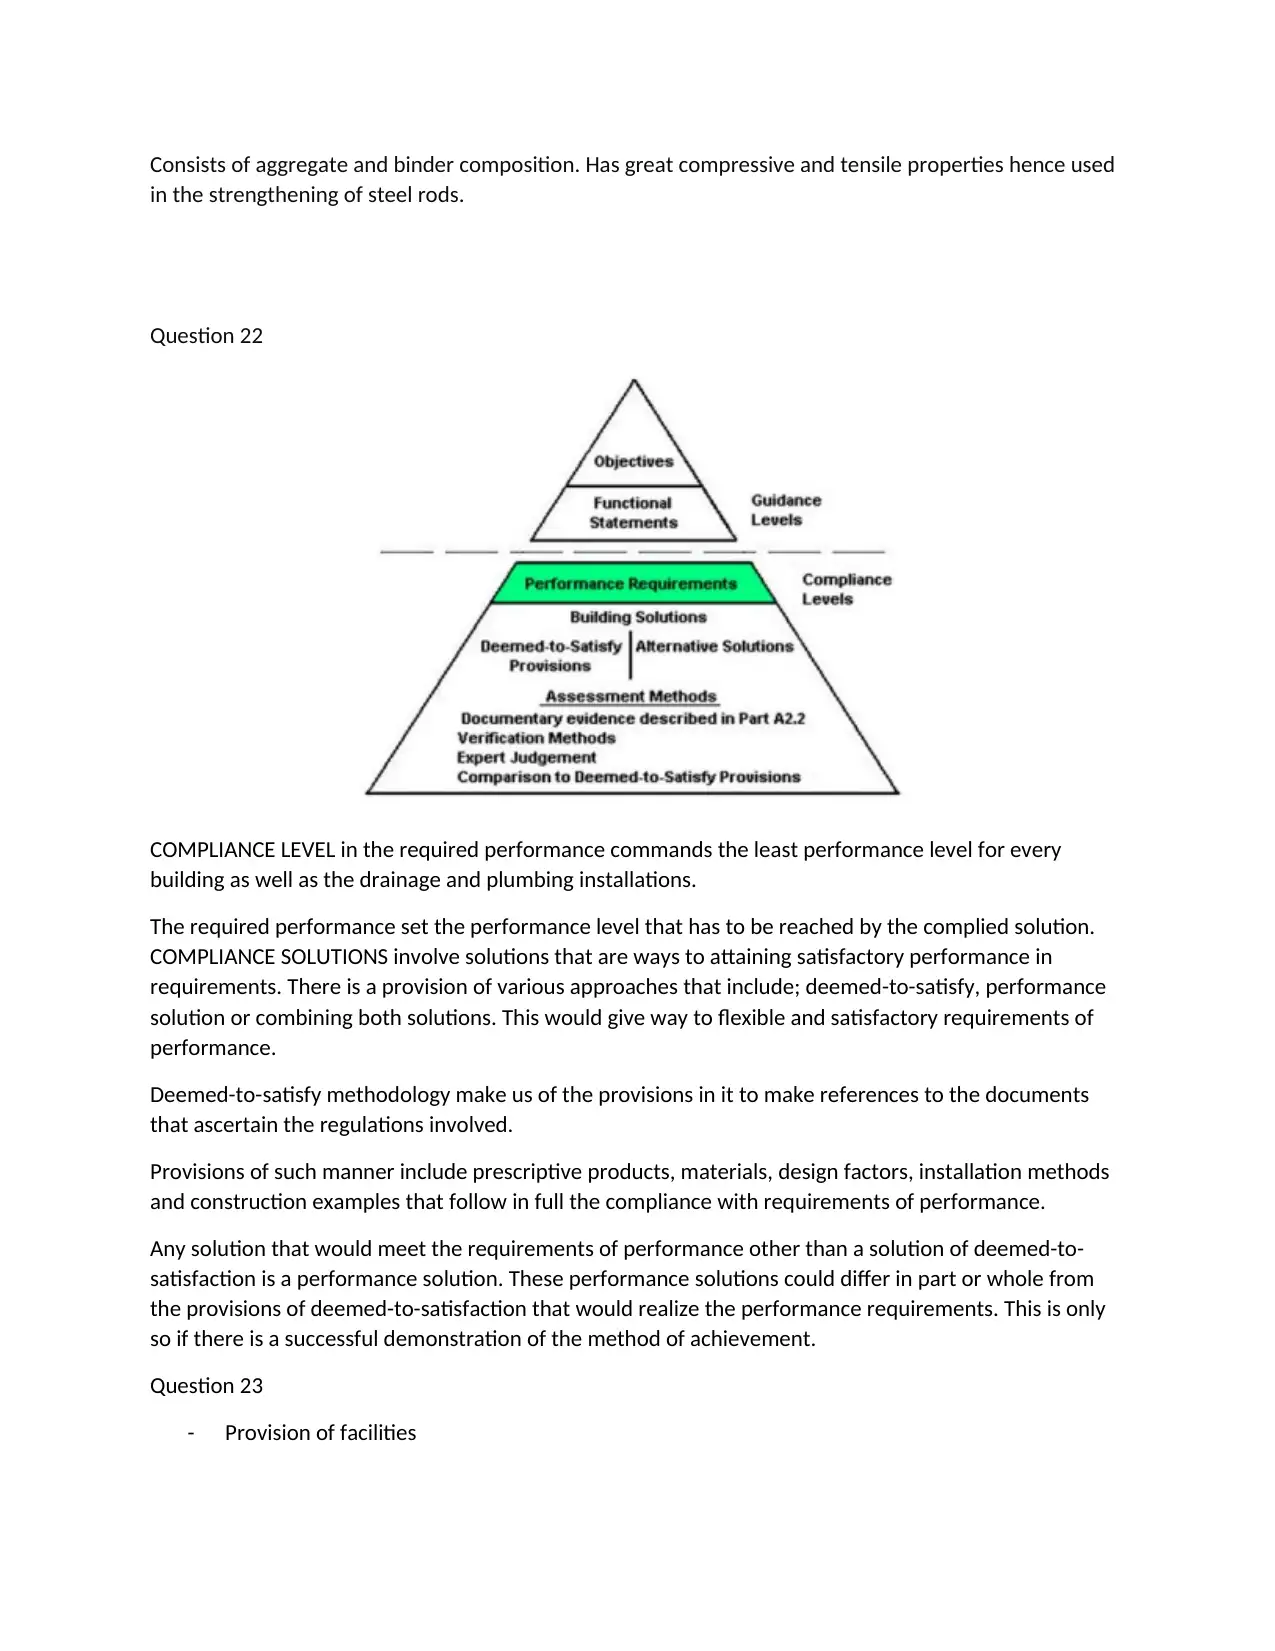
COMPLIANCE LEVEL in the required performance commands the least performance level for every
building as well as the drainage and plumbing installations.
The required performance set the performance level that has to be reached by the complied solution.
COMPLIANCE SOLUTIONS involve solutions that are ways to attaining satisfactory performance in
requirements. There is a provision of various approaches that include; deemed-to-satisfy, performance
solution or combining both solutions. This would give way to flexible and satisfactory requirements of
performance.
Deemed-to-satisfy methodology make us of the provisions in it to make references to the documents
that ascertain the regulations involved.
Provisions of such manner include prescriptive products, materials, design factors, installation methods
and construction examples that follow in full the compliance with requirements of performance.
Any solution that would meet the requirements of performance other than a solution of deemed-to-
satisfaction is a performance solution. These performance solutions could differ in part or whole from
the provisions of deemed-to-satisfaction that would realize the performance requirements. This is only
so if there is a successful demonstration of the method of achievement.
Question 23
- Provision of facilities
⊘ This is a preview!⊘
Do you want full access?
Subscribe today to unlock all pages.

Trusted by 1+ million students worldwide
Employers have to provide ample toilet facility access to each worker during their presence at the
workplace. These facilities have to be readily available. The toilet facilities have to be conveniently
provided taking into consideration the building’s use, the gender and number of occupants as well as
the needs or disabilities that may be present in every individual.
Washing facilities have to be provided. Facilities such as washing basins need to be issued by the
employer or availed with ease thereby allowing easy washing. These washbasins need to be separated
from troughs or sinks.
Rest areas should be provided with the consideration of the nature of work being done. More
considerations on this facility are the number of workers as well as the appropriateness of the area of
rest. Facilities such as restrooms could be put in the same location as first aid room. Workers conducting
work in isolation will have to be given access to emergency devices of communication. S
- Drinking water
The employer has to provide an adequate amount of drinking water that is readily available to the
employees. The points of access have to be of good hygiene and not near toilets.
The drinking water temperature has to be below 240C achievable by refrigeration or providing ice that
would cool the water. The pipes that supply drinking water would have to be protected from direct
sunlight to avoid heating up.
Water being supplied would have numerous points of access hence there would be the need to label
these points as per their use.
- Clothes and changing facilities
Changing rooms would have to be provided to facilitate the change of clothing before and after work. In
instances that workers may be exposed to the hazardous environment would require the provision of
protective gear. These protective gear would then be contaminated after use. Also, these changing
rooms would need to be constructed to allow storage of clothing required for work with proper storing
conditions in accordance with the types of work.
Question 24
Active
- The position of the device.
- Sensitivity
- Hierarchy of action of the device.
- The number of devices.
- The response of the device.
Passive
- Accessibility.
- Length of the device such as hose reels.
- Location of the device.
- Size of the device.
Paraphrase This Document
Need a fresh take? Get an instant paraphrase of this document with our AI Paraphraser
- The mechanical strength of the device.
Question 25
It should be put under multi-classification since it exceeds the class 5 features.
Question 25
It should be put under multi-classification since it exceeds the class 5 features.
1 out of 8
Related Documents
Your All-in-One AI-Powered Toolkit for Academic Success.
+13062052269
info@desklib.com
Available 24*7 on WhatsApp / Email
![[object Object]](/_next/static/media/star-bottom.7253800d.svg)
Unlock your academic potential
Copyright © 2020–2026 A2Z Services. All Rights Reserved. Developed and managed by ZUCOL.


