Making and Evaluating Climagraphs: Climate Analysis Assignment
VerifiedAdded on 2023/05/30
|8
|1020
|328
Homework Assignment
AI Summary
This assignment focuses on creating and evaluating climagraphs for two locations: Alameda NAS, CA, and Alamosa, CO, using climate normals data from 1981-2010. The assignment involves plotting average monthly temperature and precipitation data for each location to create climagraphs. These climagraphs are then analyzed to compare temperature ranges, precipitation levels, and distribution patterns. The analysis leads to the classification of each location's climate type, with Alameda NAS, CA, categorized as a tropical savanna (Aw) and Alamosa, CO, classified as a midlatitude steppe (BSk). The assignment concludes with a discussion of the vegetation associated with each climate type, highlighting adaptations to the specific environmental conditions. The report references relevant sources for climate normals and analysis.

MAKING AND EVALUATING TWO CLIMAGRAPHS
Paraphrase This Document
Need a fresh take? Get an instant paraphrase of this document with our AI Paraphraser
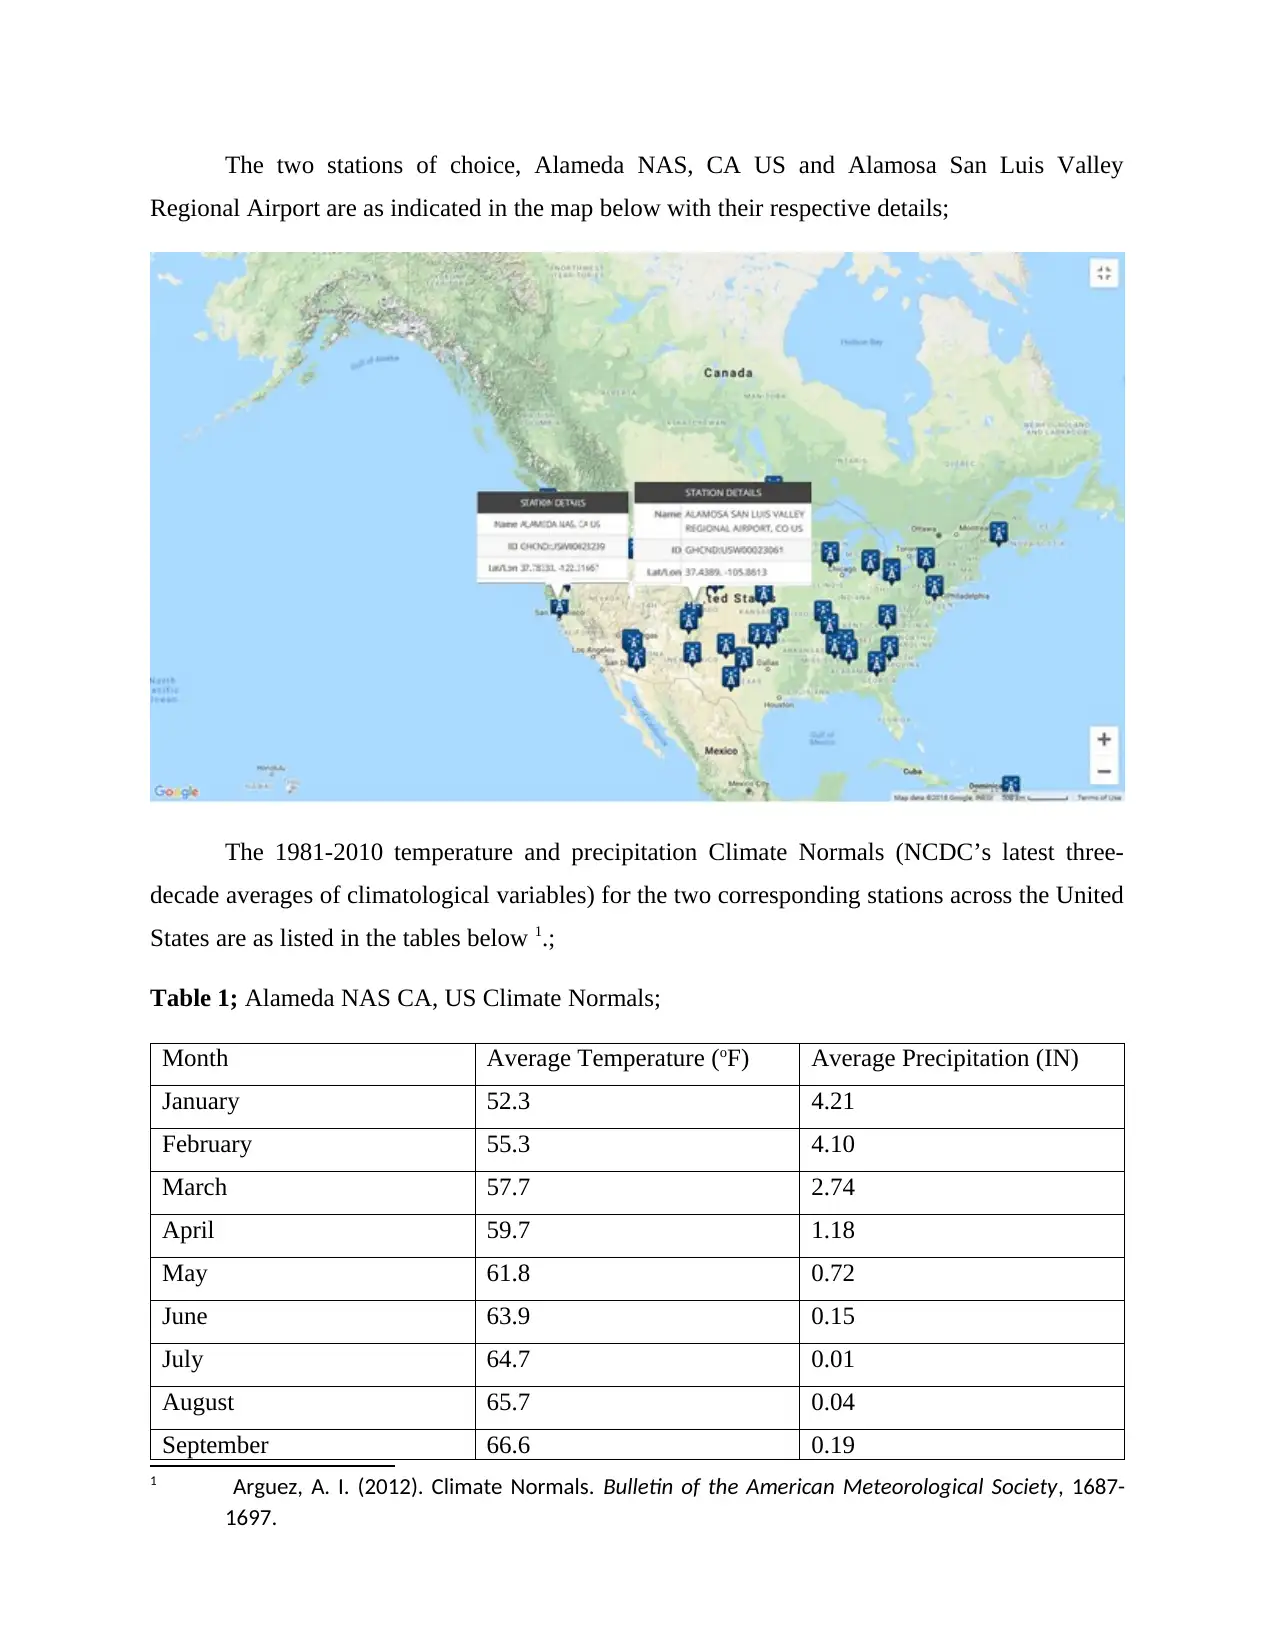
The two stations of choice, Alameda NAS, CA US and Alamosa San Luis Valley
Regional Airport are as indicated in the map below with their respective details;
The 1981-2010 temperature and precipitation Climate Normals (NCDC’s latest three-
decade averages of climatological variables) for the two corresponding stations across the United
States are as listed in the tables below 1.;
Table 1; Alameda NAS CA, US Climate Normals;
Month Average Temperature (oF) Average Precipitation (IN)
January 52.3 4.21
February 55.3 4.10
March 57.7 2.74
April 59.7 1.18
May 61.8 0.72
June 63.9 0.15
July 64.7 0.01
August 65.7 0.04
September 66.6 0.19
1 Arguez, A. I. (2012). Climate Normals. Bulletin of the American Meteorological Society, 1687-
1697.
October 64.5 0.94
November 58.7 2.50
December 52.9 4.00
Table 1; Alamusa SAN LUIS Valley Regional Airport CO, US Climate Normals;
Month Average Temperature (oF) Average Precipitation (IN)
January 16.3 0.26
February 22.8 0.26
March 35.5 0.53
April 41.8 0.59
May 51.2 0.58
June 59.6 0.49
July 64.6 0.97
August 62.7 1.27
September 55.0 0.91
October 43.1 0.68
November 29.5 0.42
December 17.9 0.35
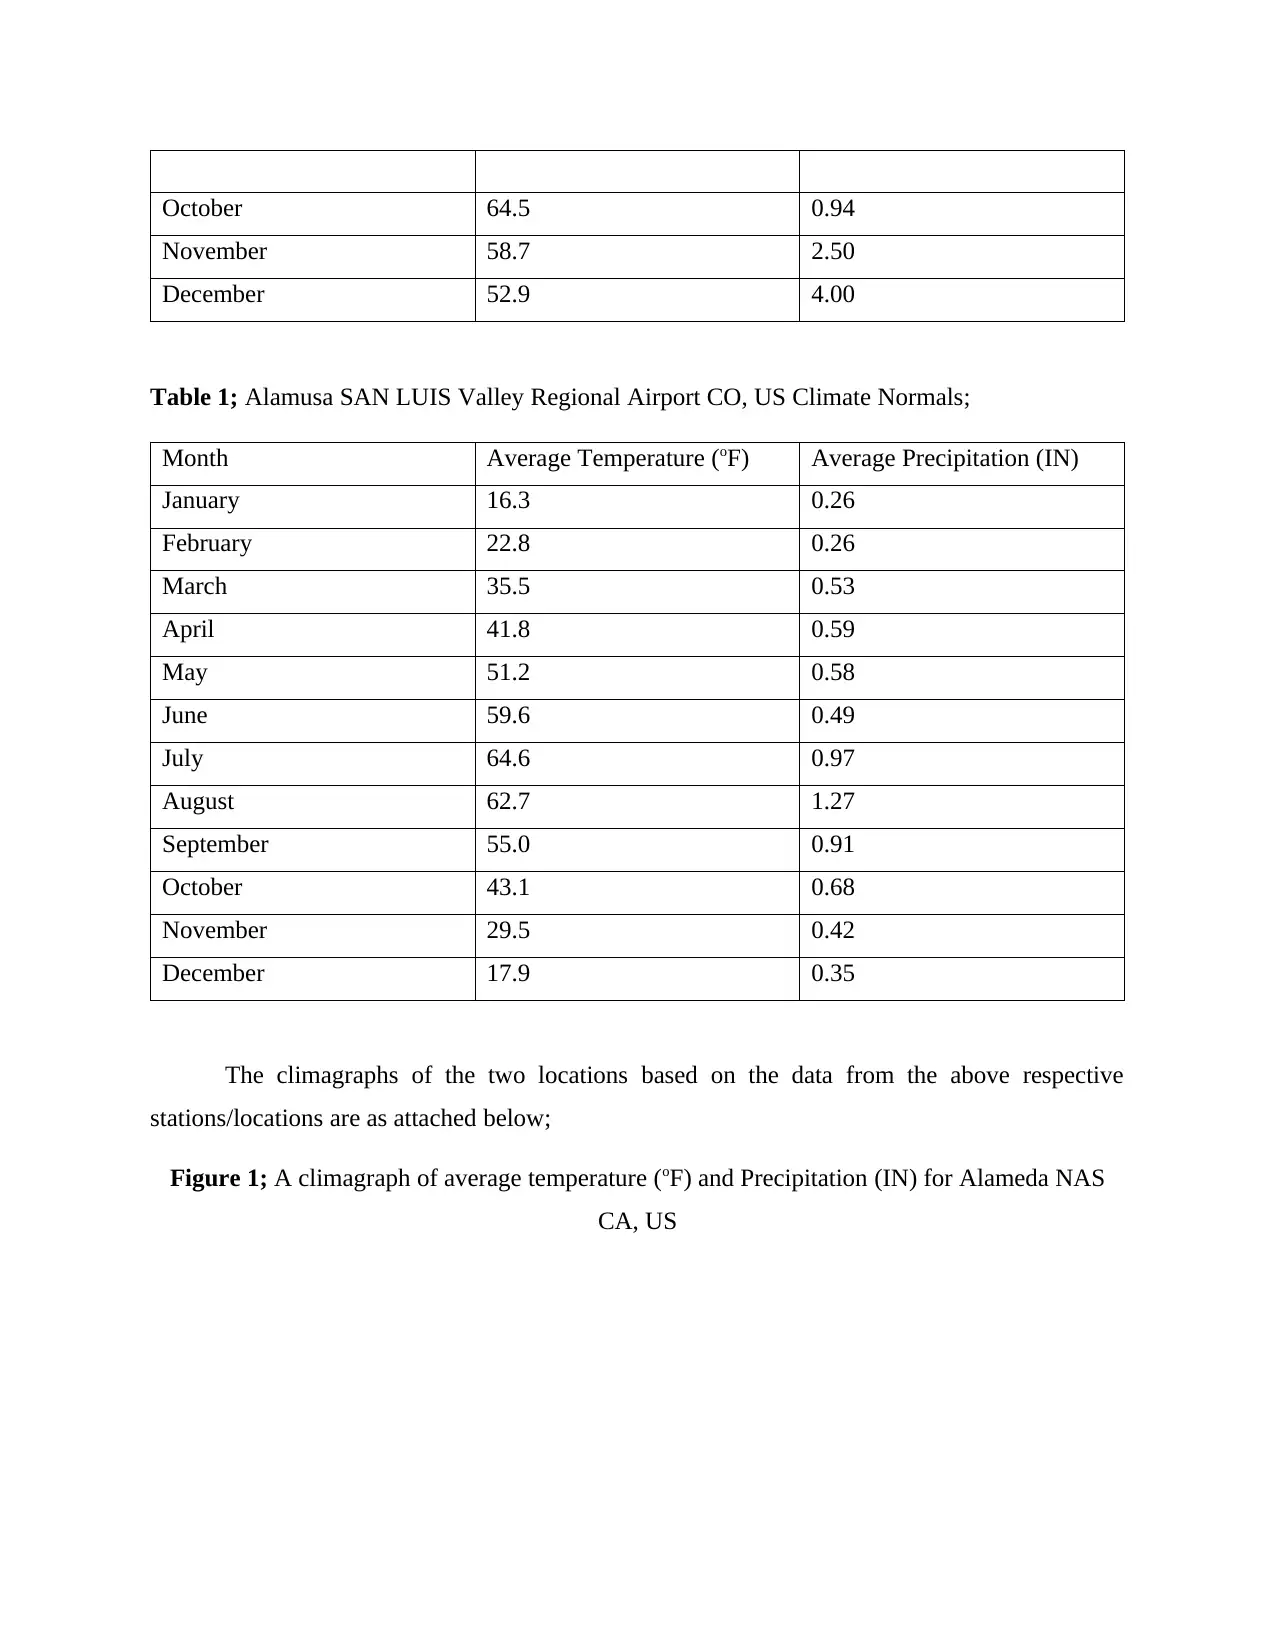
The climagraphs of the two locations based on the data from the above respective
stations/locations are as attached below;
Figure 1; A climagraph of average temperature (oF) and Precipitation (IN) for Alameda NAS
CA, US
⊘ This is a preview!⊘
Do you want full access?
Subscribe today to unlock all pages.

Trusted by 1+ million students worldwide
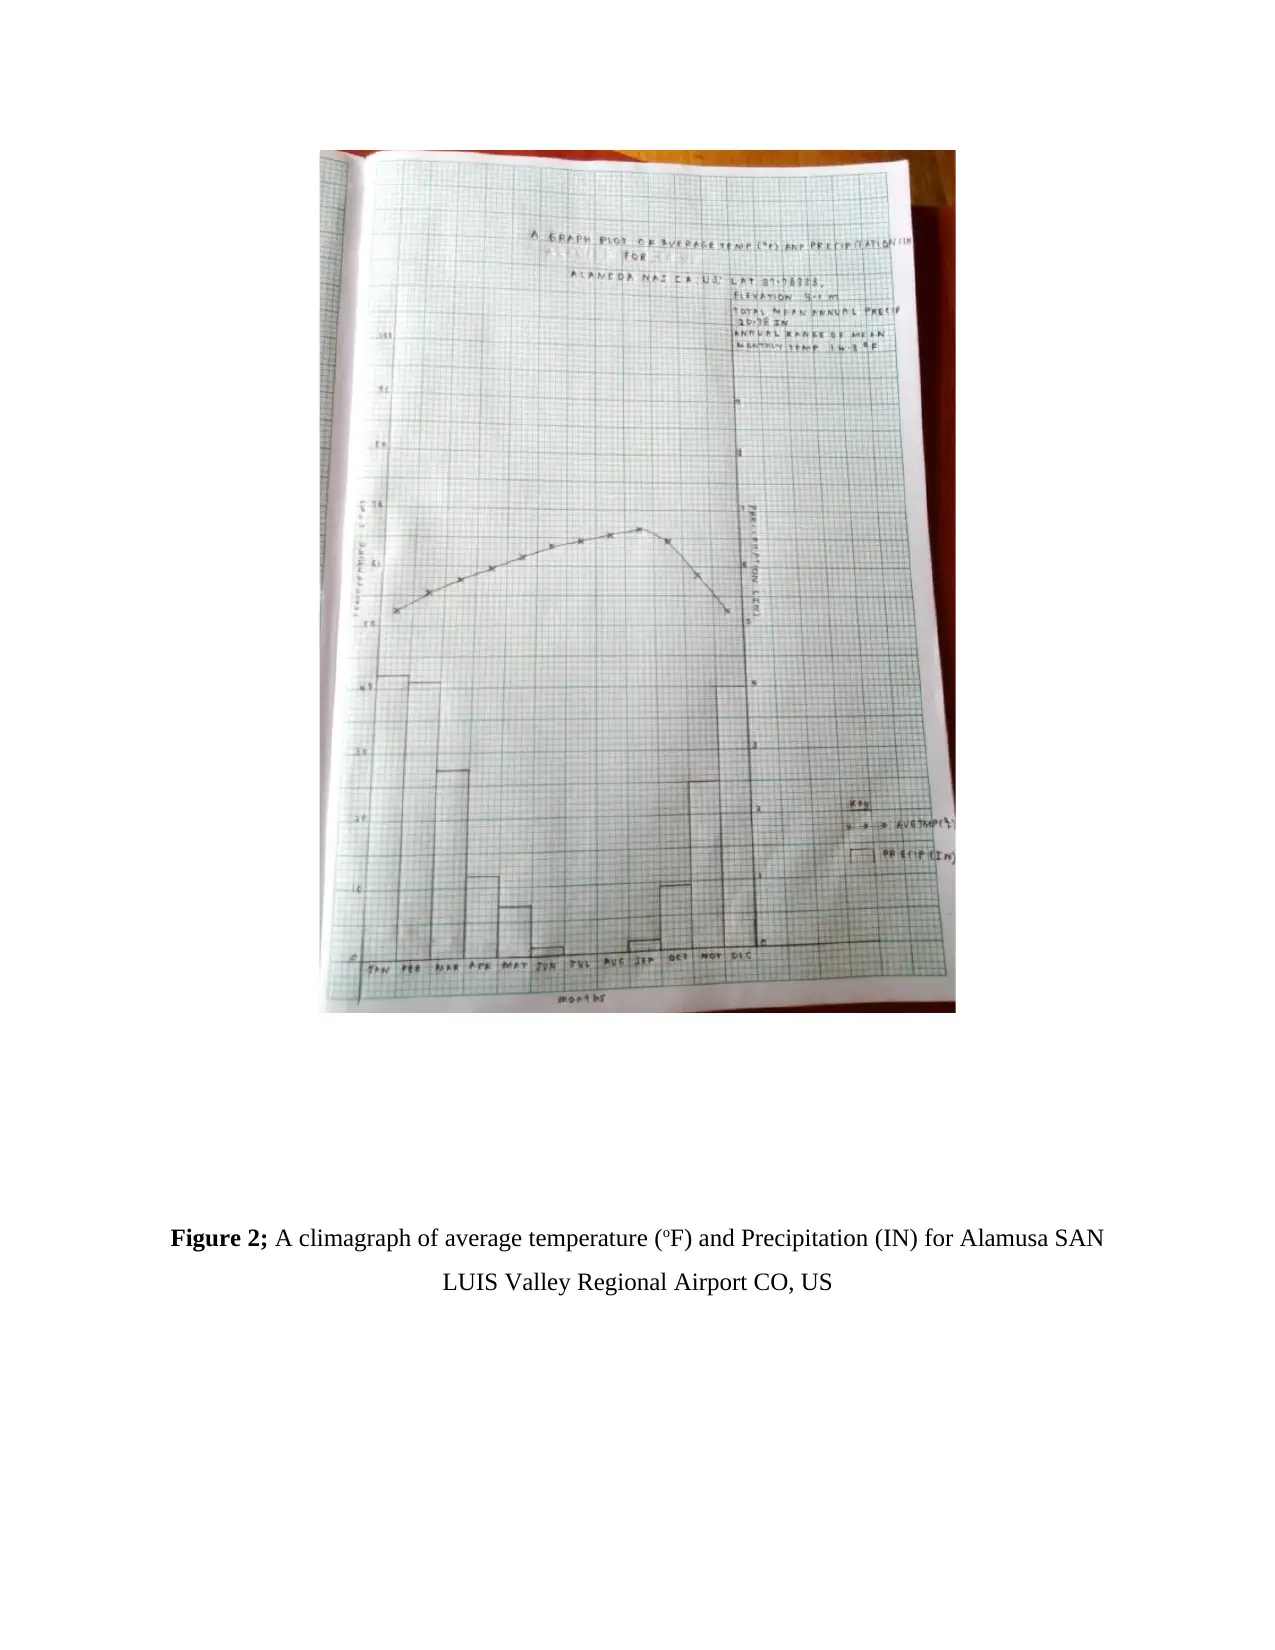
Figure 2; A climagraph of average temperature (oF) and Precipitation (IN) for Alamusa SAN
LUIS Valley Regional Airport CO, US
LUIS Valley Regional Airport CO, US
Paraphrase This Document
Need a fresh take? Get an instant paraphrase of this document with our AI Paraphraser
A climagraph as a time-based graphical representation of a location's basic climate it
displays data for two variables: (a) monthly average temperature and (b) monthly average
precipitation. These representations delineate the physical location on earth through the vast
physical features by its climatic attributes over time. And since people are visual creatures, it
only makes sense to create a visual representation of these three factors, a climagraph.
The time scale, typically on the horizontal axis, is usually over a year or a given period of
years mean divided into respective months where the precipitation is on the vertical axis, denoted
by inches (IN), while the other side of the graph is the temperature scale in oF. A climagraph
amalgamates a graph (bar) of total monthly precipitation with a line of average monthly
temperature relevant in analysis of climatic statistics for the determination of the climate
categorization.
In this study the two locations proved to have significant differences in the average temperature
and precipitation over the last three decades. From the climagraphs plotted, in California US
(Alameda NAS), the annual range of average temperatures/temperature range was 14.3 oF (small)
as compared to the temperature range in Colorado US (Alamusa SAN LUIS Valley Regional
Airport) of 48.3 oF (big). These locations are based on the Northern hemisphere of the world
(Northern America).
From the climagraphs plotted, the total amount of precipitation in California US
(Alameda NAS) was 20.78 IN (abundant precipitation) as compared to that of Colorado US
(Alamusa SAN LUIS Valley Regional Airport) 7.31 IN (little precipitation). The distribution of
precipitation in California US (Alameda NAS) proved to be irregular (dry seasons commencing
June to October) while that of Colorado US (Alamusa SAN LUIS Valley Regional Airport,
proved regular/ equally distributed where the range of precipitation over the whole year is 1.01
IN while that of California US (Alameda NAS) 4.2 IN.
Having the discussion made on the above rigidly analyzed data, the types of climate for
these two locations can be deduced 2. Since California US (Alameda NAS) data analysis proves
presence of humid but dry season and longer with one month under 2.4" (6 cm) at least, it can
most extensively be categorized under type A climate with a description of tropical savannah
(Aw). The presence of averagely elevated temperatures with trivial variances and dry seasons
with no heavy period recompensing for the dry season strengthens this climatic deduction. In the
2 Bilotta, R. J. (2015). Calculation and evaluation of an air-freezing index for the 1981–2010 climate normals period
in the coterminous United States. Journal of Applied Meteorology and Climatology, 69–76
⊘ This is a preview!⊘
Do you want full access?
Subscribe today to unlock all pages.

Trusted by 1+ million students worldwide
second location, Colorado US (Alamusa SAN LUIS Valley Regional Airport, the presence of
precipitation between ten and twenty inches (IN) with a mean annual temperature below 64.4oF
(18oC) sufficiently describes the location under midlatitude steppe (BSk) (middle latitude)
climatic type. The inadequacy of precipitation and the middle ranging temperatures also adds
more value to the deduction.
As far as vegetation, tropical savannas are delineated with large tracts of enduring
grasses, normally between 36 to 72 inches tall. These vegetations are specialized to tolerate long
periods of drought. They exhibit extra-long roots competent of outstretch the water table
intensely underneath the soil covered. In midlatitude steppe (Bsk), the vegetation is located
outermost to the true desert (adjoining the moister C and D climates or at the poleward extent of
the range) where lessened evaporation under cooler surroundings make more of the scanty
rainfall handy as soil moisture for vegetation growth.
Paraphrase This Document
Need a fresh take? Get an instant paraphrase of this document with our AI Paraphraser

REFERENCES
Arguez, A. I. (2012). Climate Normals. Bulletin of the American Meteorological Society, 1687-1697.
Bilotta, R. J. (2015). Calculation and evaluation of an air-freezing index for the 1981–2010 climate
normals period in the coterminous United States. Journal of Applied Meteorology and
Climatology, 69–76.
1 out of 8
Your All-in-One AI-Powered Toolkit for Academic Success.
+13062052269
info@desklib.com
Available 24*7 on WhatsApp / Email
![[object Object]](/_next/static/media/star-bottom.7253800d.svg)
Unlock your academic potential
Copyright © 2020–2026 A2Z Services. All Rights Reserved. Developed and managed by ZUCOL.