Data Analysis of Pizza and Sandwich: Project Report, Spring 2024

Verified

Added on  2022/12/23

|4
|358
|54
Project
AI Summary
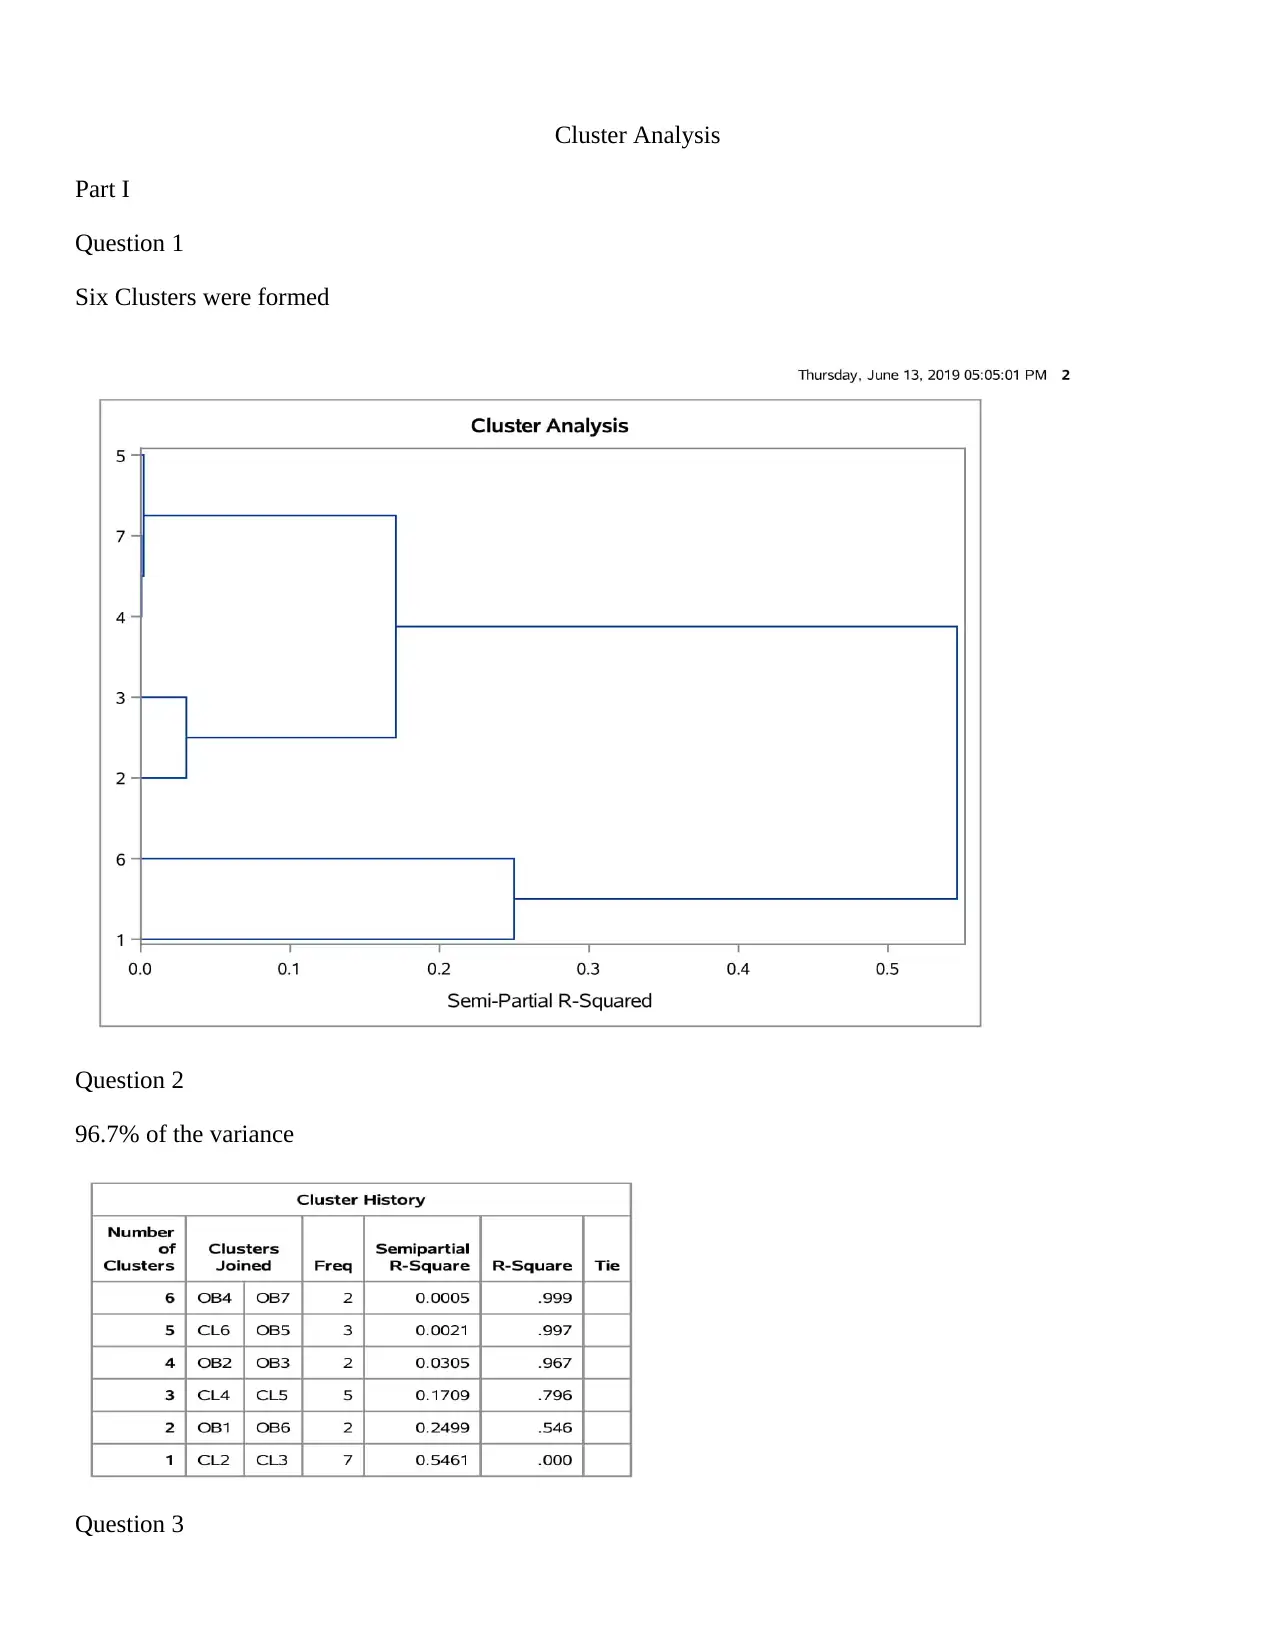
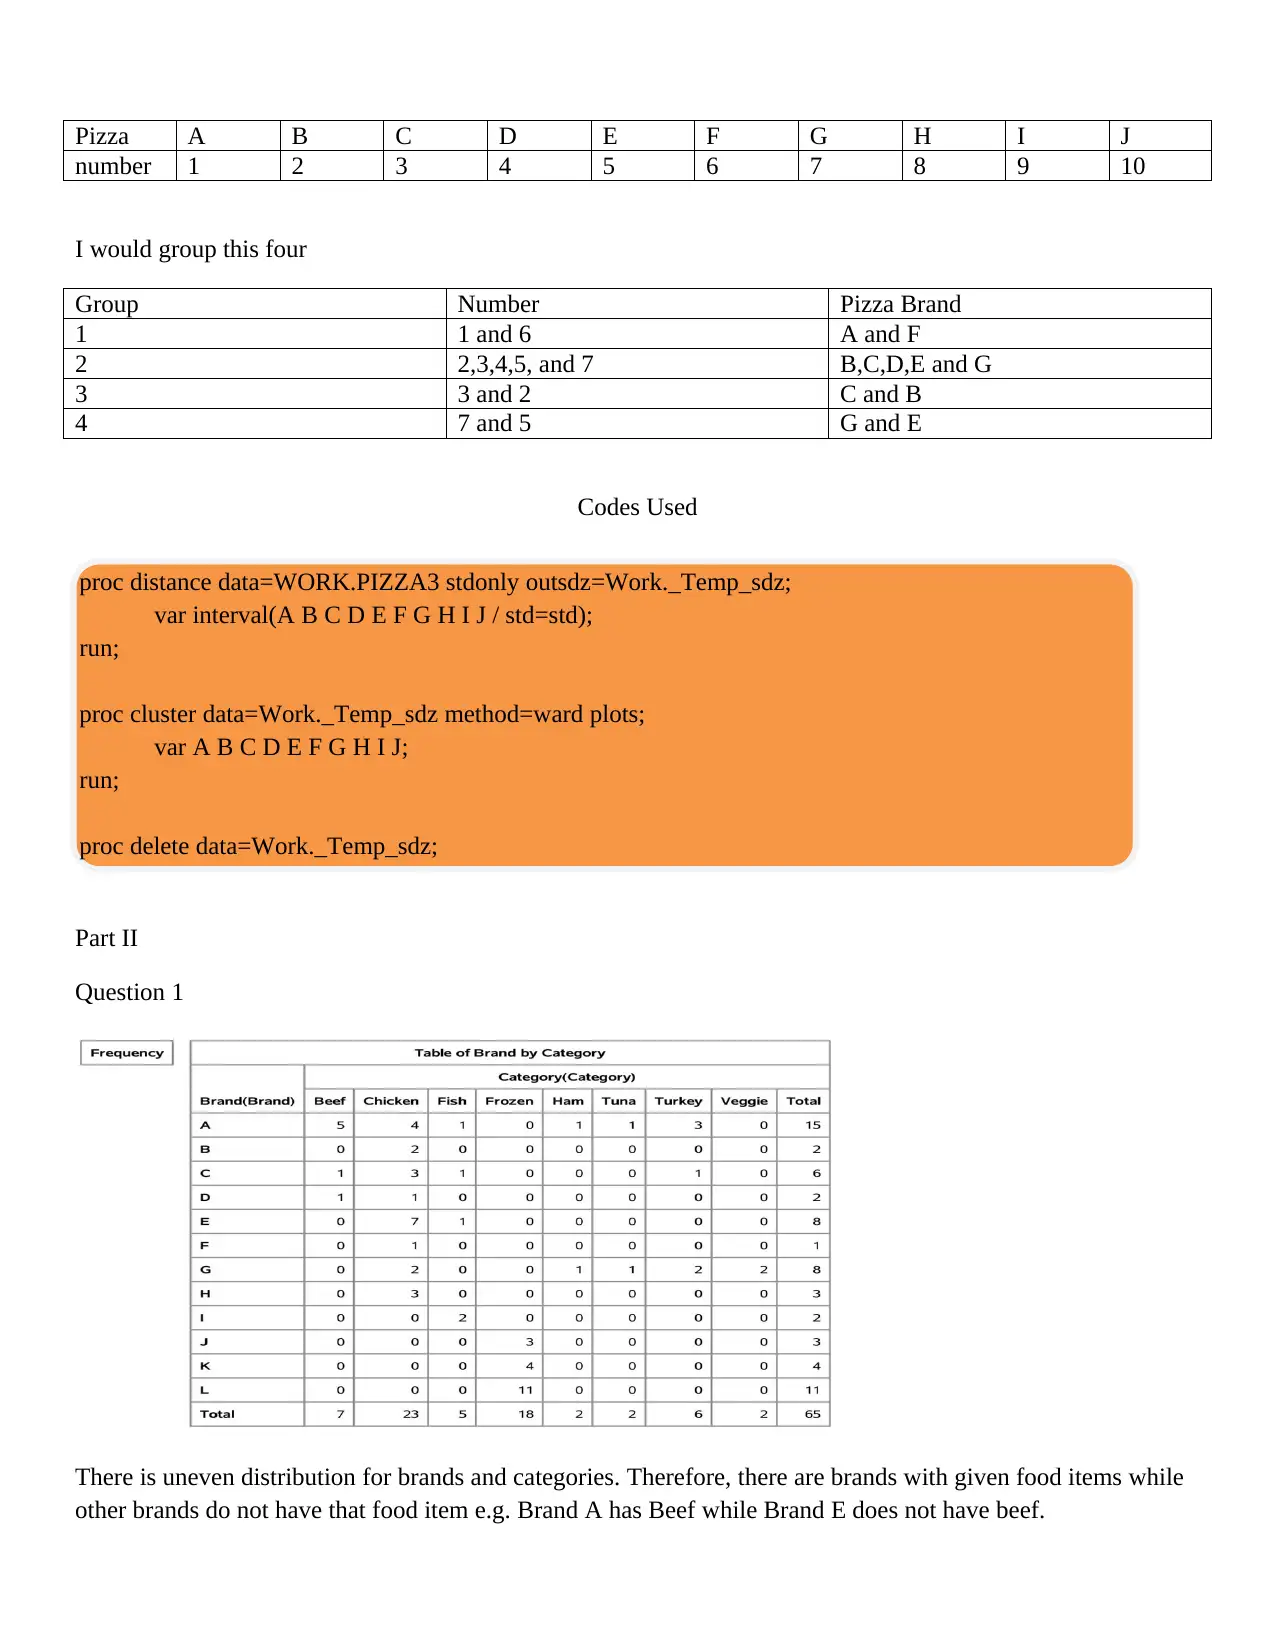
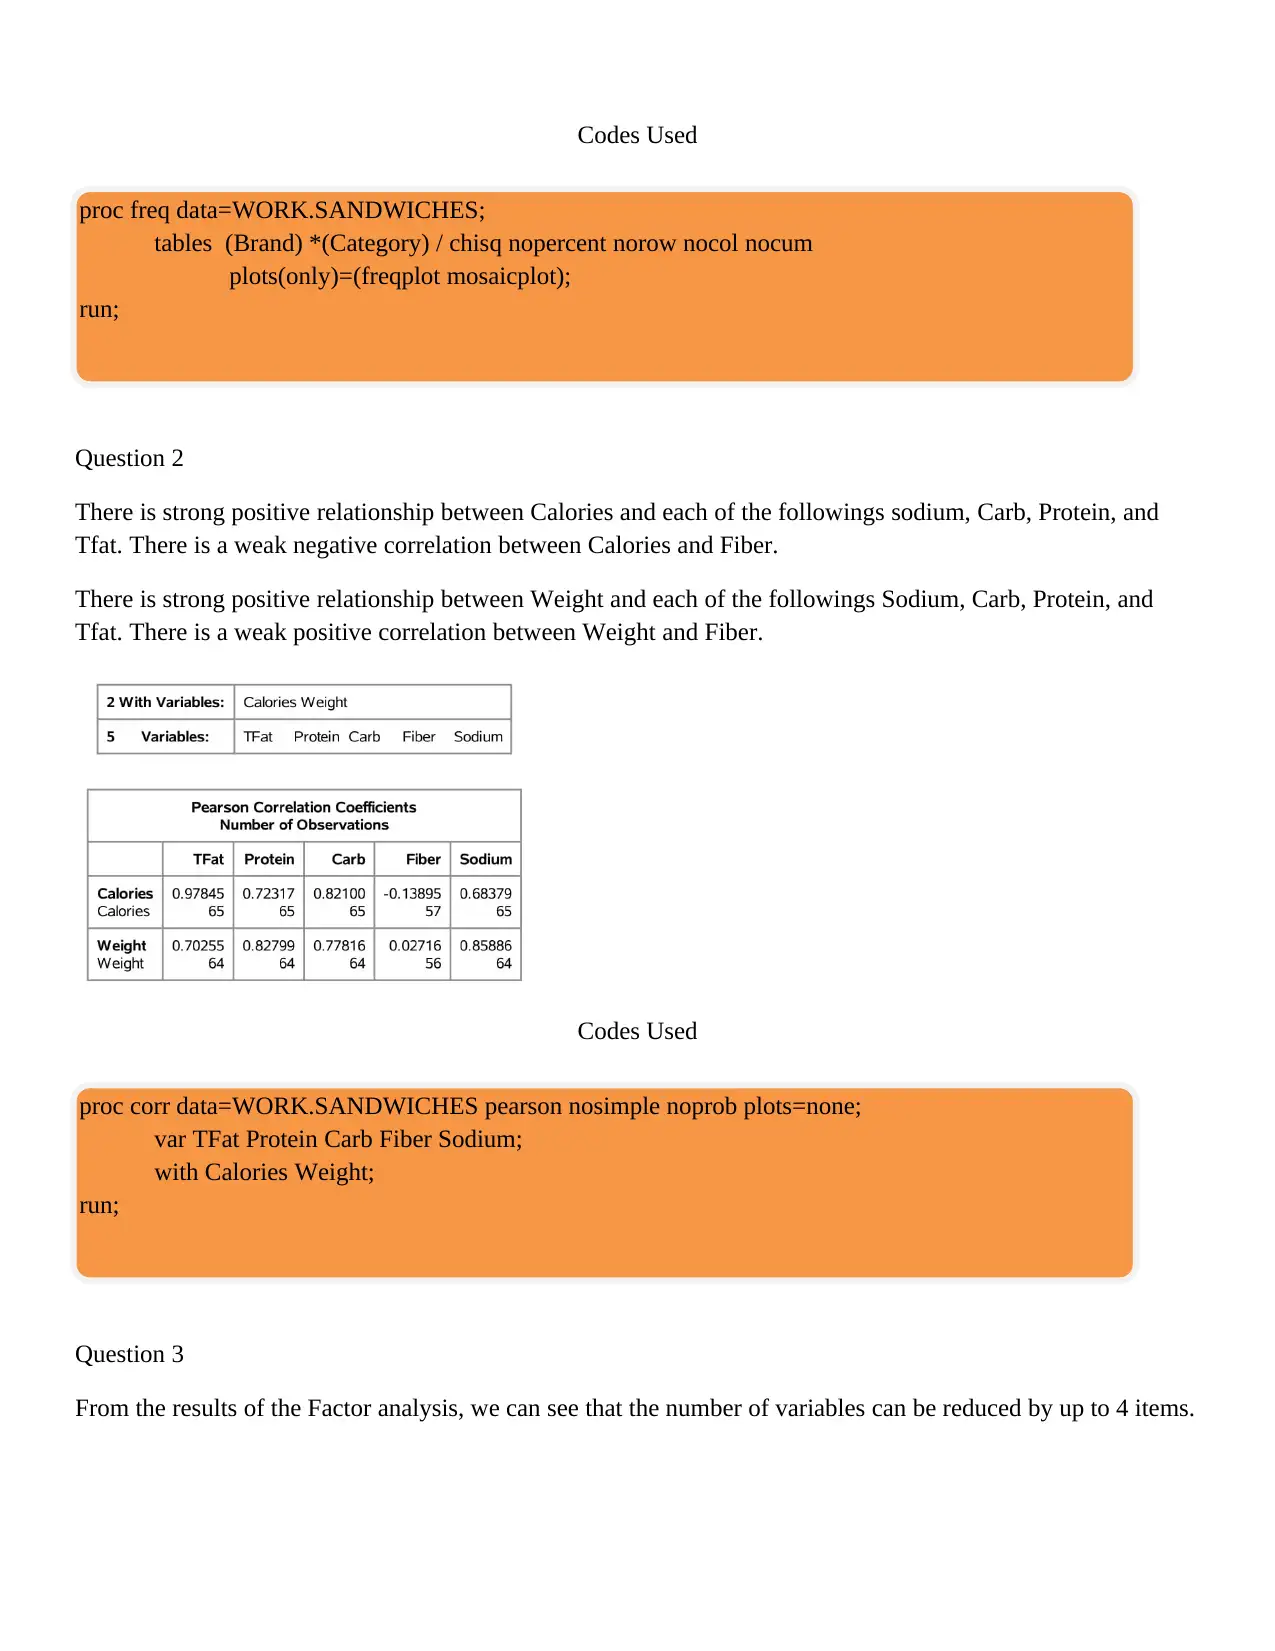
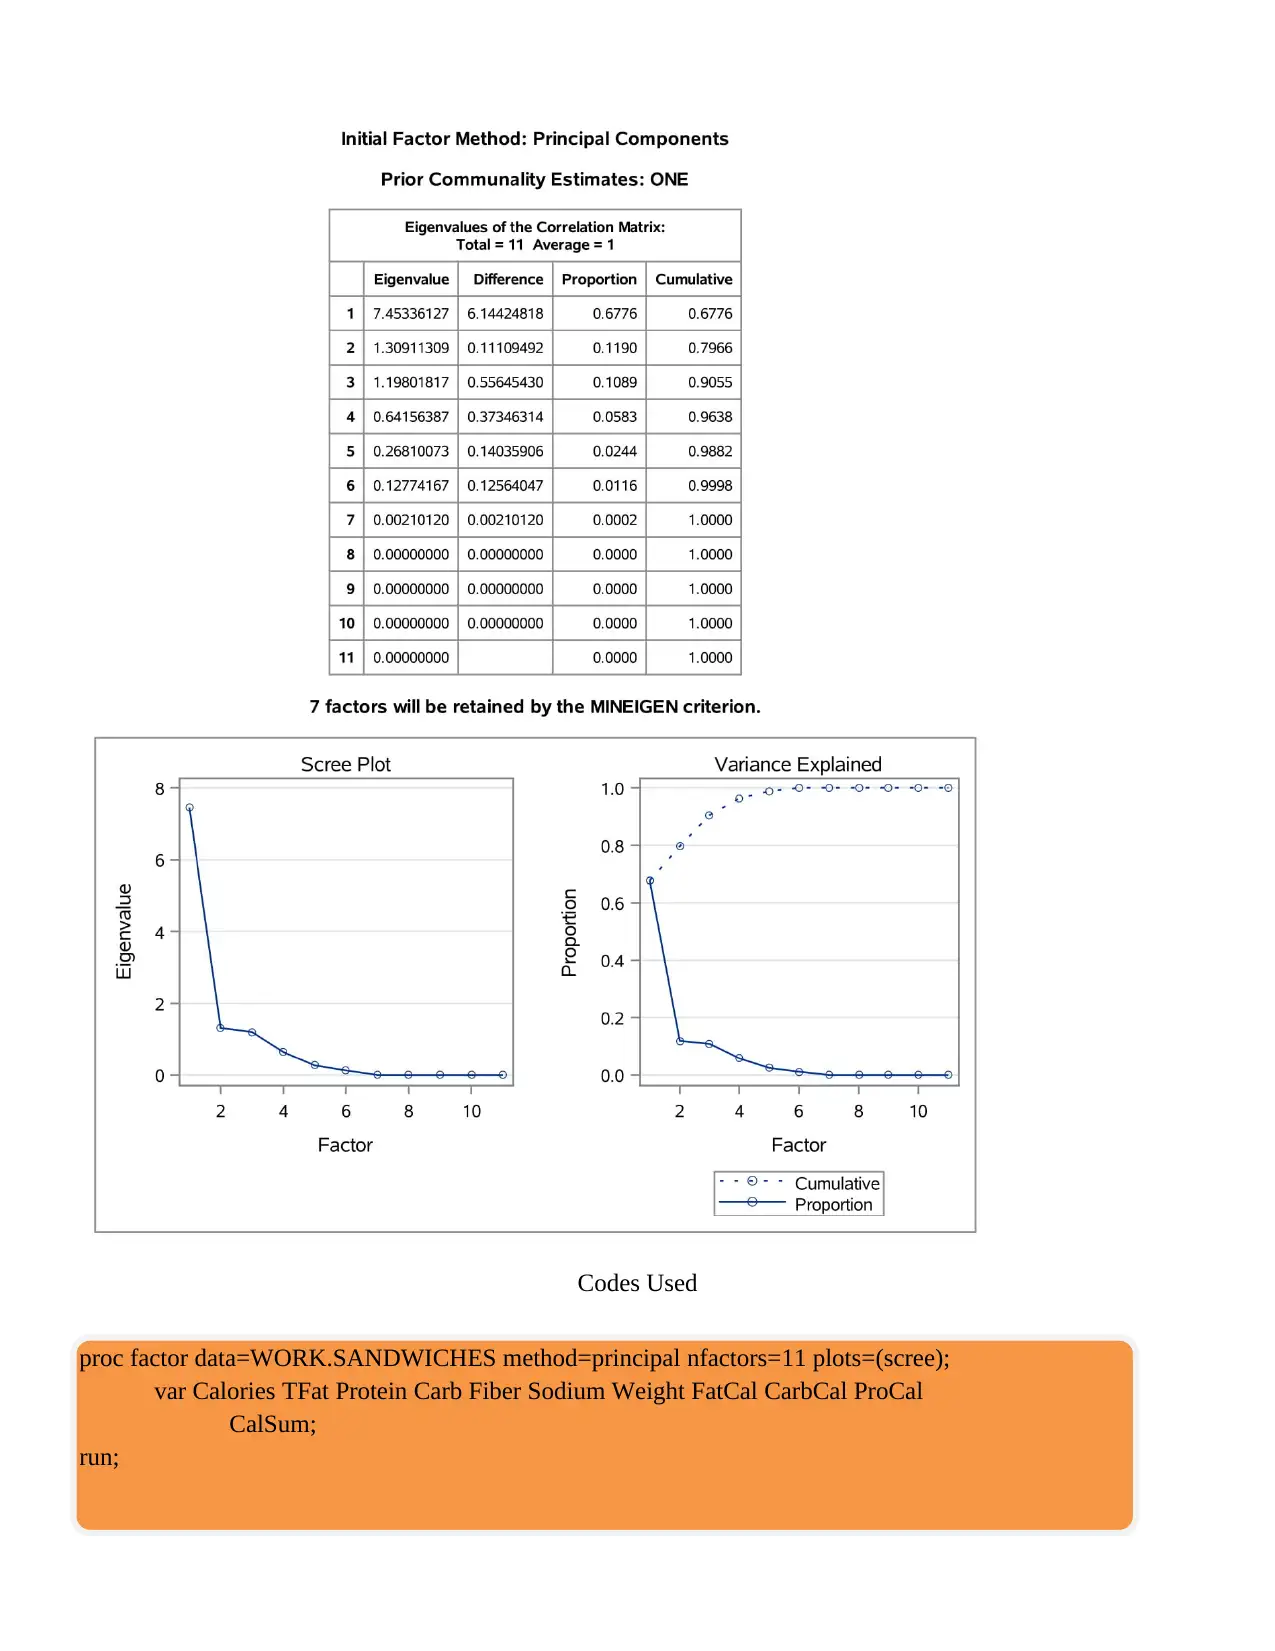
This assignment presents a comprehensive data analysis project focusing on two datasets: one related to pizza and the other to sandwiches. The analysis begins with a cluster analysis of the pizza data, utilizing Ward's minimum variance method to create a dendrogram and identify groupings. The solution also addresses the variance explained by the clusters and assigns pizzas to specific groups based on the dendrogram. The second part of the assignment delves into the sandwich dataset, examining the distribution of brands and categories. It then explores the relationships between nutritional variables such as calories, fat, protein, carbohydrates, fiber, and sodium, using correlation analysis. Finally, the solution employs factor analysis to reduce the number of variables, providing insights into the underlying structure of the sandwich data.
Document Page
Cluster Analysis
Part I
Question 1
Six Clusters were formed
Question 2
96.7% of the variance
Question 3
tabler-icon-diamond-filled.svg

Paraphrase This Document

Need a fresh take? Get an instant paraphrase of this document with our AI Paraphraser
Document Page
Pizza A B C D E F G H I J
number 1 2 3 4 5 6 7 8 9 10
I would group this four
Group Number Pizza Brand
1 1 and 6 A and F
2 2,3,4,5, and 7 B,C,D,E and G
3 3 and 2 C and B
4 7 and 5 G and E
Codes Used
Part II
Question 1
There is uneven distribution for brands and categories. Therefore, there are brands with given food items while
other brands do not have that food item e.g. Brand A has Beef while Brand E does not have beef.
proc distance data=WORK.PIZZA3 stdonly outsdz=Work._Temp_sdz;
var interval(A B C D E F G H I J / std=std);
run;
proc cluster data=Work._Temp_sdz method=ward plots;
var A B C D E F G H I J;
run;
proc delete data=Work._Temp_sdz;
run;
Document Page
Codes Used
Question 2
There is strong positive relationship between Calories and each of the followings sodium, Carb, Protein, and
Tfat. There is a weak negative correlation between Calories and Fiber.
There is strong positive relationship between Weight and each of the followings Sodium, Carb, Protein, and
Tfat. There is a weak positive correlation between Weight and Fiber.
Codes Used
Question 3
From the results of the Factor analysis, we can see that the number of variables can be reduced by up to 4 items.
proc freq data=WORK.SANDWICHES;
tables (Brand) *(Category) / chisq nopercent norow nocol nocum
plots(only)=(freqplot mosaicplot);
run;
proc corr data=WORK.SANDWICHES pearson nosimple noprob plots=none;
var TFat Protein Carb Fiber Sodium;
with Calories Weight;
run;
Document Page
Codes Used
proc factor data=WORK.SANDWICHES method=principal nfactors=11 plots=(scree);
var Calories TFat Protein Carb Fiber Sodium Weight FatCal CarbCal ProCal
CalSum;
run;
chevron_up_icon
1 out of 4
circle_padding
hide_on_mobile
zoom_out_icon
[object Object]