Report on Employee Engagement Analysis in Hospitality Industry
VerifiedAdded on 2019/12/18
|14
|329
|145
Report
AI Summary
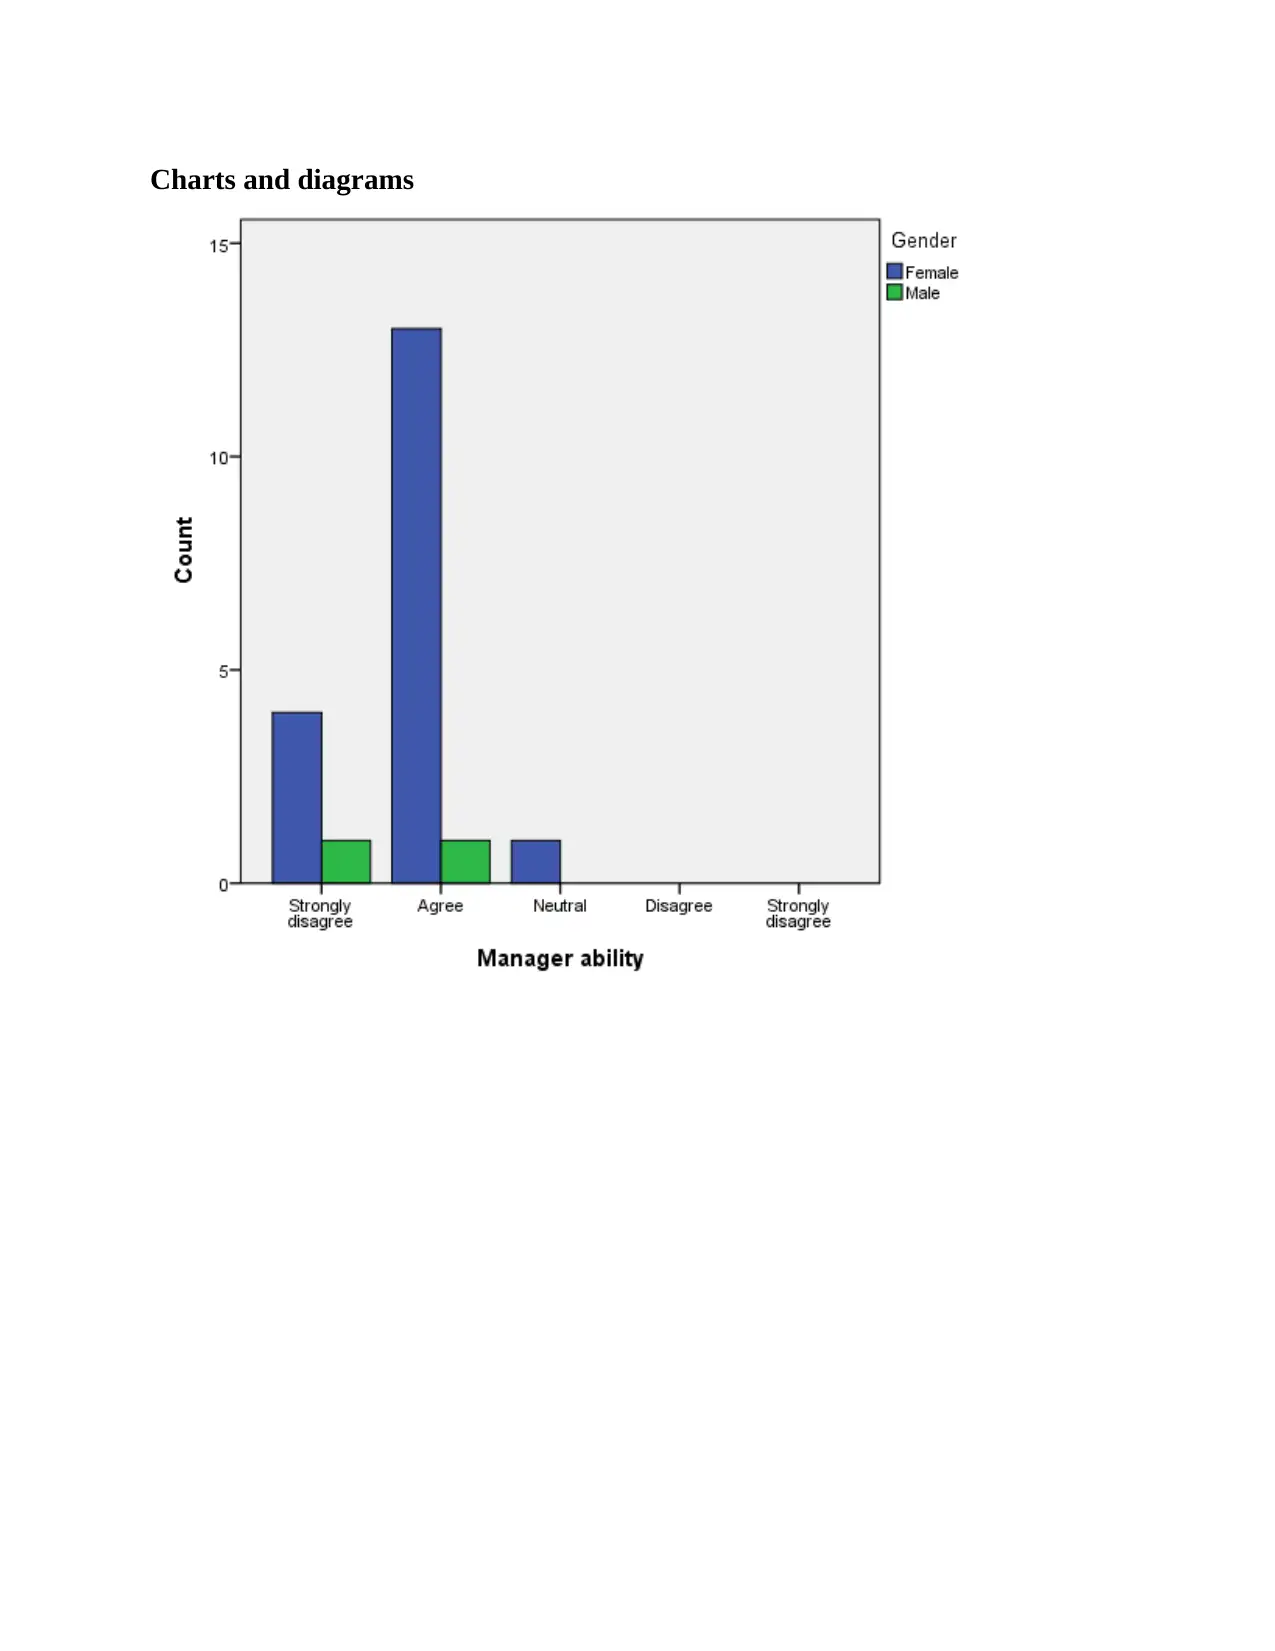
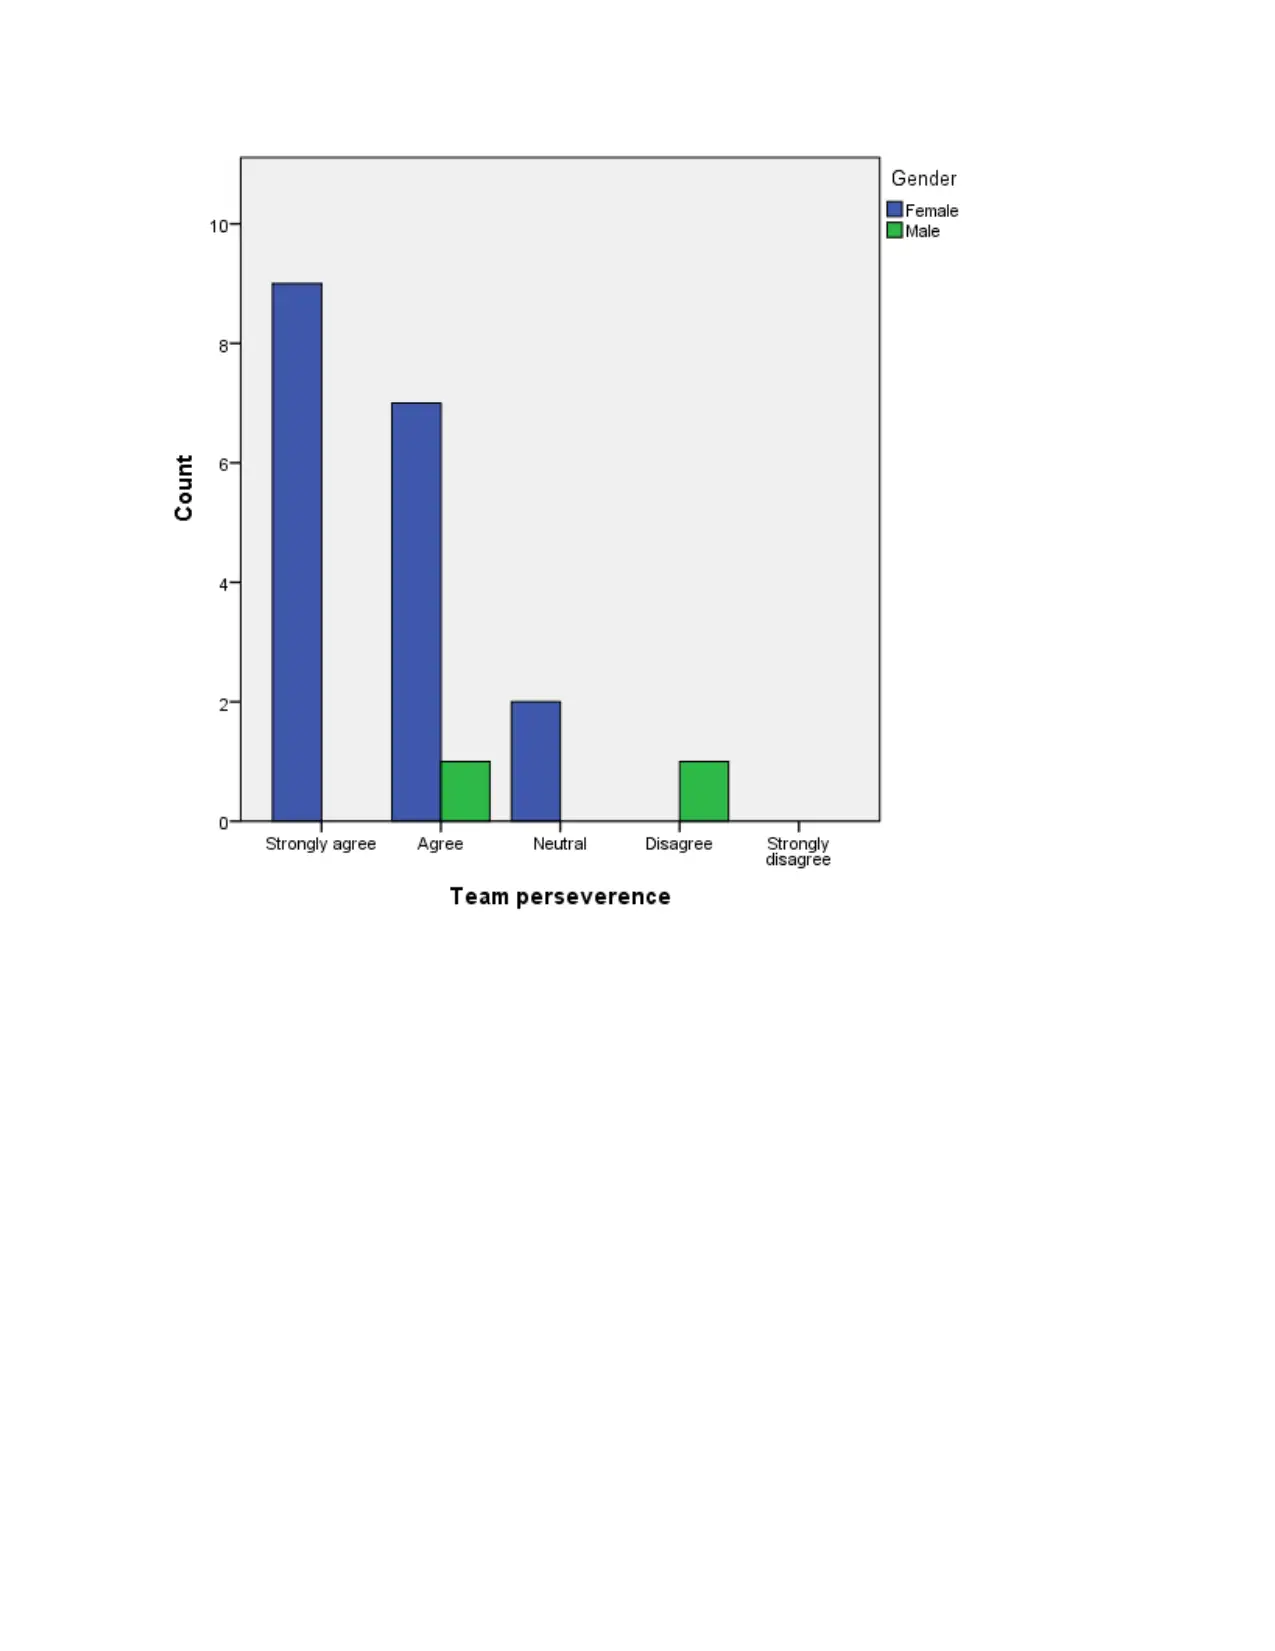
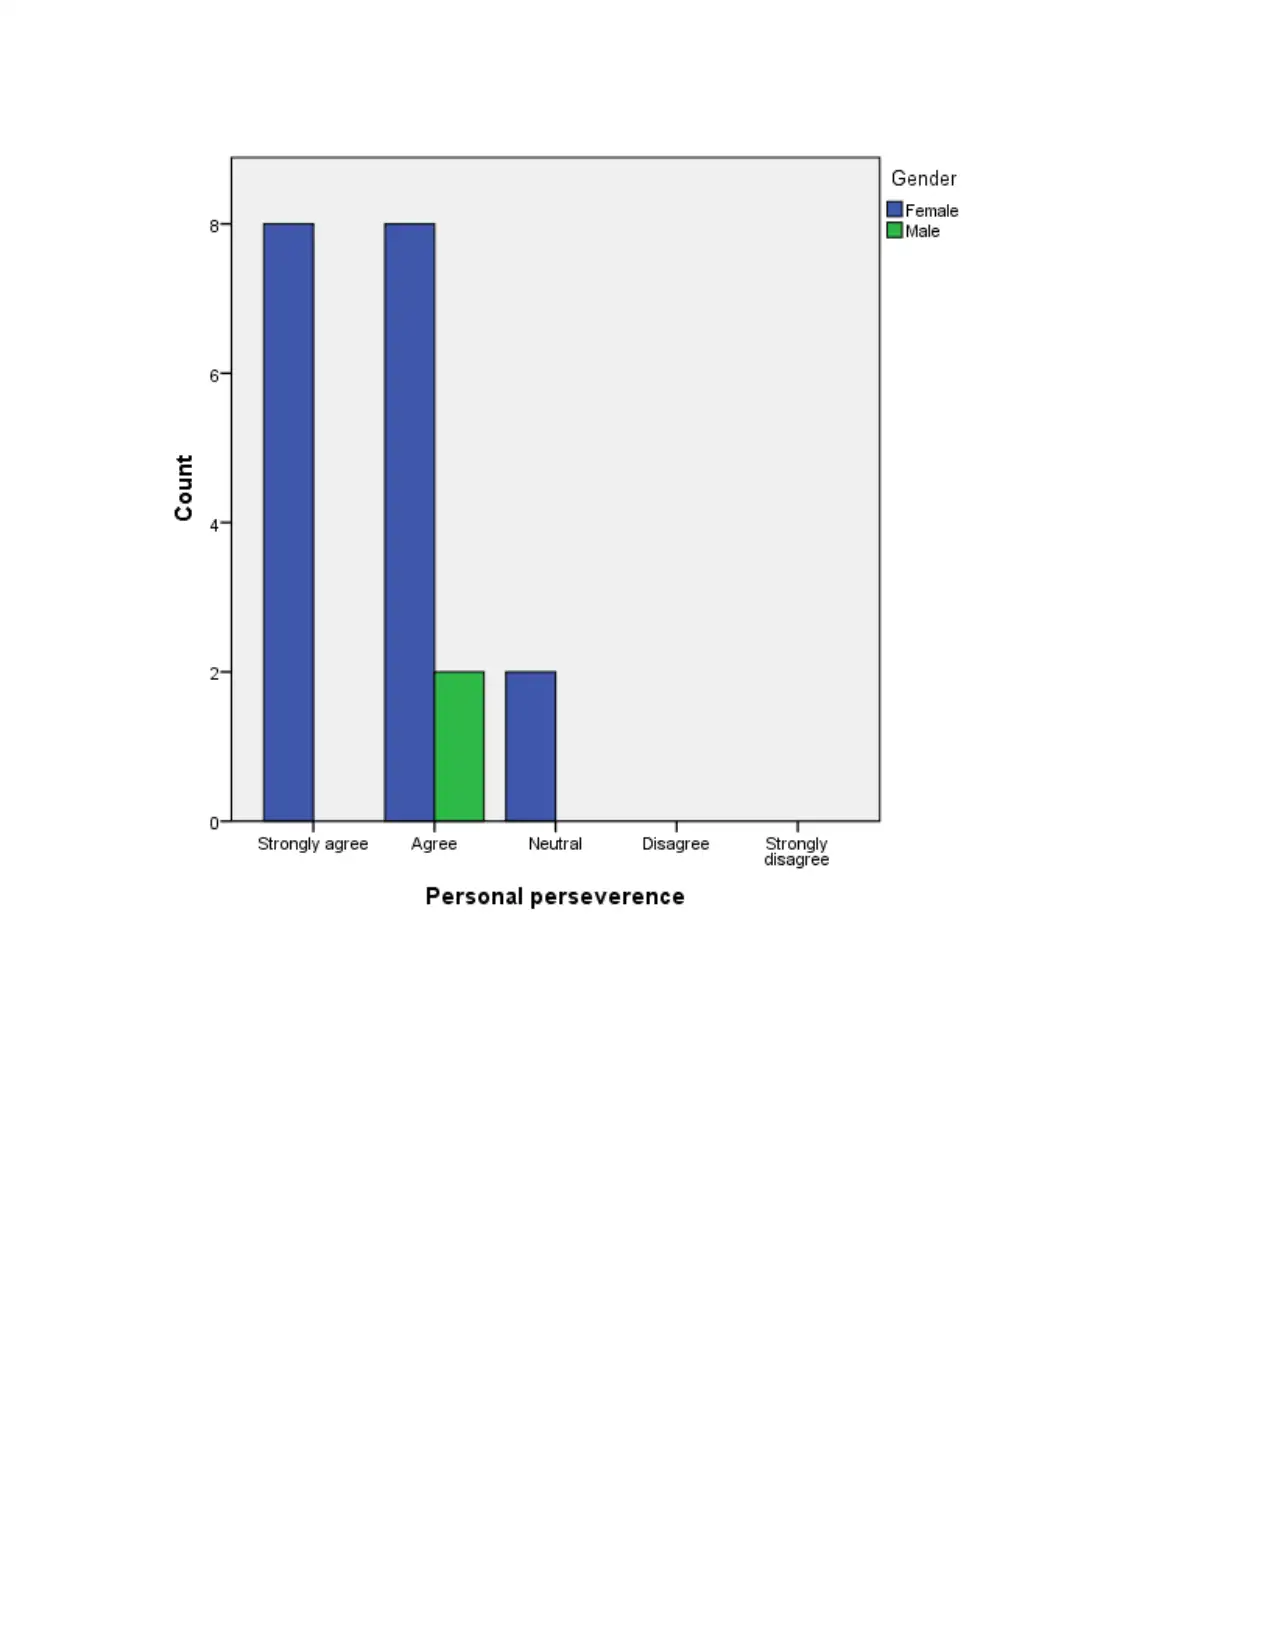
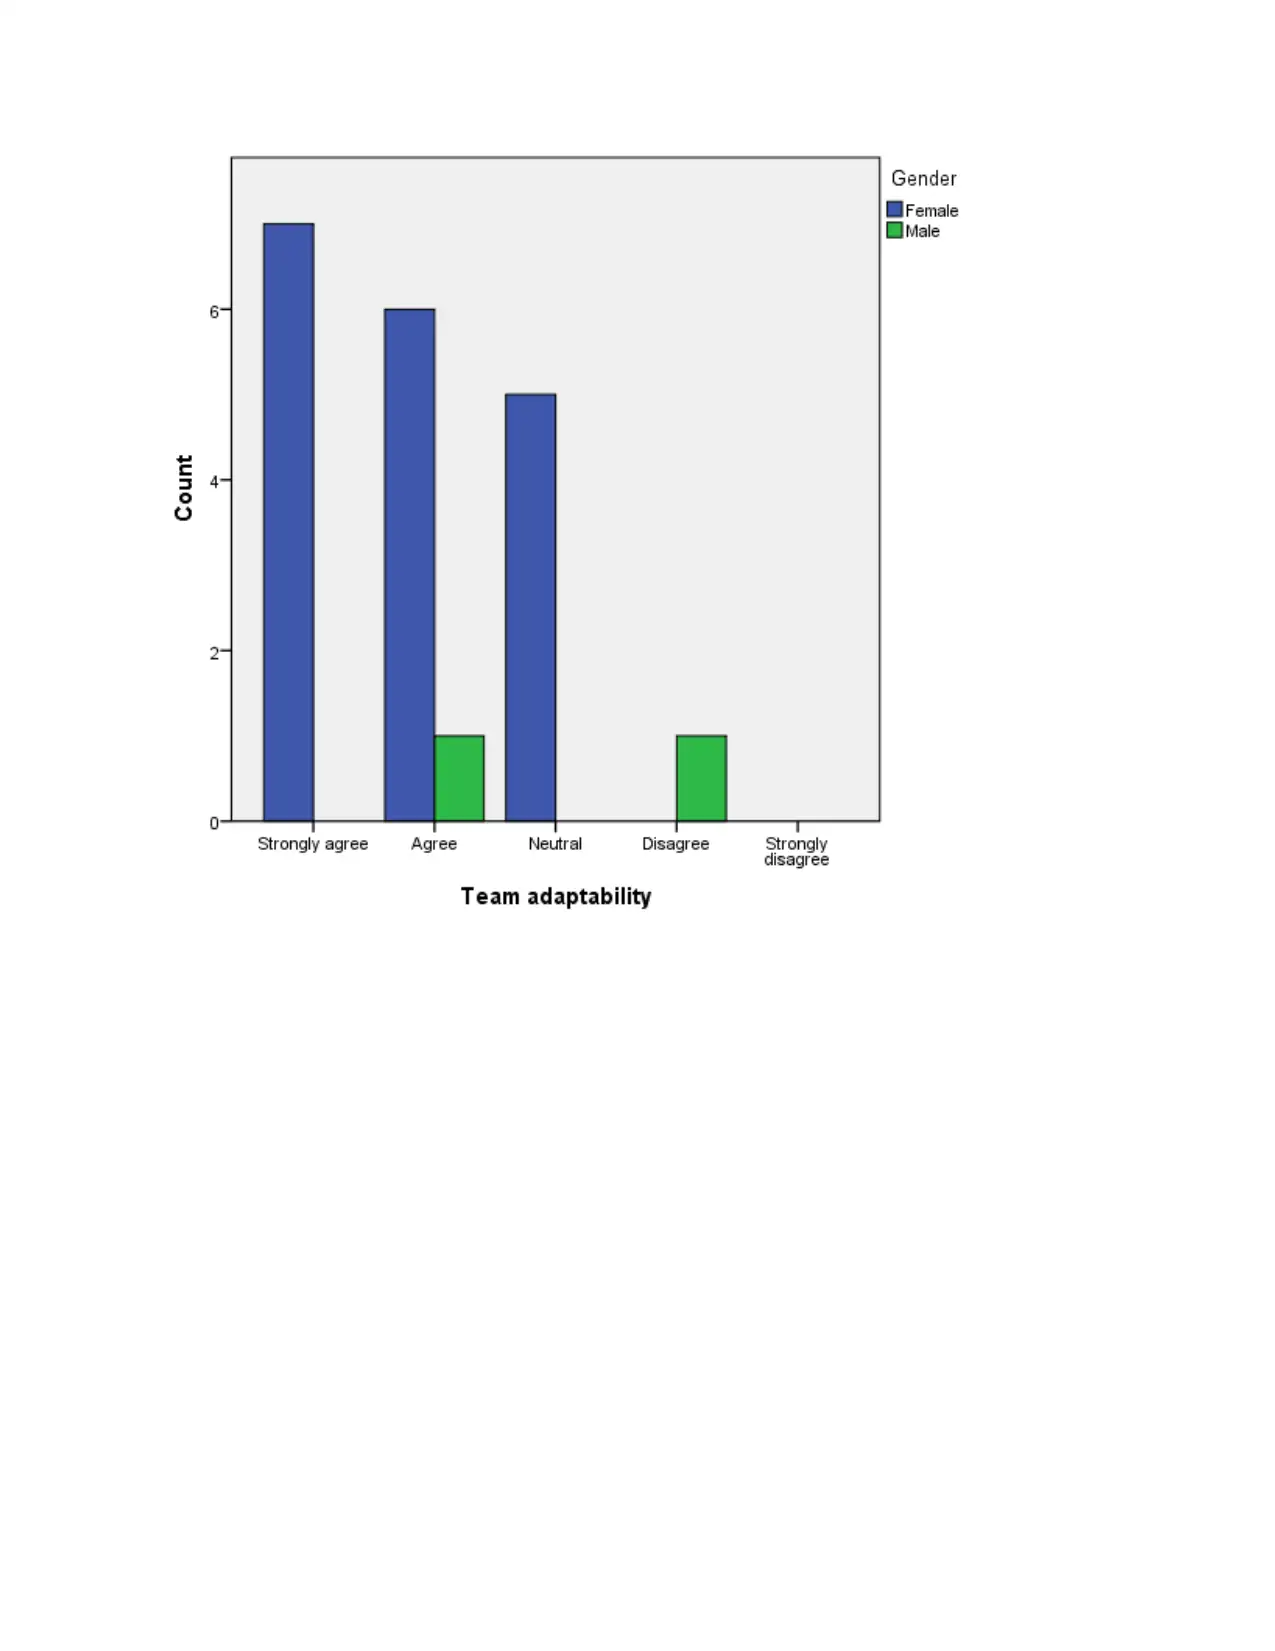
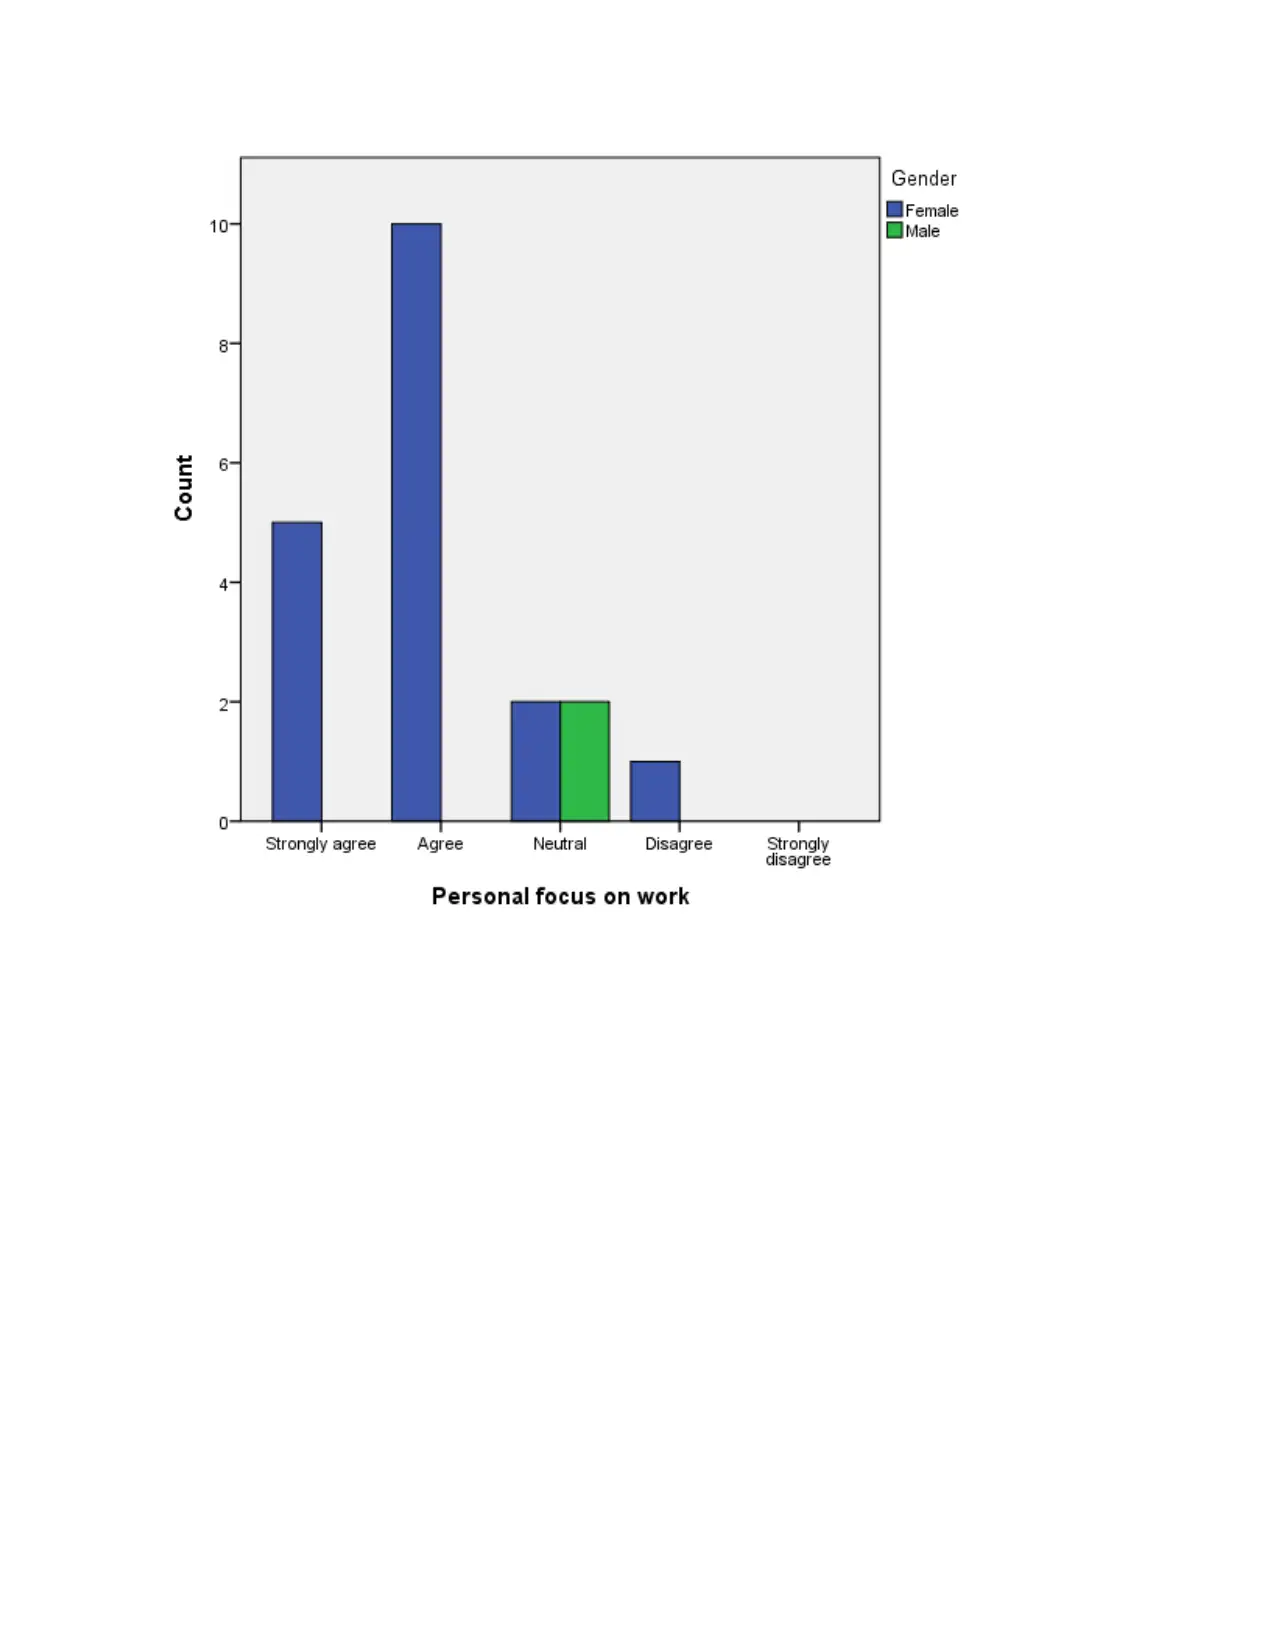
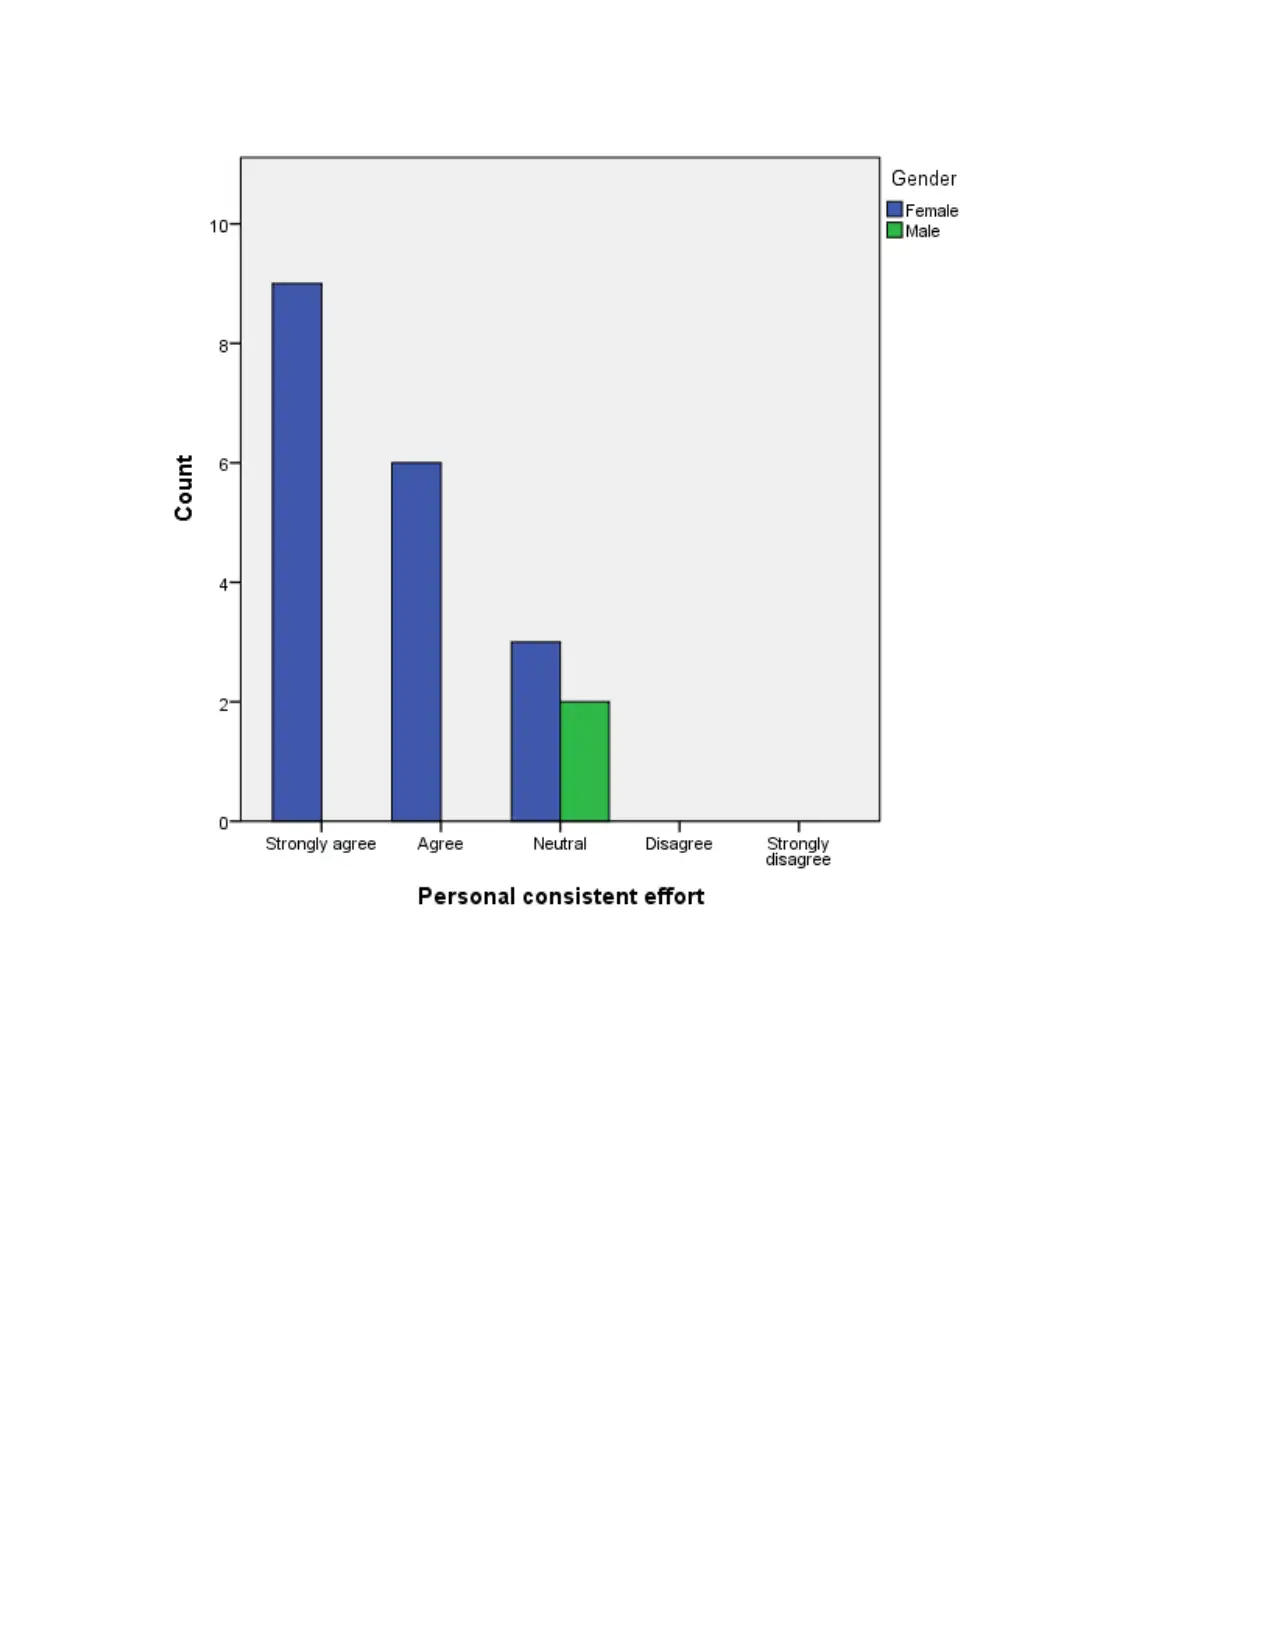
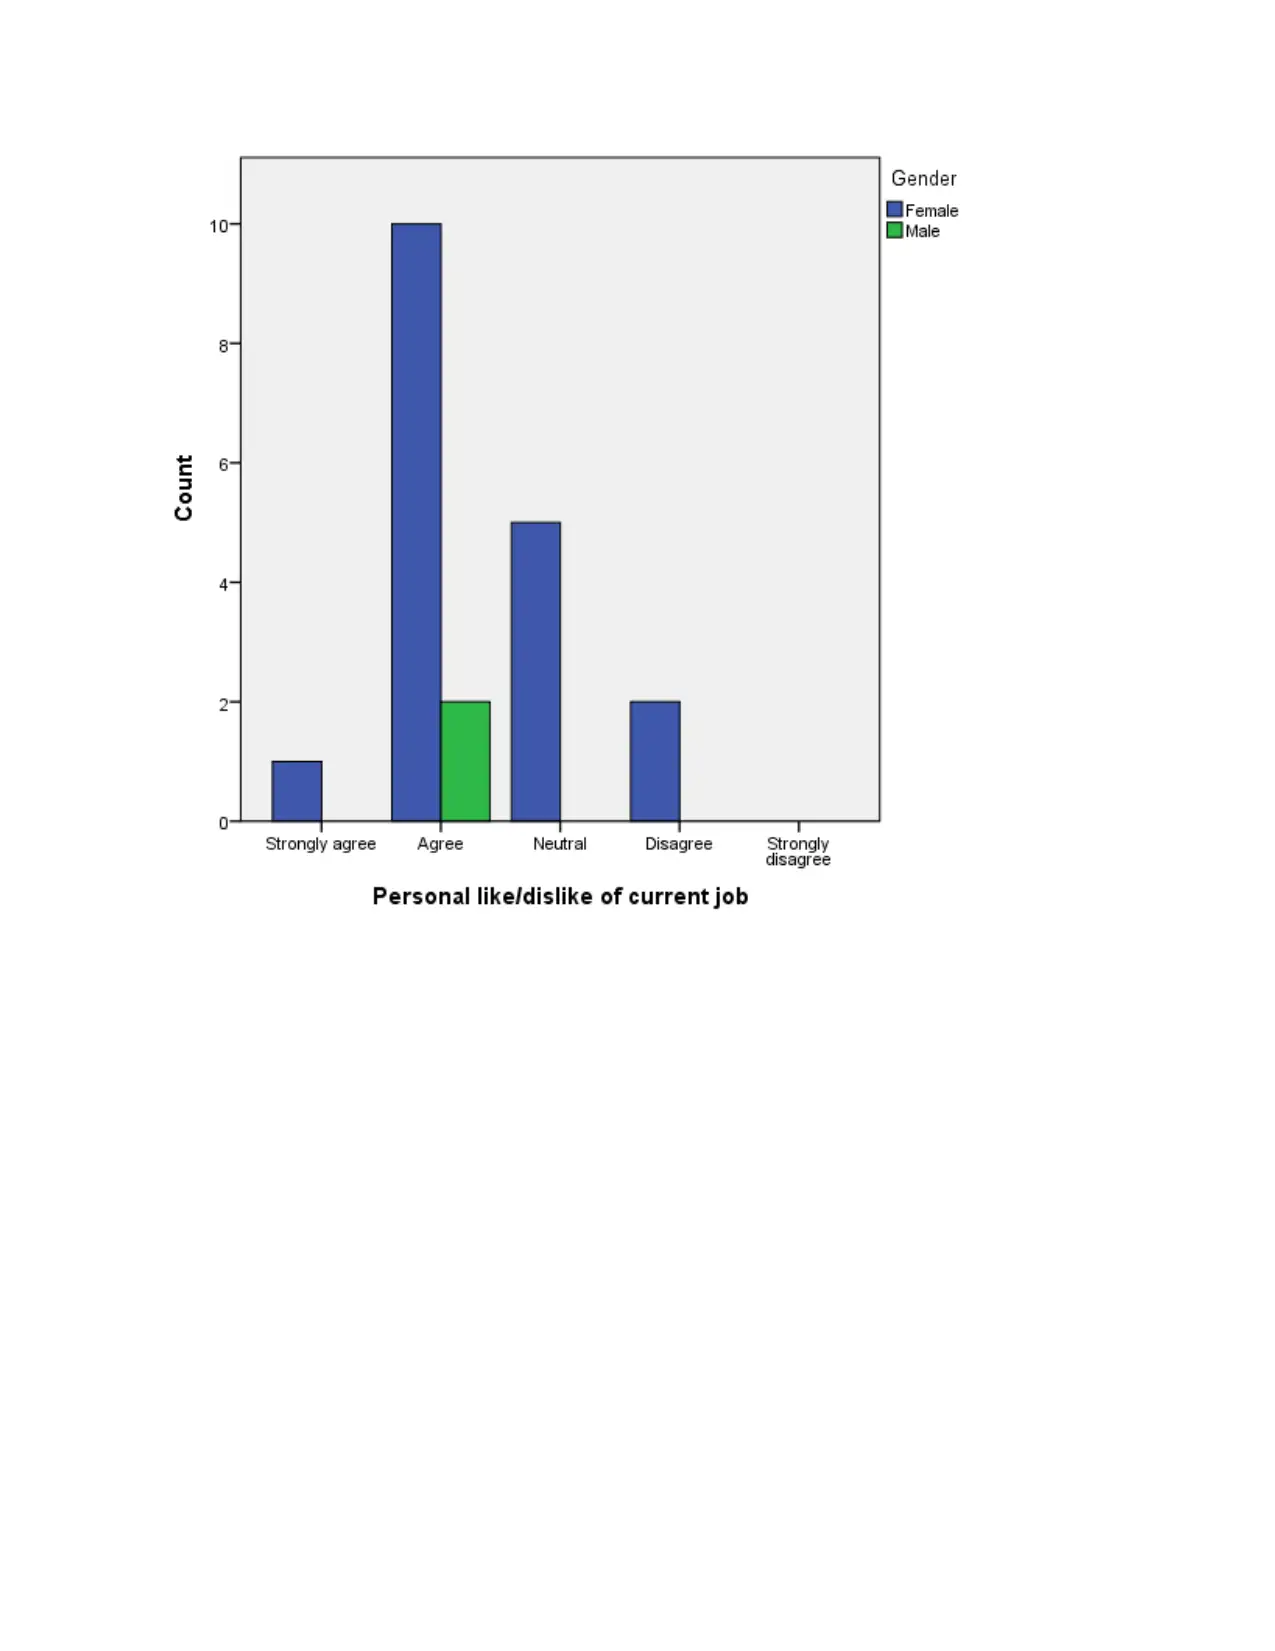
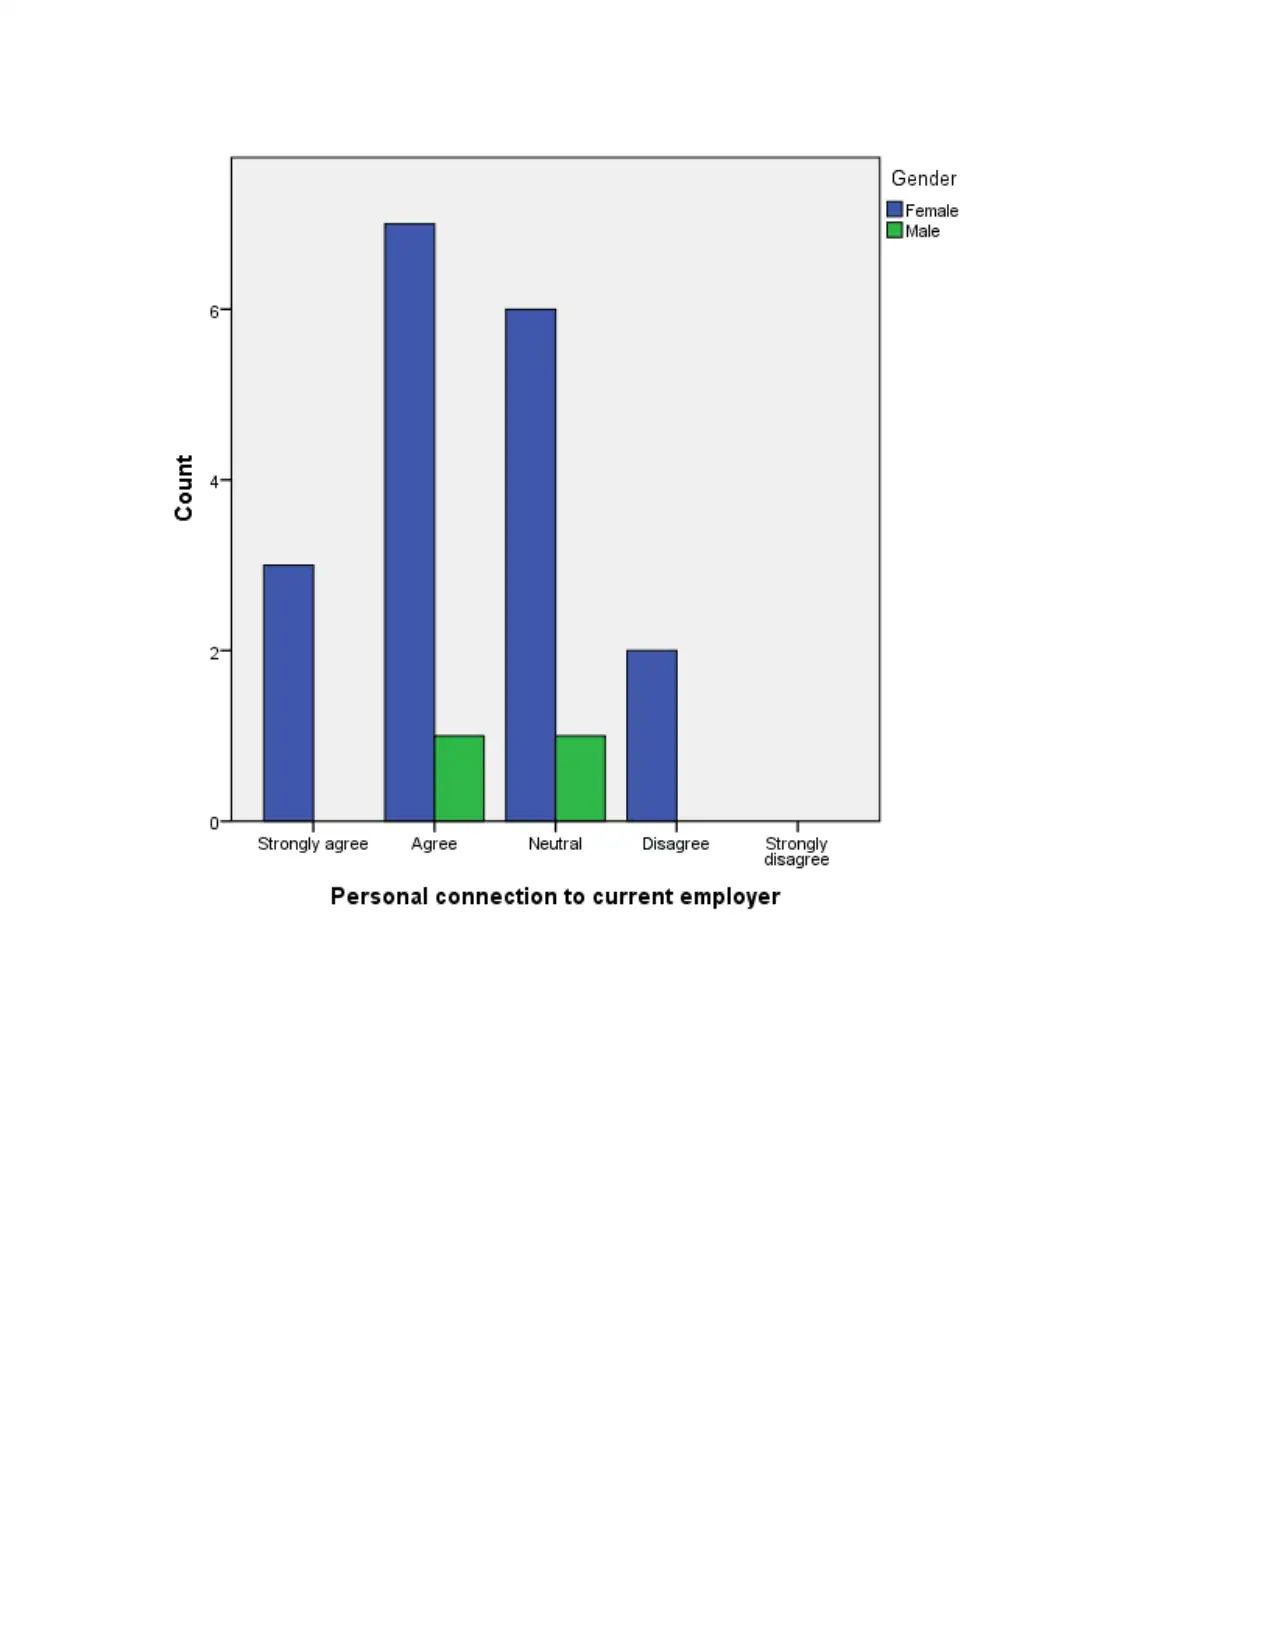
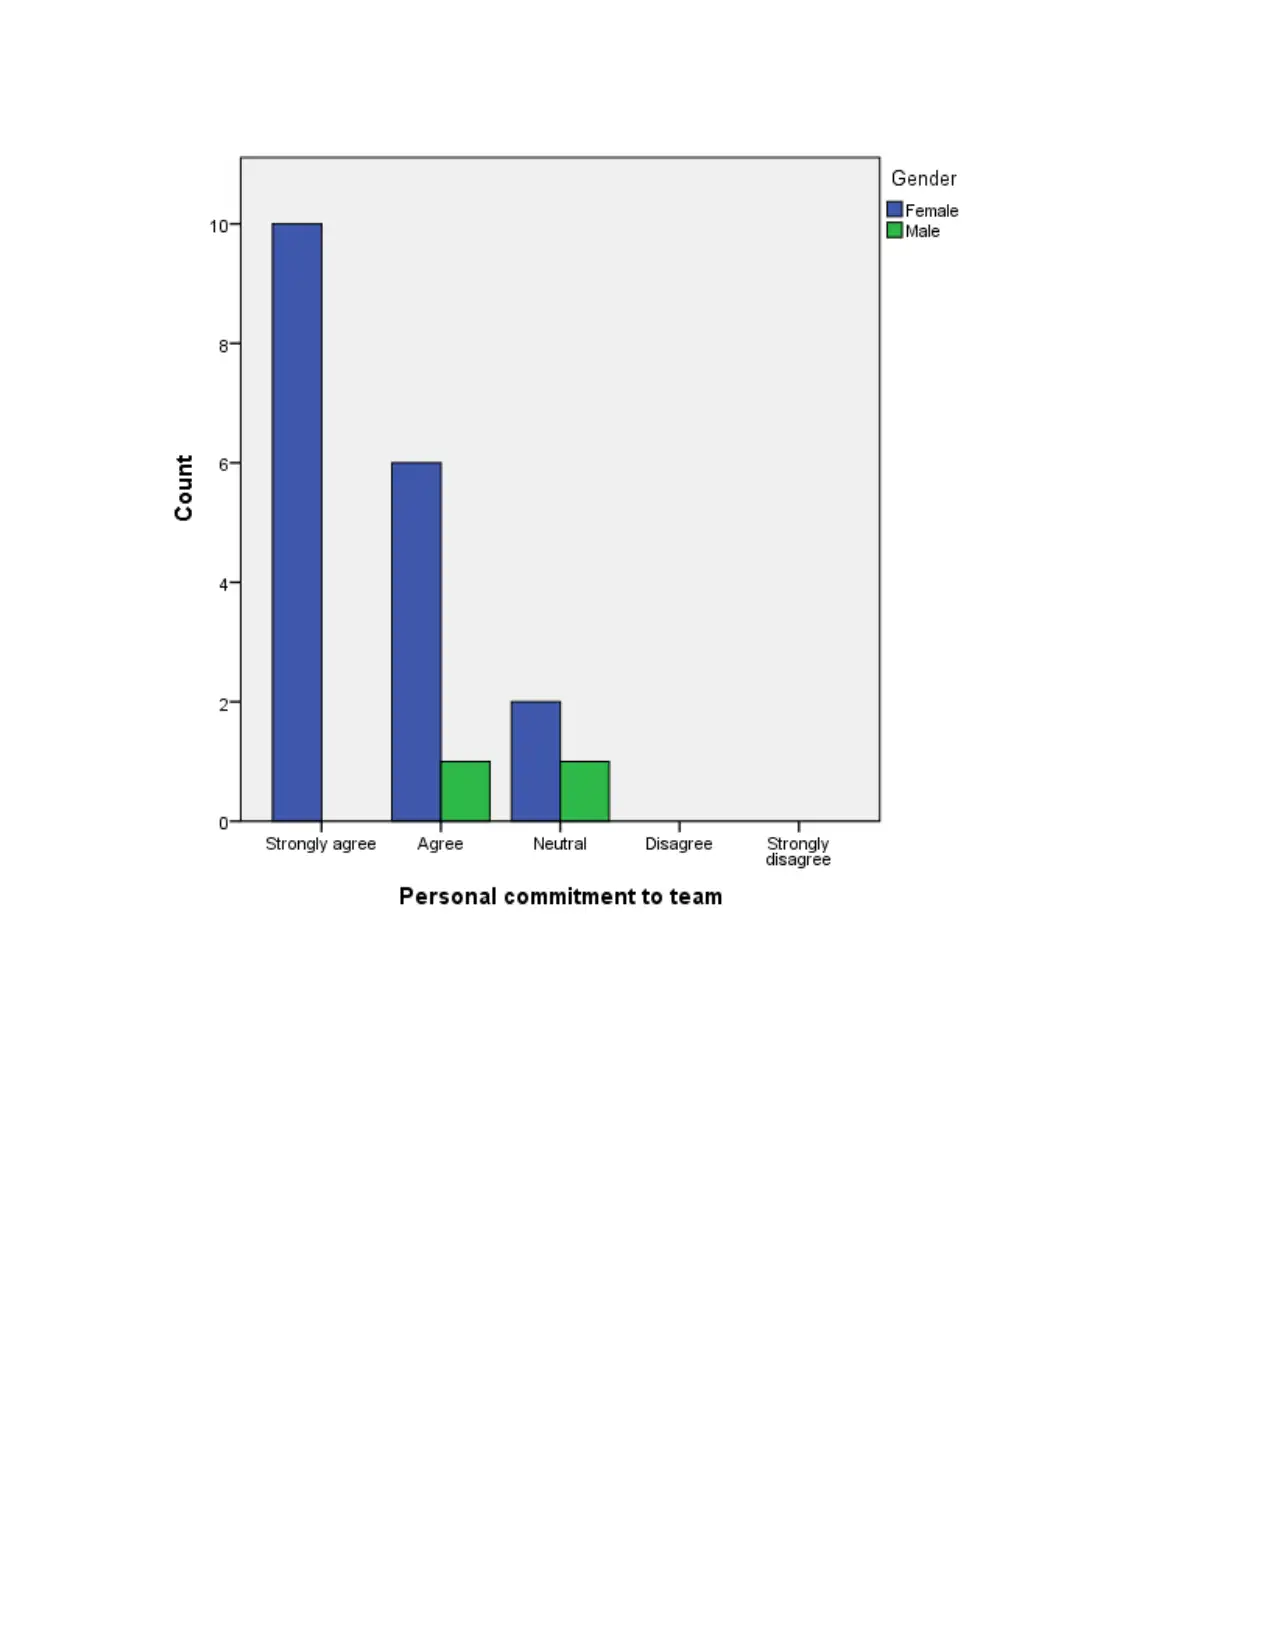
This report analyzes employee engagement in the hospitality industry using SPSS. The report includes charts and diagrams illustrating the relationship between various factors and employee engagement. Key findings indicate that factors such as team perseverance, adaptability, personal focus on work, and consistent efforts significantly impact employee engagement. The analysis provides insights into the importance of these factors for fostering a positive work environment within the hospitality sector. The report examines the impact of factors such as employee perseverance, team adaptability, and personal focus on work on employee engagement. The analysis indicates that the majority of respondents agree with the positive impact of these factors. The report provides valuable insights into the key drivers of employee engagement, helping to understand how to enhance it in the hospitality industry.

1 out of 14


Your All-in-One AI-Powered Toolkit for Academic Success.
+13062052269
info@desklib.com
Available 24*7 on WhatsApp / Email
![[object Object]](/_next/static/media/star-bottom.7253800d.svg)
Copyright © 2020–2026 A2Z Services. All Rights Reserved. Developed and managed by ZUCOL.