Capital Market Line, Security Market Line and Minimum Variance Portfolio in CAPM
VerifiedAdded on 2023/06/06
|9
|2600
|484
AI Summary
This article explains the difference between Capital Market Line (CML) and Security Market Line (SML) and the concept of Minimum Variance Portfolio in CAPM. It also highlights the importance of CAPM in determining the fair value of an investment.
Contribute Materials
Your contribution can guide someone’s learning journey. Share your
documents today.

qwertyuiopasdfghjklzxcvbnmqw
ertyuiopasdfghjklzxcvbnmqwert
yuiopasdfghjklzxcvbnmqwertyui
opasdfghjklzxcvbnmqwertyuiopa
sdfghjklzxcvbnmqwertyuiopasdf
ghjklzxcvbnmqwertyuiopasdfghj
klzxcvbnmqwertyuiopasdfghjklz
xcvbnmqwertyuiopasdfghjklzxcv
bnmqwertyuiopasdfghjklzxcvbn
mqwertyuiopasdfghjklzxcvbnmq
wertyuiopasdfghjklzxcvbnmqwer
tyuiopasdfghjklzxcvbnmqwertyui
opasdfghjklzxcvbnmqwertyuiopa
sdfghjklzxcvbnmqwertyuiopasdf
ghjklzxcvbnmqwertyuiopasdfghj
klzxcvbnmqwertyuiopasdfghjklz
xcvbnmrtyuiopasdfghjklzxcvbnm
qwertyuiopasdfghjklzxcvbnmqw
FIN200 Assignment, Trimester 2
2018________
Secure Best Marks with AI Grader
Need help grading? Try our AI Grader for instant feedback on your assignments.
CAPM
Security Market Line (SML) is different from Capital Market Line (CML).
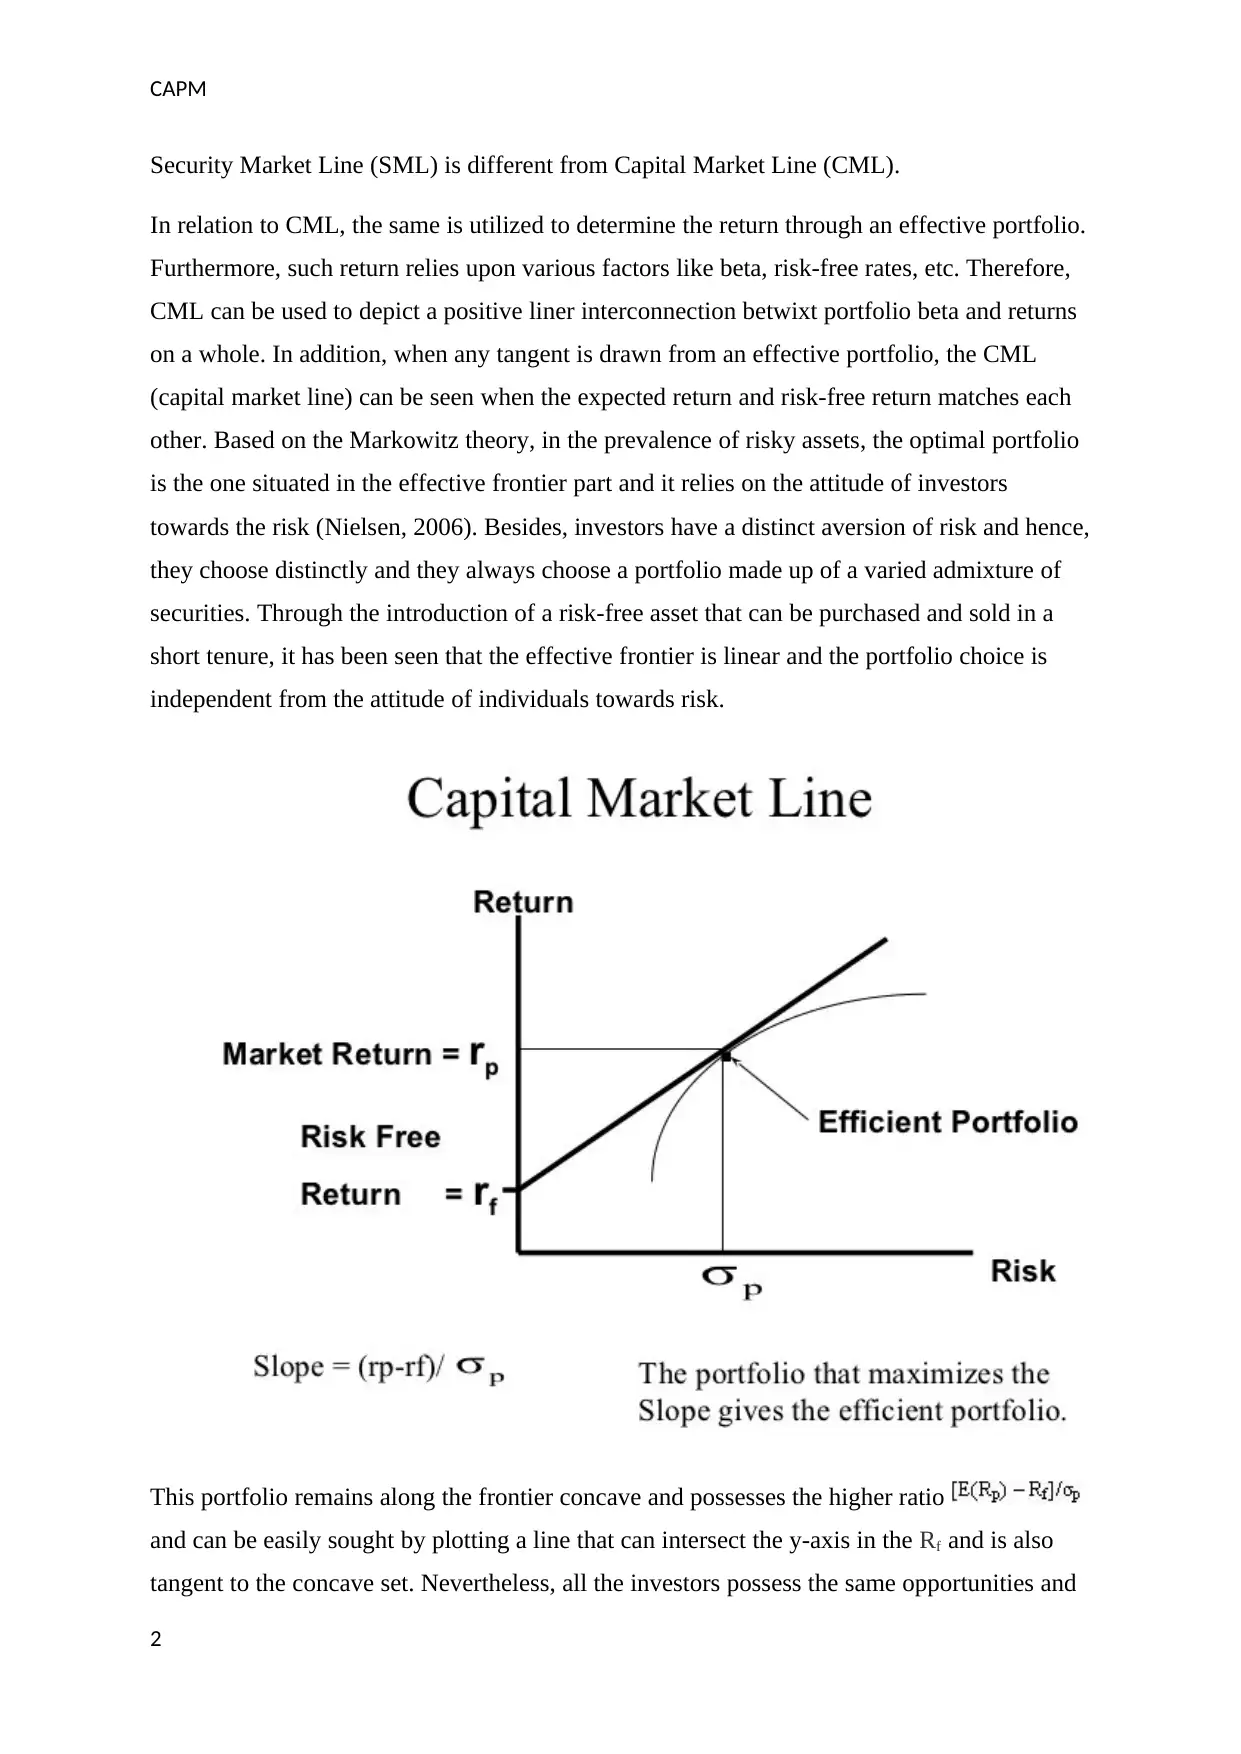
In relation to CML, the same is utilized to determine the return through an effective portfolio.
Furthermore, such return relies upon various factors like beta, risk-free rates, etc. Therefore,
CML can be used to depict a positive liner interconnection betwixt portfolio beta and returns
on a whole. In addition, when any tangent is drawn from an effective portfolio, the CML
(capital market line) can be seen when the expected return and risk-free return matches each
other. Based on the Markowitz theory, in the prevalence of risky assets, the optimal portfolio
is the one situated in the effective frontier part and it relies on the attitude of investors
towards the risk (Nielsen, 2006). Besides, investors have a distinct aversion of risk and hence,
they choose distinctly and they always choose a portfolio made up of a varied admixture of
securities. Through the introduction of a risk-free asset that can be purchased and sold in a
short tenure, it has been seen that the effective frontier is linear and the portfolio choice is
independent from the attitude of individuals towards risk.
This portfolio remains along the frontier concave and possesses the higher ratio
and can be easily sought by plotting a line that can intersect the y-axis in the Rf and is also
tangent to the concave set. Nevertheless, all the investors possess the same opportunities and
2
Security Market Line (SML) is different from Capital Market Line (CML).
In relation to CML, the same is utilized to determine the return through an effective portfolio.
Furthermore, such return relies upon various factors like beta, risk-free rates, etc. Therefore,
CML can be used to depict a positive liner interconnection betwixt portfolio beta and returns
on a whole. In addition, when any tangent is drawn from an effective portfolio, the CML
(capital market line) can be seen when the expected return and risk-free return matches each
other. Based on the Markowitz theory, in the prevalence of risky assets, the optimal portfolio
is the one situated in the effective frontier part and it relies on the attitude of investors
towards the risk (Nielsen, 2006). Besides, investors have a distinct aversion of risk and hence,
they choose distinctly and they always choose a portfolio made up of a varied admixture of
securities. Through the introduction of a risk-free asset that can be purchased and sold in a
short tenure, it has been seen that the effective frontier is linear and the portfolio choice is
independent from the attitude of individuals towards risk.
This portfolio remains along the frontier concave and possesses the higher ratio
and can be easily sought by plotting a line that can intersect the y-axis in the Rf and is also
tangent to the concave set. Nevertheless, all the investors possess the same opportunities and
2
CAPM
the same portfolio of tangent. Therefore, the CML attains from an effective part of the
minimum variance frontier that is interrelated to the feasibility to purchase or sell any risk-
free asset. Capital market line (CML) is therefore considered as the graph of the needed risk
and return of a risk-free asset’s portfolio and a bunch of other risky assets that can provide
the best trade-off of risk-return. Nevertheless, it is an important situation of allocation of
capital line that is tangent to the efficient frontier and its slope depicts the Sharpe Ratio. In
relation to this, the CML plays a key role in accounting for the risk-free assets and therefore,
it remains in the lead when it comes to effective frontier (Banbura et. al, 2015). Moreover, all
the other portfolios accommodate the exact Sharpe ratio as that in relation to the market
portfolio. Besides, while purchasing or making heavy investments in any portfolio or assets,
one relevant factor that must be taken into due consideration is that the Sharpe ratio must be
verified and the capital market line ratio of such portfolio or asset must be verified as well
(Nielsen, 2014). Further, if an asset’s Sharpe ratio remains above the ratio of CML, then the
purchase mode must happen and if it remains lesser than the CML ratio, then it must be sold
(CAPM, 2017).
Security market line (SML)
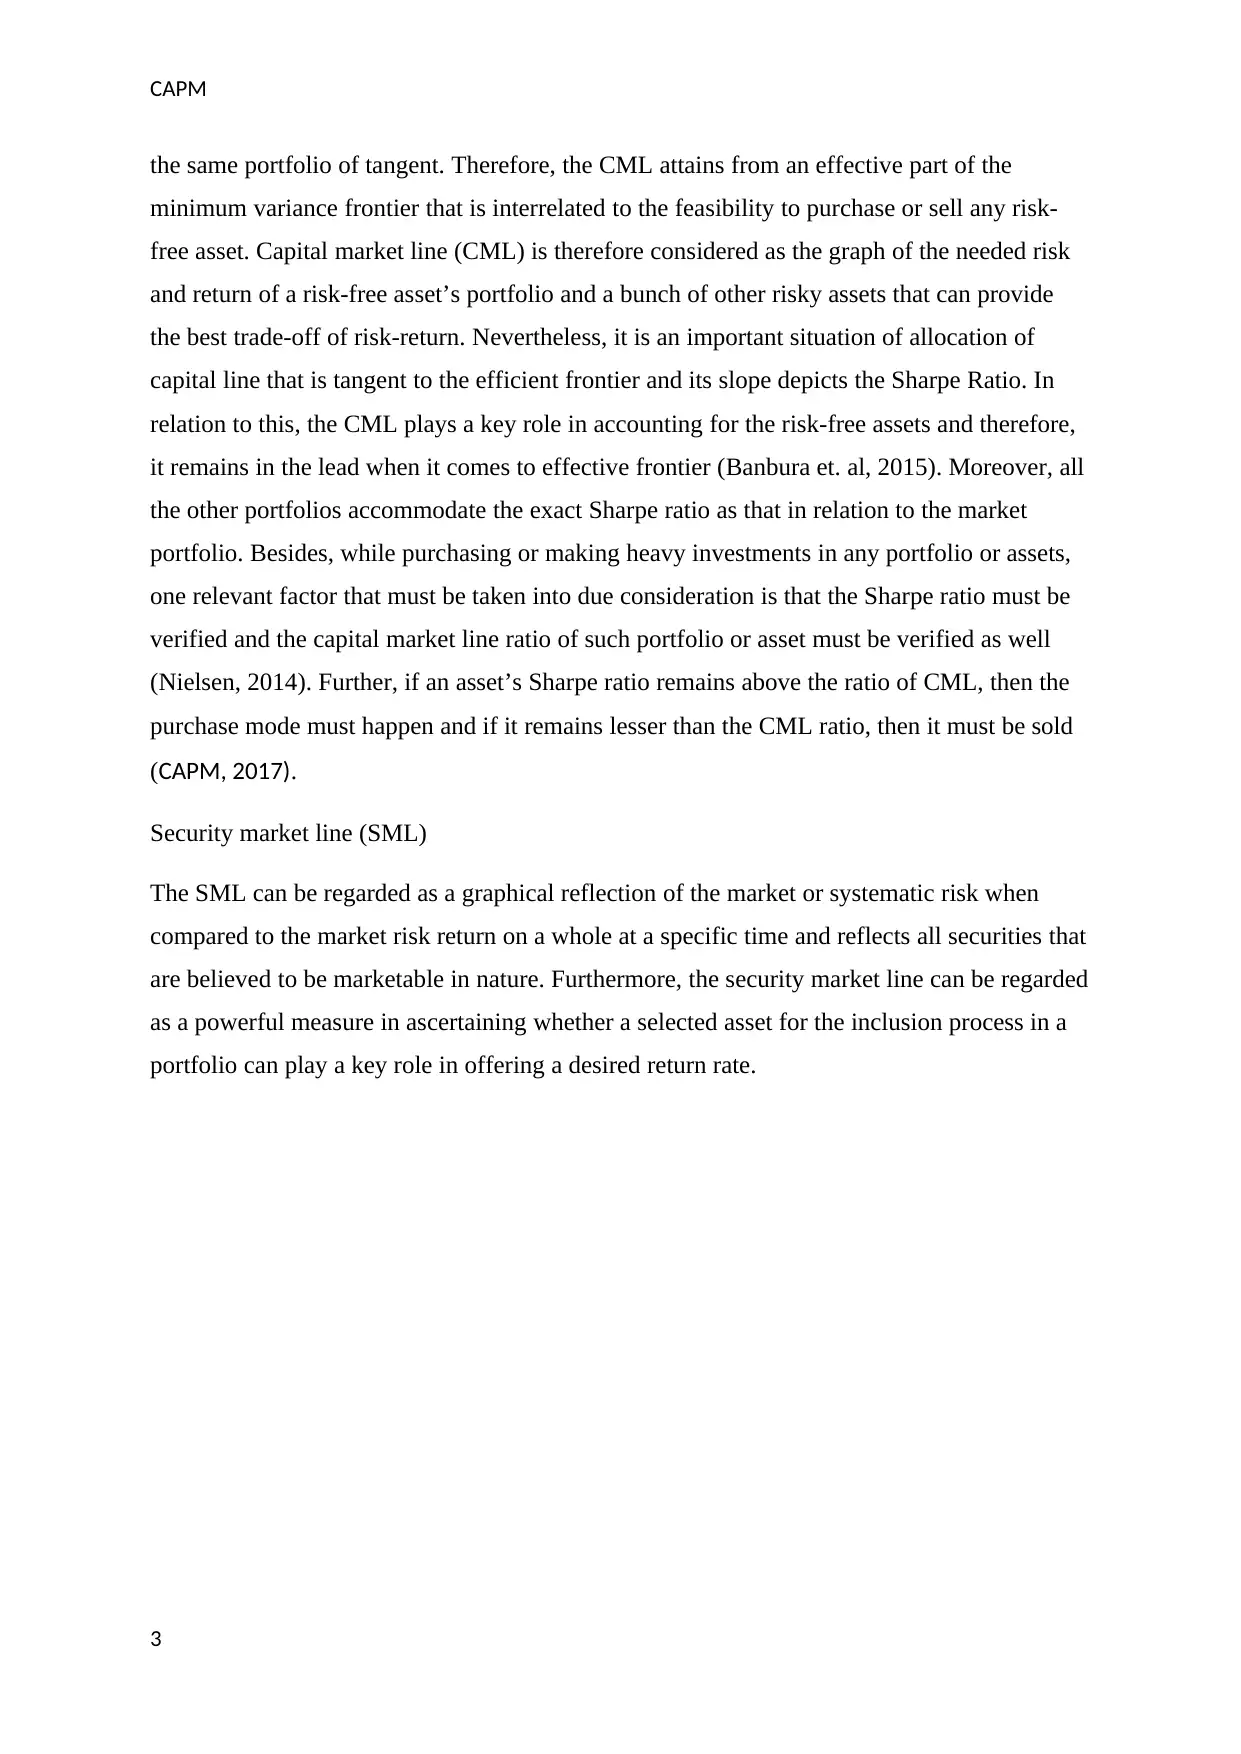
The SML can be regarded as a graphical reflection of the market or systematic risk when
compared to the market risk return on a whole at a specific time and reflects all securities that
are believed to be marketable in nature. Furthermore, the security market line can be regarded
as a powerful measure in ascertaining whether a selected asset for the inclusion process in a
portfolio can play a key role in offering a desired return rate.
3
the same portfolio of tangent. Therefore, the CML attains from an effective part of the
minimum variance frontier that is interrelated to the feasibility to purchase or sell any risk-
free asset. Capital market line (CML) is therefore considered as the graph of the needed risk
and return of a risk-free asset’s portfolio and a bunch of other risky assets that can provide
the best trade-off of risk-return. Nevertheless, it is an important situation of allocation of
capital line that is tangent to the efficient frontier and its slope depicts the Sharpe Ratio. In
relation to this, the CML plays a key role in accounting for the risk-free assets and therefore,
it remains in the lead when it comes to effective frontier (Banbura et. al, 2015). Moreover, all
the other portfolios accommodate the exact Sharpe ratio as that in relation to the market
portfolio. Besides, while purchasing or making heavy investments in any portfolio or assets,
one relevant factor that must be taken into due consideration is that the Sharpe ratio must be
verified and the capital market line ratio of such portfolio or asset must be verified as well
(Nielsen, 2014). Further, if an asset’s Sharpe ratio remains above the ratio of CML, then the
purchase mode must happen and if it remains lesser than the CML ratio, then it must be sold
(CAPM, 2017).
Security market line (SML)
The SML can be regarded as a graphical reflection of the market or systematic risk when
compared to the market risk return on a whole at a specific time and reflects all securities that
are believed to be marketable in nature. Furthermore, the security market line can be regarded
as a powerful measure in ascertaining whether a selected asset for the inclusion process in a
portfolio can play a key role in offering a desired return rate.
3
CAPM
Each portfolio that lies on the security market line has the same Treynor ratio when compared
to the portfolio of market. Further, while investing or purchasing an asset that has a positive
beta, there is a significant factor that must be kept in due consideration and the same is that
the assets of which the Treynor ratio remains above the SML, the ratio must be purchased
and the assets of which such Treynor ratio is below the SML, such ratio must be sold. It can
be tracked from the effective hypothesis of market that one cannot shift ahead of the entire
market (Anghel & Paschia, 2013). Therefore, the Treynor ratio of all the assets must be lesser
than or equivalent to the market. Besides, when the same is utilized in the management of
portfolios, the security market line highlights on the opportunity cost of the investment.
Further, all the securities that are believed to be appropriate in terms of pricing are depicted
on such security market line. In relation to this, the assets that are higher, the line that are
undervalued in nature in relation to the beta factor project a better return. Besides,
overvaluation or exaggeration of value happens when such asset is lesser the line because for
the same amount of risk, the return is very lesser as well. Therefore, from the previously
mentioned graph, it is very clear that the capital market line is utilized to highlight the rate of
return by using the risk-free return rate and the risk level for a particular portfolio. However,
in contrast to this, the security market line is utilized to highlight the market risk. Hence,
when it comes to the capital market line, it plays a key role in explaining the portfolio that is
4
Paraphrase This Document
Need a fresh take? Get an instant paraphrase of this document with our AI Paraphraser
CAPM
effective in nature and in contrast to this, security market line played a key role in defining
both non-effective as well as effective portfolio.
Minimum variance portfolio
In association to minimum variance portfolio, the same is explained as a portfolio of
securities that can combine to reduce the volatility of prices of the aggregate portfolio.
Further, volatility is a significant term that is more generally used in place of a variance in the
community of investments and is defined as a statistical measure of a specific price
movement (downs and ups) of a security. Nevertheless, a minimum portfolio of variance
signifies a well-expanded portfolio that comprises of individually risky assets that are hedged
when are collectively traded, thereby resulting in the minimum feasible risk for the rate of
anticipated return.
An investment’s portfolio can also be interchangeable in meaning with the risky market.
Hence, the higher the investment’s volatility (the broader the movements ups and downs in
prices), the greater is the market risk. Therefore, if an investor intends to reduce risk, he must
also be willing to reduce the ups and downs. This plays a key role in leveraging the risk of
every asset of an individual with an offsetting investment, thereby hedging the net risk of
portfolio for the risk level acceptable in relation to the expected return of portfolio rate.
Nevertheless, if every investment is simply put in a minimum variance, the portfolio is
considered risky in nature if the same has been traded individually. However, when the same
has been traded in the portfolio, the risk is hedged in nature. Further, the term initiates from
the theory of Markowitz Portfolio that plays a vital part in suggesting that the volatility can
be utilized to replace the risk and hence, lesser volatility variance interrelates with lesser risk
of investment. Furthermore, a minimum portfolio of variance is defined as a model of
portfolio that is made up of various investments that are highly volatile in nature individually
but are observed by few as lesser risks when are put together. This model of portfolio may
not be appropriate for the individual investors in some situations but, the build of a minimum
portfolio of variance is not recommended.
The theory or ideology of MPT (modern portfolio theory) has become the cornerstone of the
construction of portfolios for various practitioners and academics since the introduction of the
same in the year 1952. Furthermore, every learner of finance must study the source of
volatility of portfolio, the advantages of its expansion, and the ideology of effective frontier
(CFI , 2017)r. Further, the portfolio of all assets risky in nature at the initial stage of the
5
CAPM
effective frontier is called as the modern portfolio theory (MVP). It is not crucial to offer a
forecast of anticipated returns to obtain the modern portfolio theory. Instead, it only requires
a forecast of risk and interrelation for each risky asset. Nevertheless, the MVP can be sought
by solving the equation that utilizes the universe of all risky assets to generate a portfolio
with the minimum amount of volatility. The equation is min ½w '∑w (Equation 1) st: w ' 1 =
1, wherein w implies weights, ∑ signifies the covariance matrix of all the security returns.
Importance and relevance of the capital asset pricing model
For calculation of the CAPM, it must be noted that the model relies on a risk multiplier that is
popularly called as beta coefficient (β). Furthermore, the same is depicted by the following
equation:
Anticipated or expected return= rᶠ + β (rᵐ - rᶠ)
In relation to this, CAPM plays a key role in determining what is the fair value of an
investment. Furthermore, when the return rate of an asset is calculated, the same rate is used
to discount the cash flows of future in relation to an investment to their respective present
value so that the fair value of the same can be attained (CAPM, 2017). Besides, this method
assists in playing two roles that is offering a return rate that operates as a reference for
evaluating the investments, and secondly, it also facilitates in forecasting the expected return
that is yet to be traded(CFI, 2017). Hence, the investment’s fair value can be compared with
the market value and decisions can be made thereafter. This method is an effective way to
ascertain the return as an investor can be compensated for their borne systematic risks
because the same cannot be expanded (David & Mullins, 2018). Nevertheless, the investors
can anticipate return from their investments based on the level of risk. Therefore, for a higher
return, it is required to bear systematic risk because when more stocks are held, then one
becomes vulnerable to business cycles and therefore, the aggregate returns.
CAPM also has some drawbacks but it remains a significant weapon in the segment of
financial management. Further, investors are benefitted when clues are drawn from the
market. Hence, low beta stocks can be accounted for. Nevertheless, CAPM is a powerful
theory because it offers a measure of evaluation of risk and assists investors to determine
what they need. It is also beneficial for equity purposes as it facilitates assessment and
calculation of potential returns(CFI, 2017). In addition, the investors are also compensated
through emphasis on ways like risk factor and time value of money. It accounts only
systematic risks, thereby reflecting a reality wherein most investors have expanded portfolios
6
CAPM
from which the unsystematic risks can be significantly eradicated. This method is better than
the WACC in offering discount rates for utilization appraisal. The model accounts for the
accuracy of choosing a portfolio of market broker and the variance in security returns is the
only source of methodical risk (Da et. al, 2012). Thereafter, the risk premium on the portfolio
of securities consider as the function of such methodical risk that can be measured by the beta
on the effective index of benchmark. When the CAPM was altered to four factors, the
company’s tendency with positive prior profits to attain positive returns and companies with
negative profits to attain negative future returns could be explained. Firstly, portfolios
describe the variation in the company’s return with high in comparison to low ratio of market
value. Secondly, such portfolio describes the variations in expected returns of small and large
companies. Lastly, the risk premium on the security is a main method for methodical risks
and the same can be measured by the betas (Da et. al, 2012). The fourth factor was called as
the price momentum factor that was later added to the model. Therefore, these are the factors
that were changed in the capital asset pricing model.
Hence, from the overall discussion it can be commented that the CAPM model is of immense
utility as it projects the link between the return that is expected and the risk of investment in a
security. It signifies that the expected return on a security is equivalent to the risk free return
with a risk premium that dwells on the beta of the security.
7
Secure Best Marks with AI Grader
Need help grading? Try our AI Grader for instant feedback on your assignments.
CAPM
References
Anghel, M.G. and Paschia, L. (2013) Using the CAPM Model to Estimate the Profitability of
a Financial Instrument Portfolio. Annales Universitatis Apulensis: Series Oeconomica, 15(2),
541-551. Available from: http://www.oeconomica.uab.ro/upload/lucrari/1520132/19.pdf
Banbura, M., Giannone, D. and Lenza, M. (2015) Conditional forecasts and scenario analysis
with vector autoregressions for large cross-sections. International Journal of
Forecasting, 31(3), pp.739-756. Available from:
https://www.ecb.europa.eu/pub/pdf/scpwps/ecbwp1733.pdf?
34d83c4b9cc14af18001108a69abb1c3
CAPM. (2017) Using the CAPM model to price risk and allocate capital efficiently. Available
from: https://www.quantilia.com/risk-premium-capm/ [Accessed 10 September 2018]
CFI. (2017) Capital Allocation Line (CAL) and Optimal Portfolio. Available from:
https://corporatefinanceinstitute.com/resources/knowledge/finance/capital-allocation-line-cal-
and-optimal-portfolio/ [Accessed 10 September 2018]
Christensen, J. (2011) Good analytical research, European Accounting Review, 20(1), 41-51
Da, Z., Guo, R.J. and Jagannathan, R. (2012) CAPM for estimating the cost of equity capital:
Interpreting the empirical evidence. Journal of Financial Economics. 103, 204–220.
Available from: https://www3.nd.edu/~zda/COC.pdf
David, W., & Mullins, J. (2018) Does the Capital Asset pricing model work? Available from:
https://hbr.org/1982/01/does-the-capital-asset-pricing-model-work [Accessed 10 September
2018]
Lee, M.C. (2014) Capital market line based on efficient frontier of portfolio with borrowing
and lending rate. Available from:
https://www.researchgate.net/publication/264547651_Capital_market_line_based_on_efficie
nt_frontier_of_portfolio_with_borrowing_and_lending_rate [Accessed 10 September 2018]
Nielsen. L.T (2006) The instantaneous capital market line. Available from:
https://link.springer.com/article/10.1007/s00199-005-0638-1 [Accessed 10 September
2018]
8

CAPM
9
9
1 out of 9
Related Documents


Your All-in-One AI-Powered Toolkit for Academic Success.
+13062052269
info@desklib.com
Available 24*7 on WhatsApp / Email
![[object Object]](/_next/static/media/star-bottom.7253800d.svg)
Unlock your academic potential
© 2024 | Zucol Services PVT LTD | All rights reserved.