Project Report: Business Finance
Added on 2023-06-05
19 Pages4058 Words83 Views
Running Head: Business Finance
1
Project Report: Business Finance
1
Project Report: Business Finance
Business Finance
2
Contents
Introduction.......................................................................................................................3
1.Description of the company...........................................................................................3
2.Calculation and analysis of performance ratios.............................................................3
Short term solvency position........................................................................................4
Long term solvency position........................................................................................5
Asset utilization ratio....................................................................................................6
Profitability ratios.........................................................................................................7
Market value ratios.......................................................................................................9
3.Graphs and comparison of share price movements.....................................................10
4.Share valuation............................................................................................................11
5.Conclusion...................................................................................................................12
6.Recommendation.........................................................................................................12
References.......................................................................................................................14
Appendix.........................................................................................................................16
Business Finance
3
Introduction:
An investor is the one who invests the money into the business against the dividend
amount from the business. Investors always evaluates various factors while making decision
about the investment into a particular company. The evaluation on the stock price, intrinsic
value financial ratios, changes into the stock price etc are few of the methods to measure the
investment level of a business (Higgins, 2012). These financial and stock analysis tools make
it way easier for the investors to evaluate more than one company in the same industry and
make better decision about the position of the company.
In the report, an Australian company, Coca cola Amatil has been taken into the
concern to evaluate and apply the various financial and stock analysis tools in order to
measure the performance of the company. The main objectives behind the report are to offer
a recommendation to a foreign investors that whether the investment into the Coca cola
Amatil would be a good option or not.
1. Description of the company:
Coca Cola Amatil limited is operating its business in the Australian market. The core
activities of the business is to manufacture, distribute, marketing and sales the non alcoholic
drinks in the Australian market which is ready to drink. The company is among the largest
ready to drink beverages selling company in the Australian and Asia pacific region. The
company has been founded in the year of 1904. The main operational countries of the
company are Australia, New Zealand, Indonesia, Samoa etc (Home, 2018).
Main products of the company includes Coca cola, Direct coke, powerade, Kriks, Cola
Zero, Deep Spring etc. the main competitive advantages of the company includes its
diversification into different countries and the numerous products offered by the company for
different customer segment. The highest share of Coca cola Amatil is owned by Coca Cola
limited (Reuters, 2018). The revenue of the company is depicting continuous growth in the
position of the business.
2. Calculation and analysis of performance ratios:
Performance ratios are one of the financial evaluation tools and investment analysis
tool. This tool takes the concern of final financial statement of the business in order to
measure that how the company is performing in the industry and whether the investment into
Business Finance
4
the company is a good option for the investors or not. In order to evaluate the performance of
Coca Cola Amatil limited, liquidity position, profitability position, asset utilization position,
capital structure position and market value position of the company has been evaluated of last
2 years. The performance ratio and calculations are as follows:
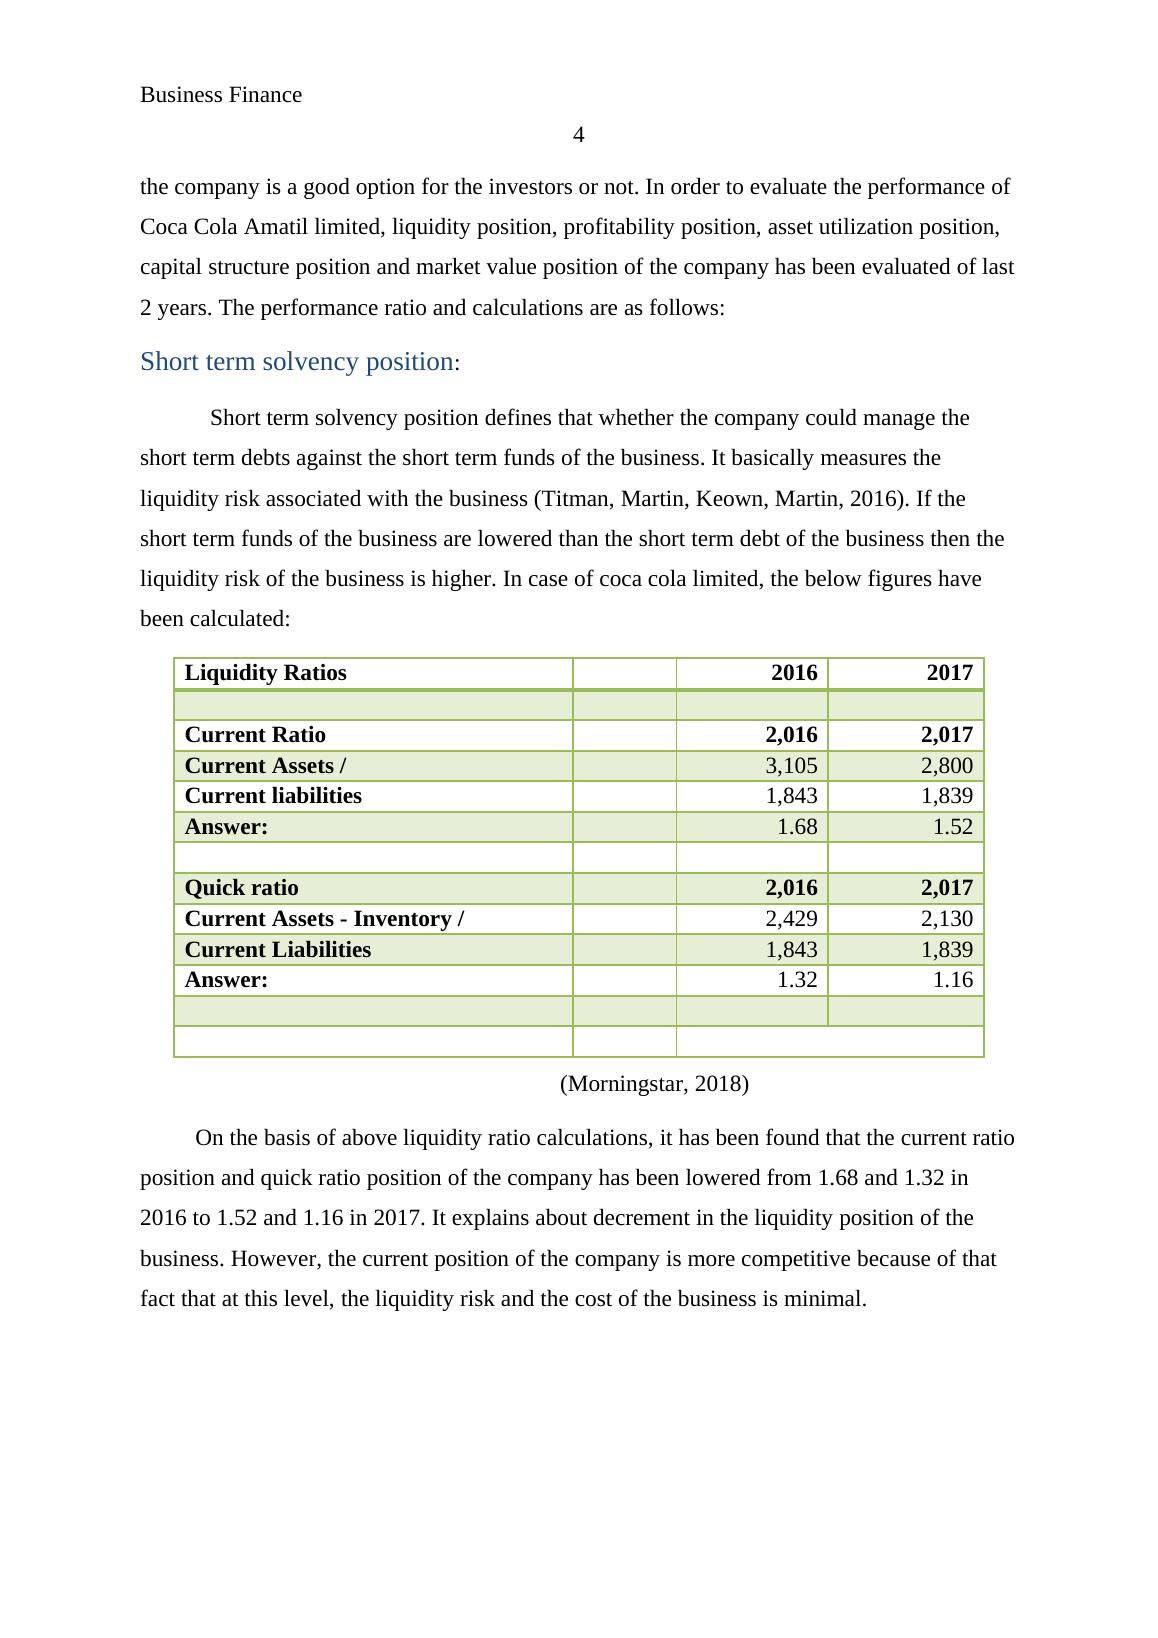
Short term solvency position:
Short term solvency position defines that whether the company could manage the
short term debts against the short term funds of the business. It basically measures the
liquidity risk associated with the business (Titman, Martin, Keown, Martin, 2016). If the
short term funds of the business are lowered than the short term debt of the business then the
liquidity risk of the business is higher. In case of coca cola limited, the below figures have
been calculated:
Liquidity Ratios 2016 2017
Current Ratio 2,016 2,017
Current Assets / 3,105 2,800
Current liabilities 1,843 1,839
Answer: 1.68 1.52
Quick ratio 2,016 2,017
Current Assets - Inventory / 2,429 2,130
Current Liabilities 1,843 1,839
Answer: 1.32 1.16
(Morningstar, 2018)
On the basis of above liquidity ratio calculations, it has been found that the current ratio
position and quick ratio position of the company has been lowered from 1.68 and 1.32 in
2016 to 1.52 and 1.16 in 2017. It explains about decrement in the liquidity position of the
business. However, the current position of the company is more competitive because of that
fact that at this level, the liquidity risk and the cost of the business is minimal.
4
the company is a good option for the investors or not. In order to evaluate the performance of
Coca Cola Amatil limited, liquidity position, profitability position, asset utilization position,
capital structure position and market value position of the company has been evaluated of last
2 years. The performance ratio and calculations are as follows:
Short term solvency position:
Short term solvency position defines that whether the company could manage the
short term debts against the short term funds of the business. It basically measures the
liquidity risk associated with the business (Titman, Martin, Keown, Martin, 2016). If the
short term funds of the business are lowered than the short term debt of the business then the
liquidity risk of the business is higher. In case of coca cola limited, the below figures have
been calculated:
Liquidity Ratios 2016 2017
Current Ratio 2,016 2,017
Current Assets / 3,105 2,800
Current liabilities 1,843 1,839
Answer: 1.68 1.52
Quick ratio 2,016 2,017
Current Assets - Inventory / 2,429 2,130
Current Liabilities 1,843 1,839
Answer: 1.32 1.16
(Morningstar, 2018)
On the basis of above liquidity ratio calculations, it has been found that the current ratio
position and quick ratio position of the company has been lowered from 1.68 and 1.32 in
2016 to 1.52 and 1.16 in 2017. It explains about decrement in the liquidity position of the
business. However, the current position of the company is more competitive because of that
fact that at this level, the liquidity risk and the cost of the business is minimal.
End of preview
Want to access all the pages? Upload your documents or become a member.
Related Documents
Structure of Ownership Governancelg...
|16
|4224
|63
Business Report - Coca Cola Amatil Limitedlg...
|23
|4529
|69
Financial Analysis of Coca Cola Amatil: WACC, ROE, Cost of Debt and Gearing Ratiolg...
|10
|2442
|164
Analysis of Annual Report of Coca-Cola Amatil 2017lg...
|16
|3402
|402
Coca Cola Amatil Limited: Financial Analysis and Board Assessmentlg...
|19
|4655
|103
Ratio Analysis of Coca Cola Amatil: Financial Performance and Positionlg...
|11
|2171
|71