Android Line Graph CSV Data Plotting

Verified

Added on  2019/09/16

|2
|365
|366
Practical Assignment
AI Summary
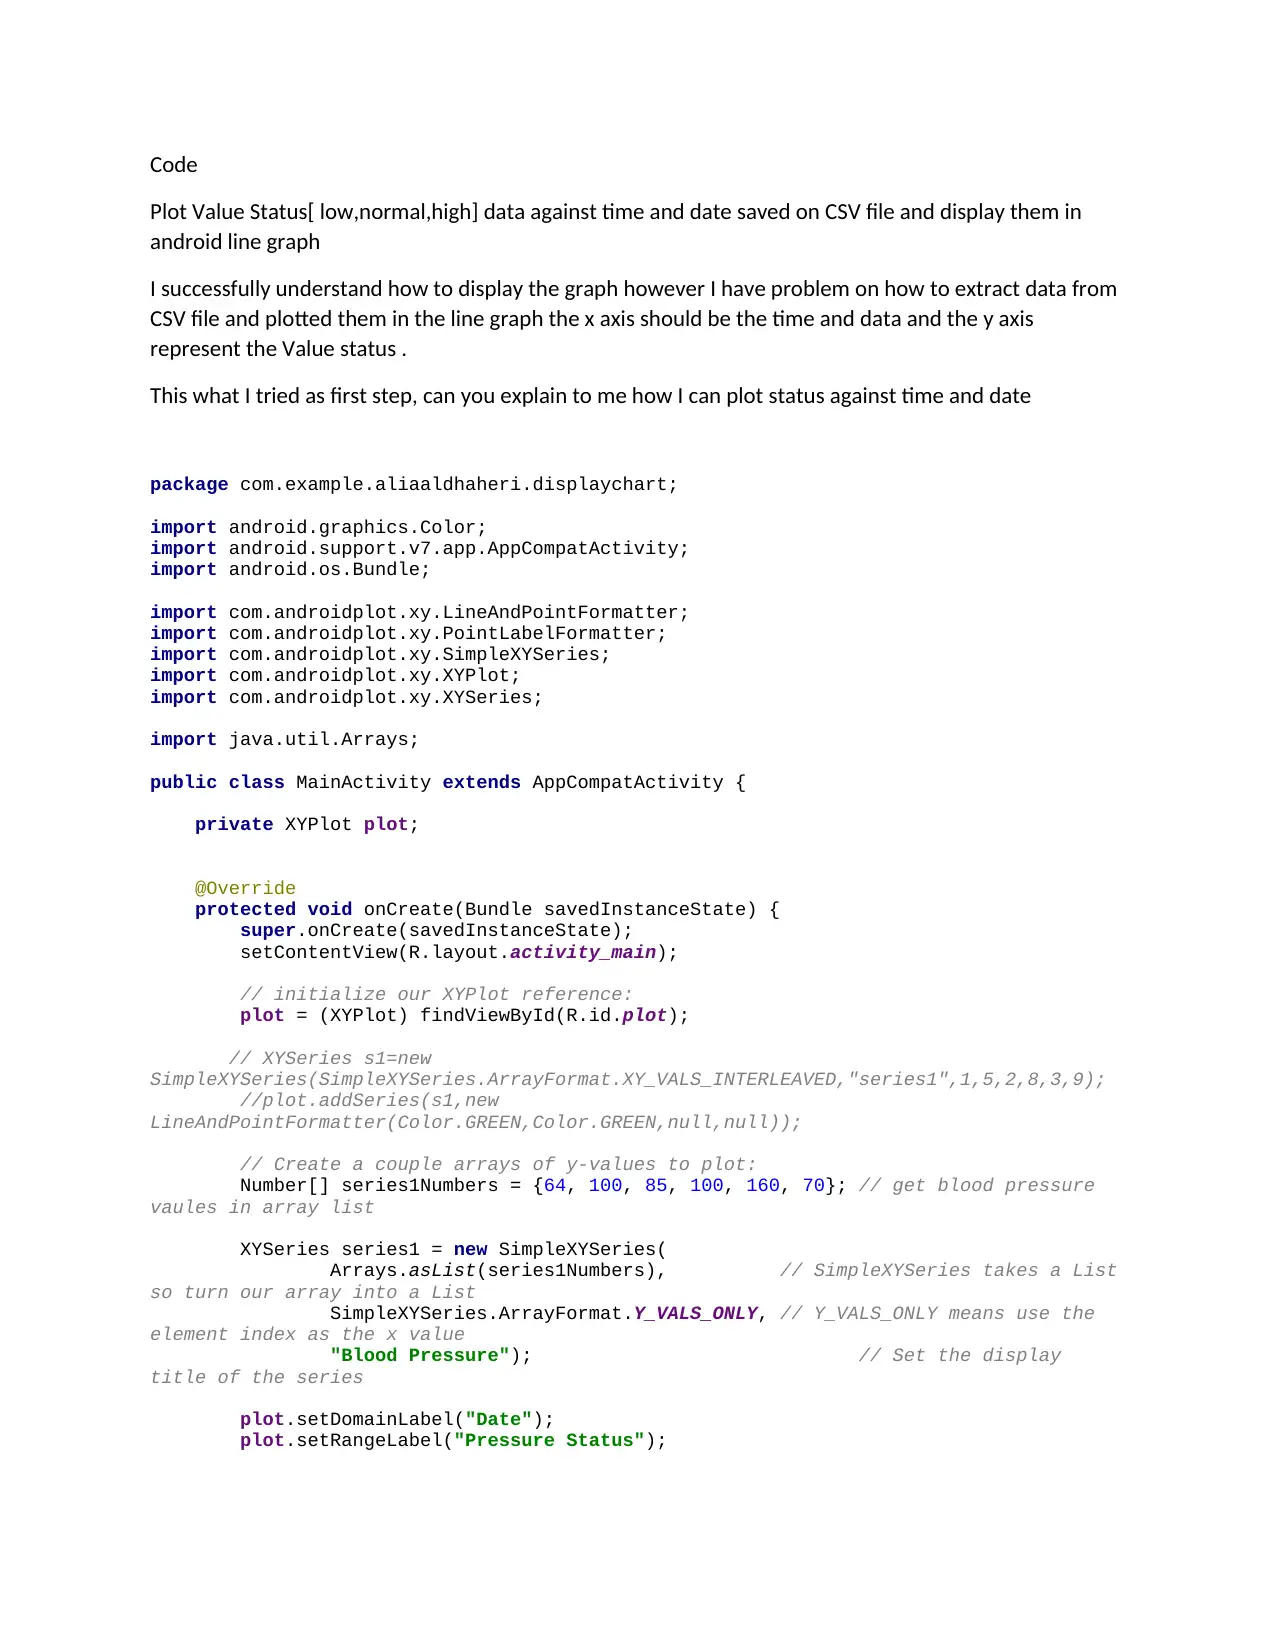
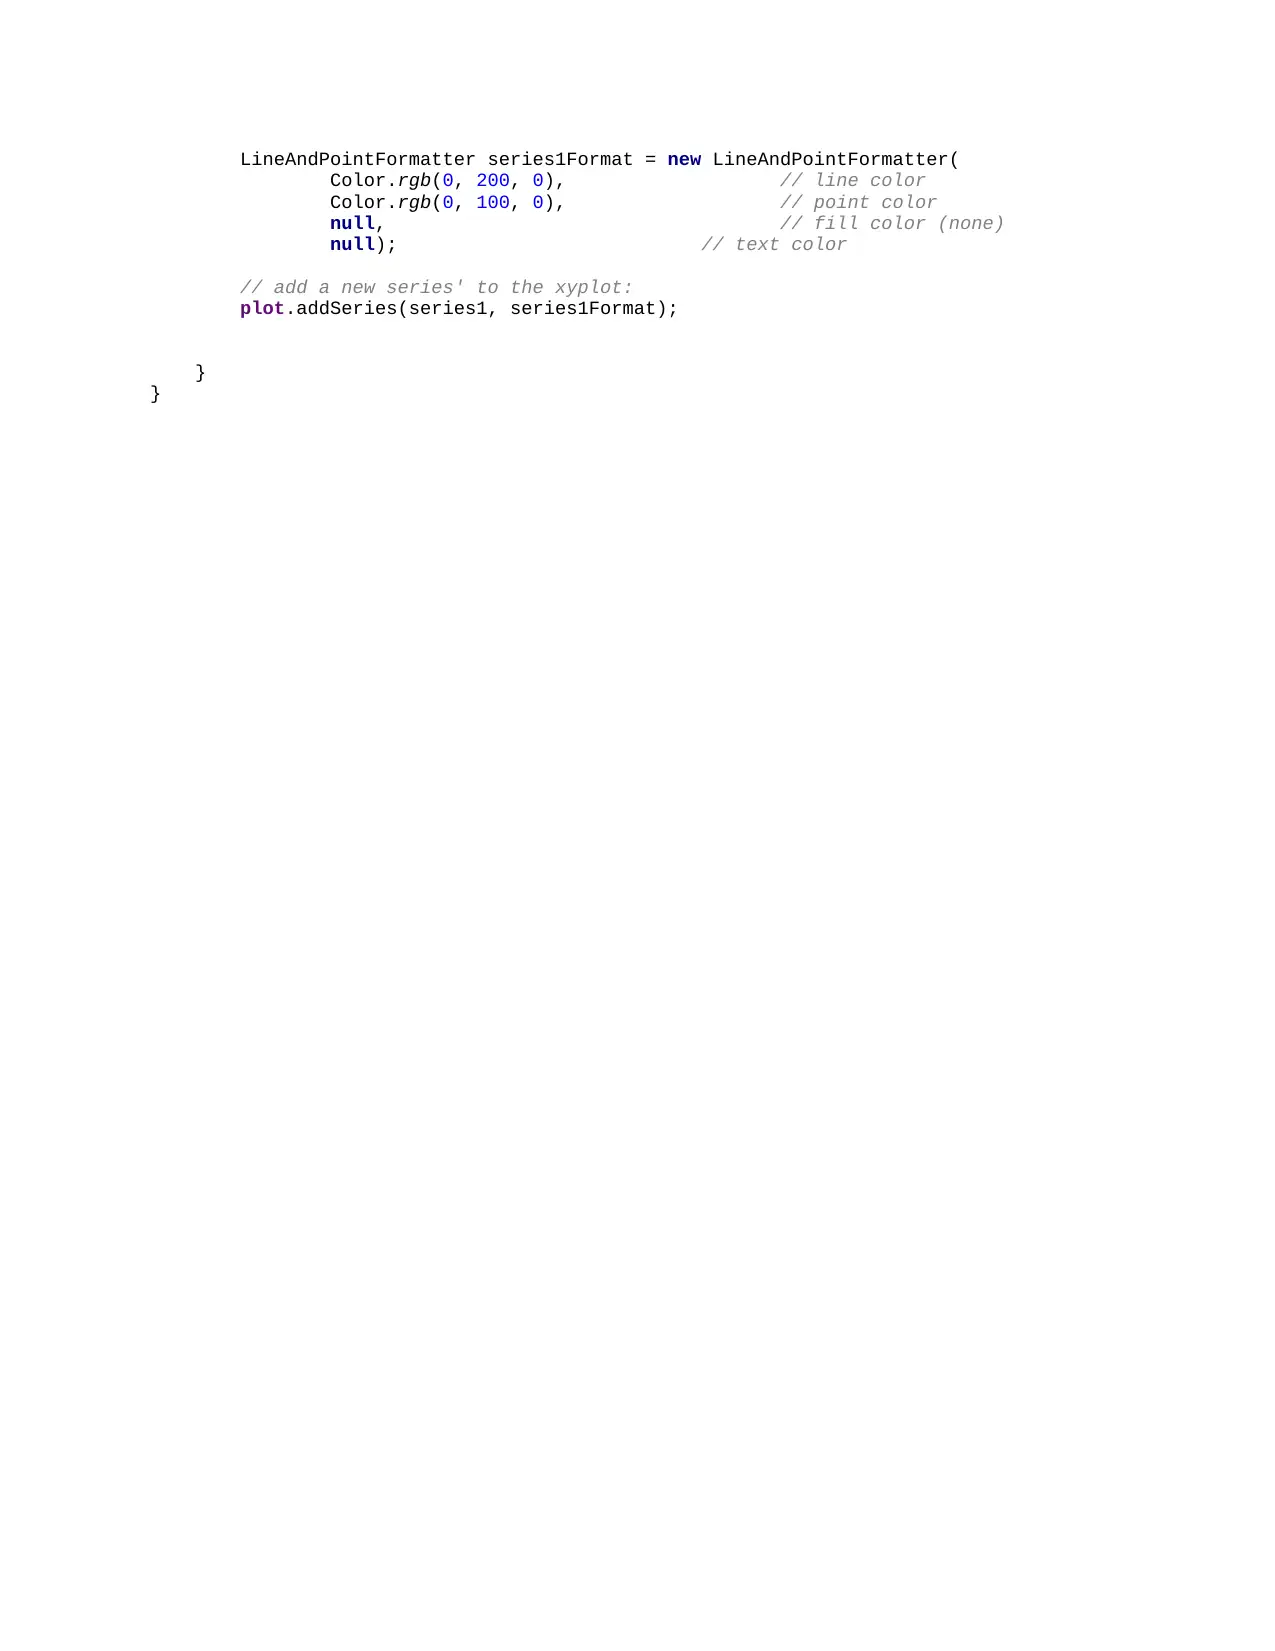
This practical assignment focuses on plotting data from a CSV file onto an Android line graph. The challenge lies in extracting time and status data from the CSV file and using it to correctly populate the x and y axes of the graph. The provided code demonstrates the basic setup of an Android line graph using the AndroidPlot library, but it needs to be extended to handle CSV data parsing and plotting. The goal is to display the status values against the corresponding time and date from the CSV file.
Document Page
Code
Plot Value Status[ low,normal,high] data against time and date saved on CSV file and display them in
android line graph
I successfully understand how to display the graph however I have problem on how to extract data from
CSV file and plotted them in the line graph the x axis should be the time and data and the y axis
represent the Value status .
This what I tried as first step, can you explain to me how I can plot status against time and date
package com.example.aliaaldhaheri.displaychart;
import android.graphics.Color;
import android.support.v7.app.AppCompatActivity;
import android.os.Bundle;
import com.androidplot.xy.LineAndPointFormatter;
import com.androidplot.xy.PointLabelFormatter;
import com.androidplot.xy.SimpleXYSeries;
import com.androidplot.xy.XYPlot;
import com.androidplot.xy.XYSeries;
import java.util.Arrays;
public class MainActivity extends AppCompatActivity {
private XYPlot plot;
@Override
protected void onCreate(Bundle savedInstanceState) {
super.onCreate(savedInstanceState);
setContentView(R.layout.activity_main);
// initialize our XYPlot reference:
plot = (XYPlot) findViewById(R.id.plot);
// XYSeries s1=new
SimpleXYSeries(SimpleXYSeries.ArrayFormat.XY_VALS_INTERLEAVED,"series1",1,5,2,8,3,9);
//plot.addSeries(s1,new
LineAndPointFormatter(Color.GREEN,Color.GREEN,null,null));
// Create a couple arrays of y-values to plot:
Number[] series1Numbers = {64, 100, 85, 100, 160, 70}; // get blood pressure
vaules in array list
XYSeries series1 = new SimpleXYSeries(
Arrays.asList(series1Numbers), // SimpleXYSeries takes a List
so turn our array into a List
SimpleXYSeries.ArrayFormat.Y_VALS_ONLY, // Y_VALS_ONLY means use the
element index as the x value
"Blood Pressure"); // Set the display
title of the series
plot.setDomainLabel("Date");
plot.setRangeLabel("Pressure Status");
tabler-icon-diamond-filled.svg

Paraphrase This Document

Need a fresh take? Get an instant paraphrase of this document with our AI Paraphraser
Document Page
LineAndPointFormatter series1Format = new LineAndPointFormatter(
Color.rgb(0, 200, 0), // line color
Color.rgb(0, 100, 0), // point color
null, // fill color (none)
null); // text color
// add a new series' to the xyplot:
plot.addSeries(series1, series1Format);
}
}
chevron_up_icon
1 out of 2
circle_padding
hide_on_mobile
zoom_out_icon
[object Object]