Company accounting - Assignment
VerifiedAdded on 2021/05/31
|16
|2806
|42
AI Summary
Contribute Materials
Your contribution can guide someone’s learning journey. Share your
documents today.
Running head: COMPANY ACCOUNTING
Company Accounting
Name of Student:
Name of University:
Author’s Note:
Company Accounting
Name of Student:
Name of University:
Author’s Note:
Secure Best Marks with AI Grader
Need help grading? Try our AI Grader for instant feedback on your assignments.
1COMPANY ACCOUNTING
Table of Contents
Introduction......................................................................................................................................2
Nature of the Company’s Activities................................................................................................2
Composition of The Company’s Equity..........................................................................................2
Share price for the company’s ordinary shares for the last day of the financial year......................4
Share price for the company’s ordinary shares one calendar month after the end of financial year
.........................................................................................................................................................5
Debt structure and the source of external financing........................................................................6
Provision for income tax figure, deferred tax assets/liabilities........................................................8
Key elements in the fixed assets categories...................................................................................10
Policy for recognising the impairment of intangible assets asset..................................................11
Summary of company’s financial operations during the financial year........................................13
Conclusion.....................................................................................................................................13
References......................................................................................................................................15
2COMPANY ACCOUNTING
Introduction
The report aims to assess the QBE insurance’s financial statement. Some of the main
discourse of the study will comprise of the discussion on the activities performed by the
company. The various sections of the discussions will further evaluate the composition of equity
for QBE insurance. The third section of the study has been discussed with the various types of
the factors which are associated to the share price for the company’s ordinary shares for the last
day of the financial year. This section is followed with the various types of the discussions
pertaining to the company’s shares one calendar month after the end of financial year. The
important discussions on this aspect has been conducive in suggesting the difference in one
month for this period. The fifth section of the study has emphasized on the debt structure of the
company associated to the sourcing of the external debt. Some of the other section of the
discussions of the report has been able to consider the discussions associated to the discussions
in the key elements in the fixed assets categories. The last section has evaluated the policy for
impairment of the intangible assets made by the company (Titman, Keown & Martin, 2017).
Nature of the Company’s Activities
QBE Insurance headquartered in Sydney is recognised considered Australia’s one of the
largest insurer which provides the services across wide range of the countries including
“Australia, America, Europe and Asia Pacific region” (Martin, 2016). Originally QBE insurance
was better known as “North Queensland Insurance Co,” in 1886 situated in “Townsville, in
northern Queensland, Australia”. The company is seen to employ 14500 staff across 37 countries
worldwide. The total market capitalization of the company is discerned with A$ 17.81 billion
however the after-tax loss of the company has been reported as $ 1249 million in 2017. The
presentation currency of the company has been further depicted as AUD as the main accounting
framework is based AASB reporting standards (Renz & Herman, 2016).
Composition of The Company’s Equity
In the capital structure of the company equity comprises of the common preferred stock
along with the retained earnings which is considered as the total of shareholders equity (Finkler
et al., 2016). The main accounts for the QBE Insurance in the equity evaluation has been
3COMPANY ACCOUNTING
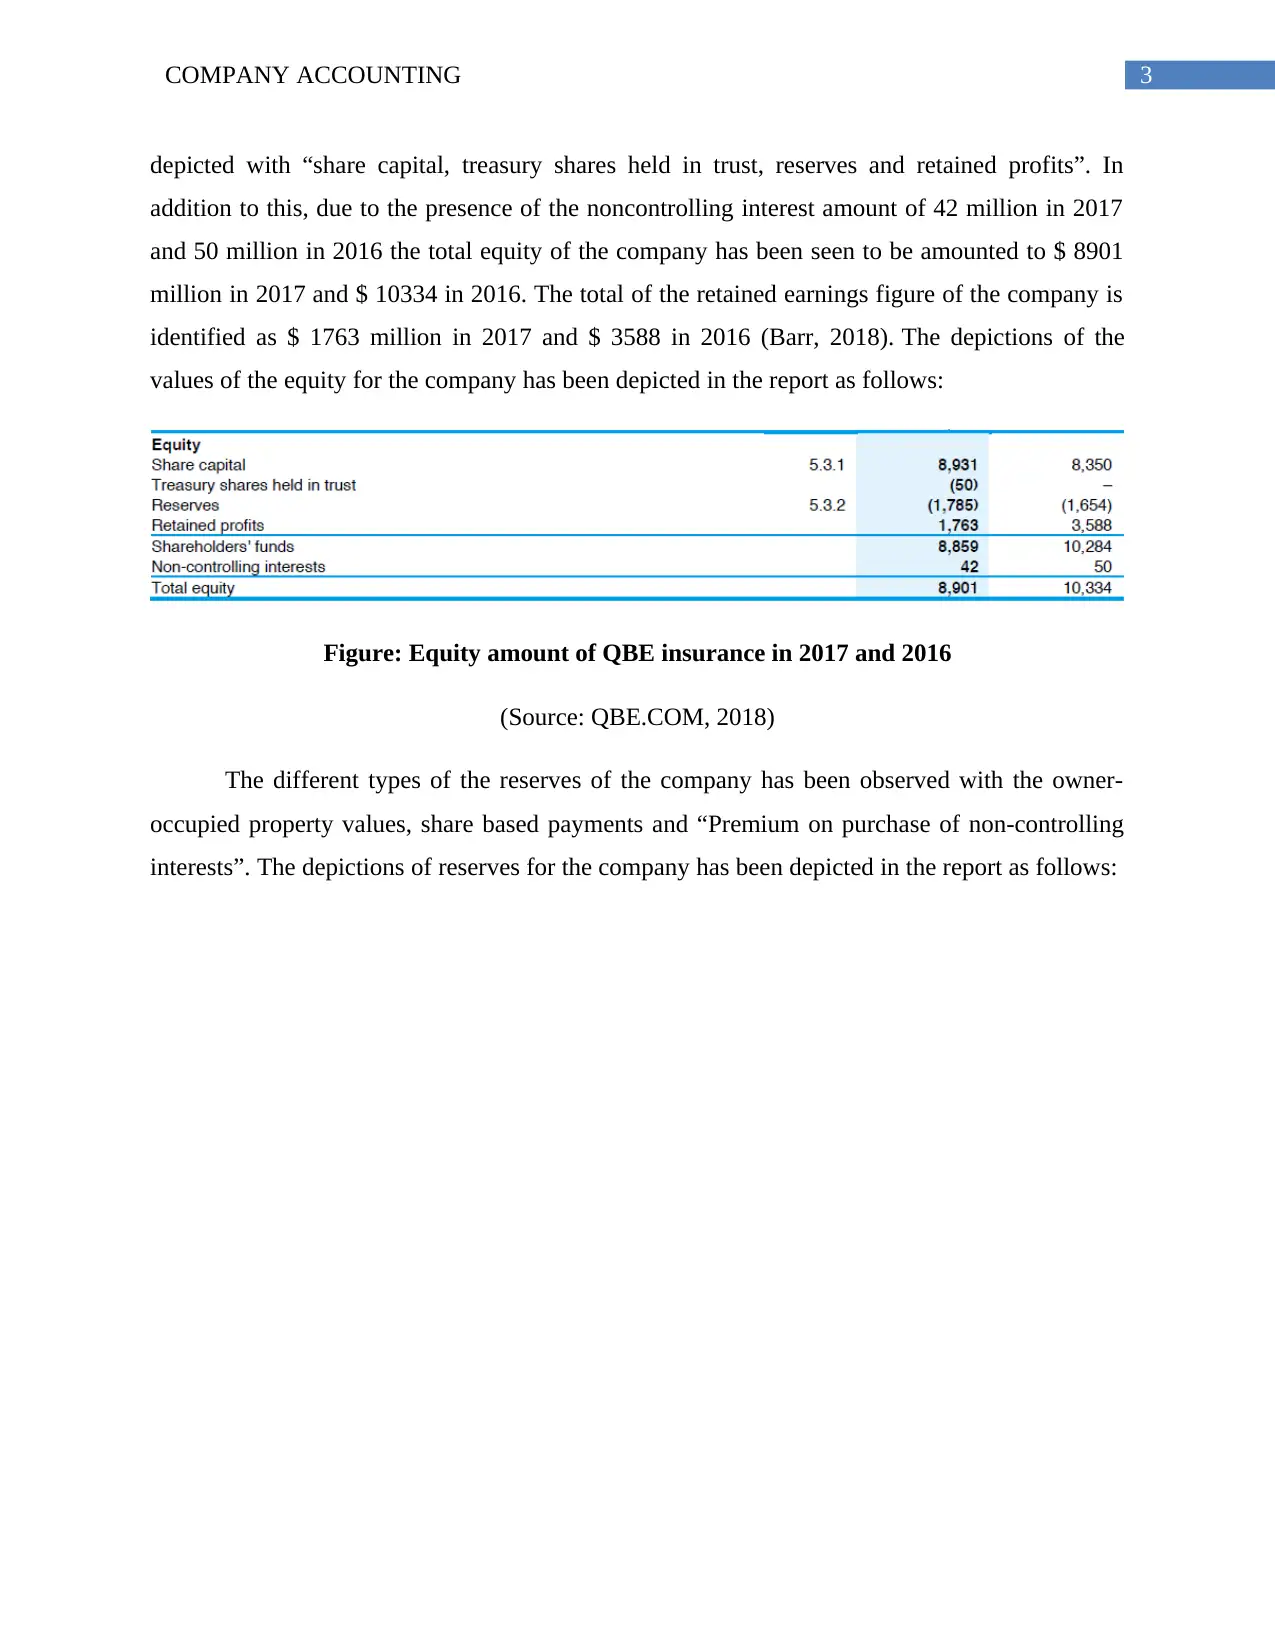
depicted with “share capital, treasury shares held in trust, reserves and retained profits”. In
addition to this, due to the presence of the noncontrolling interest amount of 42 million in 2017
and 50 million in 2016 the total equity of the company has been seen to be amounted to $ 8901
million in 2017 and $ 10334 in 2016. The total of the retained earnings figure of the company is
identified as $ 1763 million in 2017 and $ 3588 in 2016 (Barr, 2018). The depictions of the
values of the equity for the company has been depicted in the report as follows:
Figure: Equity amount of QBE insurance in 2017 and 2016
(Source: QBE.COM, 2018)
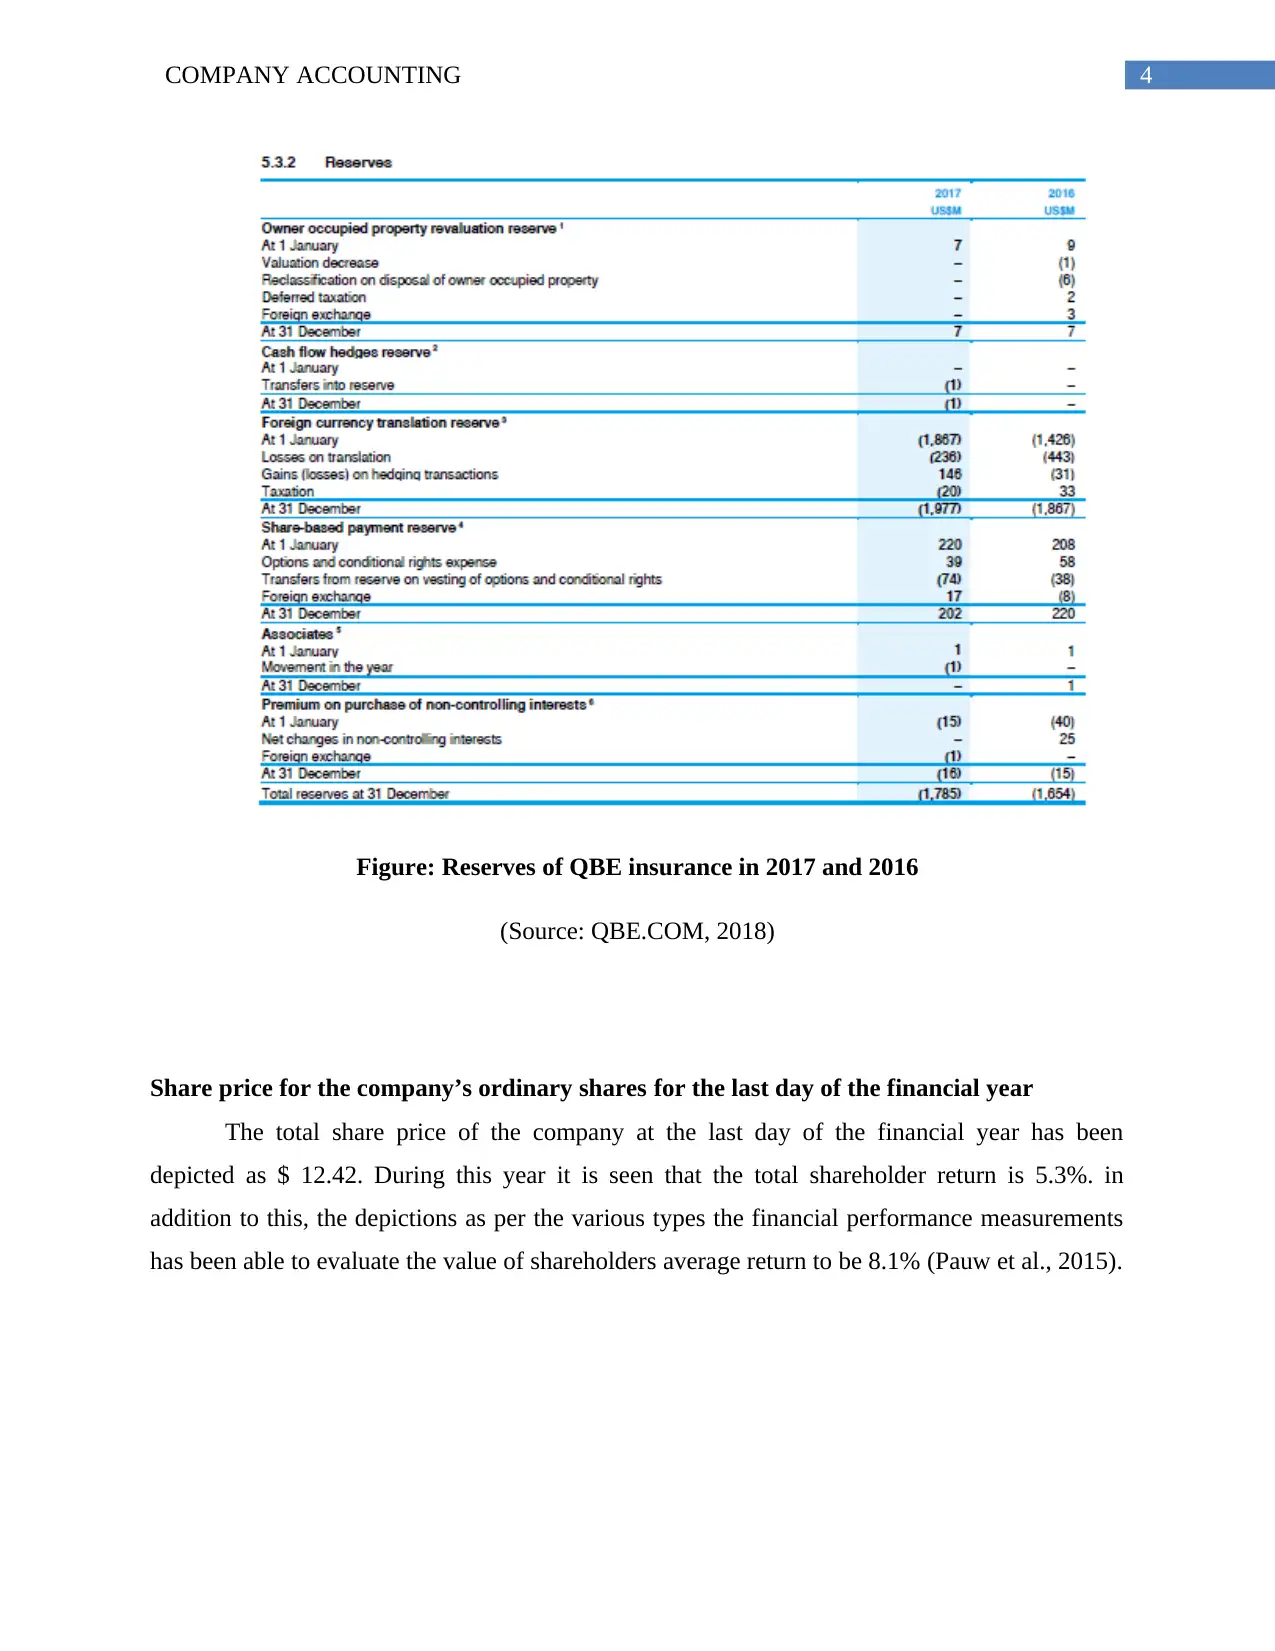
The different types of the reserves of the company has been observed with the owner-
occupied property values, share based payments and “Premium on purchase of non-controlling
interests”. The depictions of reserves for the company has been depicted in the report as follows:
depicted with “share capital, treasury shares held in trust, reserves and retained profits”. In
addition to this, due to the presence of the noncontrolling interest amount of 42 million in 2017
and 50 million in 2016 the total equity of the company has been seen to be amounted to $ 8901
million in 2017 and $ 10334 in 2016. The total of the retained earnings figure of the company is
identified as $ 1763 million in 2017 and $ 3588 in 2016 (Barr, 2018). The depictions of the
values of the equity for the company has been depicted in the report as follows:
Figure: Equity amount of QBE insurance in 2017 and 2016
(Source: QBE.COM, 2018)
The different types of the reserves of the company has been observed with the owner-
occupied property values, share based payments and “Premium on purchase of non-controlling
interests”. The depictions of reserves for the company has been depicted in the report as follows:
Secure Best Marks with AI Grader
Need help grading? Try our AI Grader for instant feedback on your assignments.
4COMPANY ACCOUNTING
Figure: Reserves of QBE insurance in 2017 and 2016
(Source: QBE.COM, 2018)
Share price for the company’s ordinary shares for the last day of the financial year
The total share price of the company at the last day of the financial year has been
depicted as $ 12.42. During this year it is seen that the total shareholder return is 5.3%. in
addition to this, the depictions as per the various types the financial performance measurements
has been able to evaluate the value of shareholders average return to be 8.1% (Pauw et al., 2015).
5COMPANY ACCOUNTING
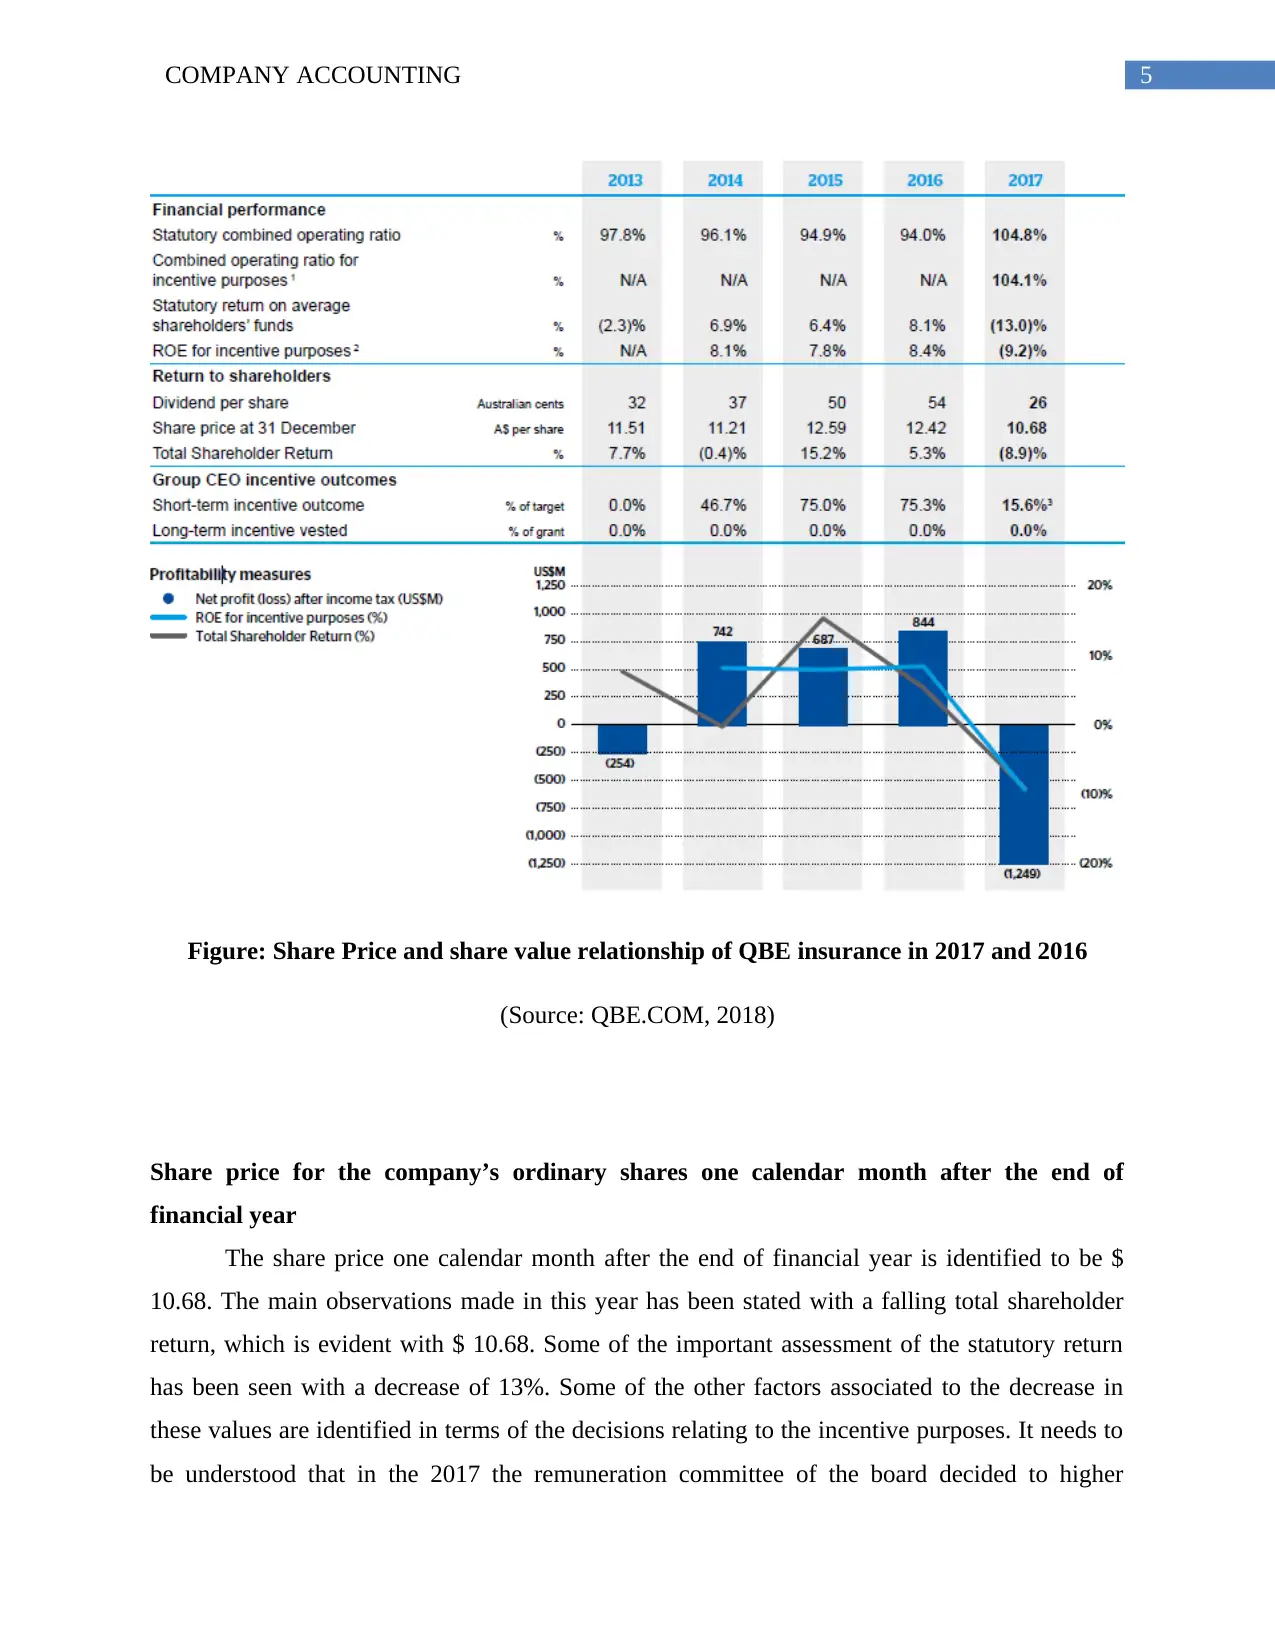
Figure: Share Price and share value relationship of QBE insurance in 2017 and 2016
(Source: QBE.COM, 2018)
Share price for the company’s ordinary shares one calendar month after the end of
financial year
The share price one calendar month after the end of financial year is identified to be $
10.68. The main observations made in this year has been stated with a falling total shareholder
return, which is evident with $ 10.68. Some of the important assessment of the statutory return
has been seen with a decrease of 13%. Some of the other factors associated to the decrease in
these values are identified in terms of the decisions relating to the incentive purposes. It needs to
be understood that in the 2017 the remuneration committee of the board decided to higher
6COMPANY ACCOUNTING
portion of the share capital toward the staff incentives .in addition this, it needs to be also
considered that the important consideration related to the dividend per share was also low in
nature (Zietlow et al., 2018).
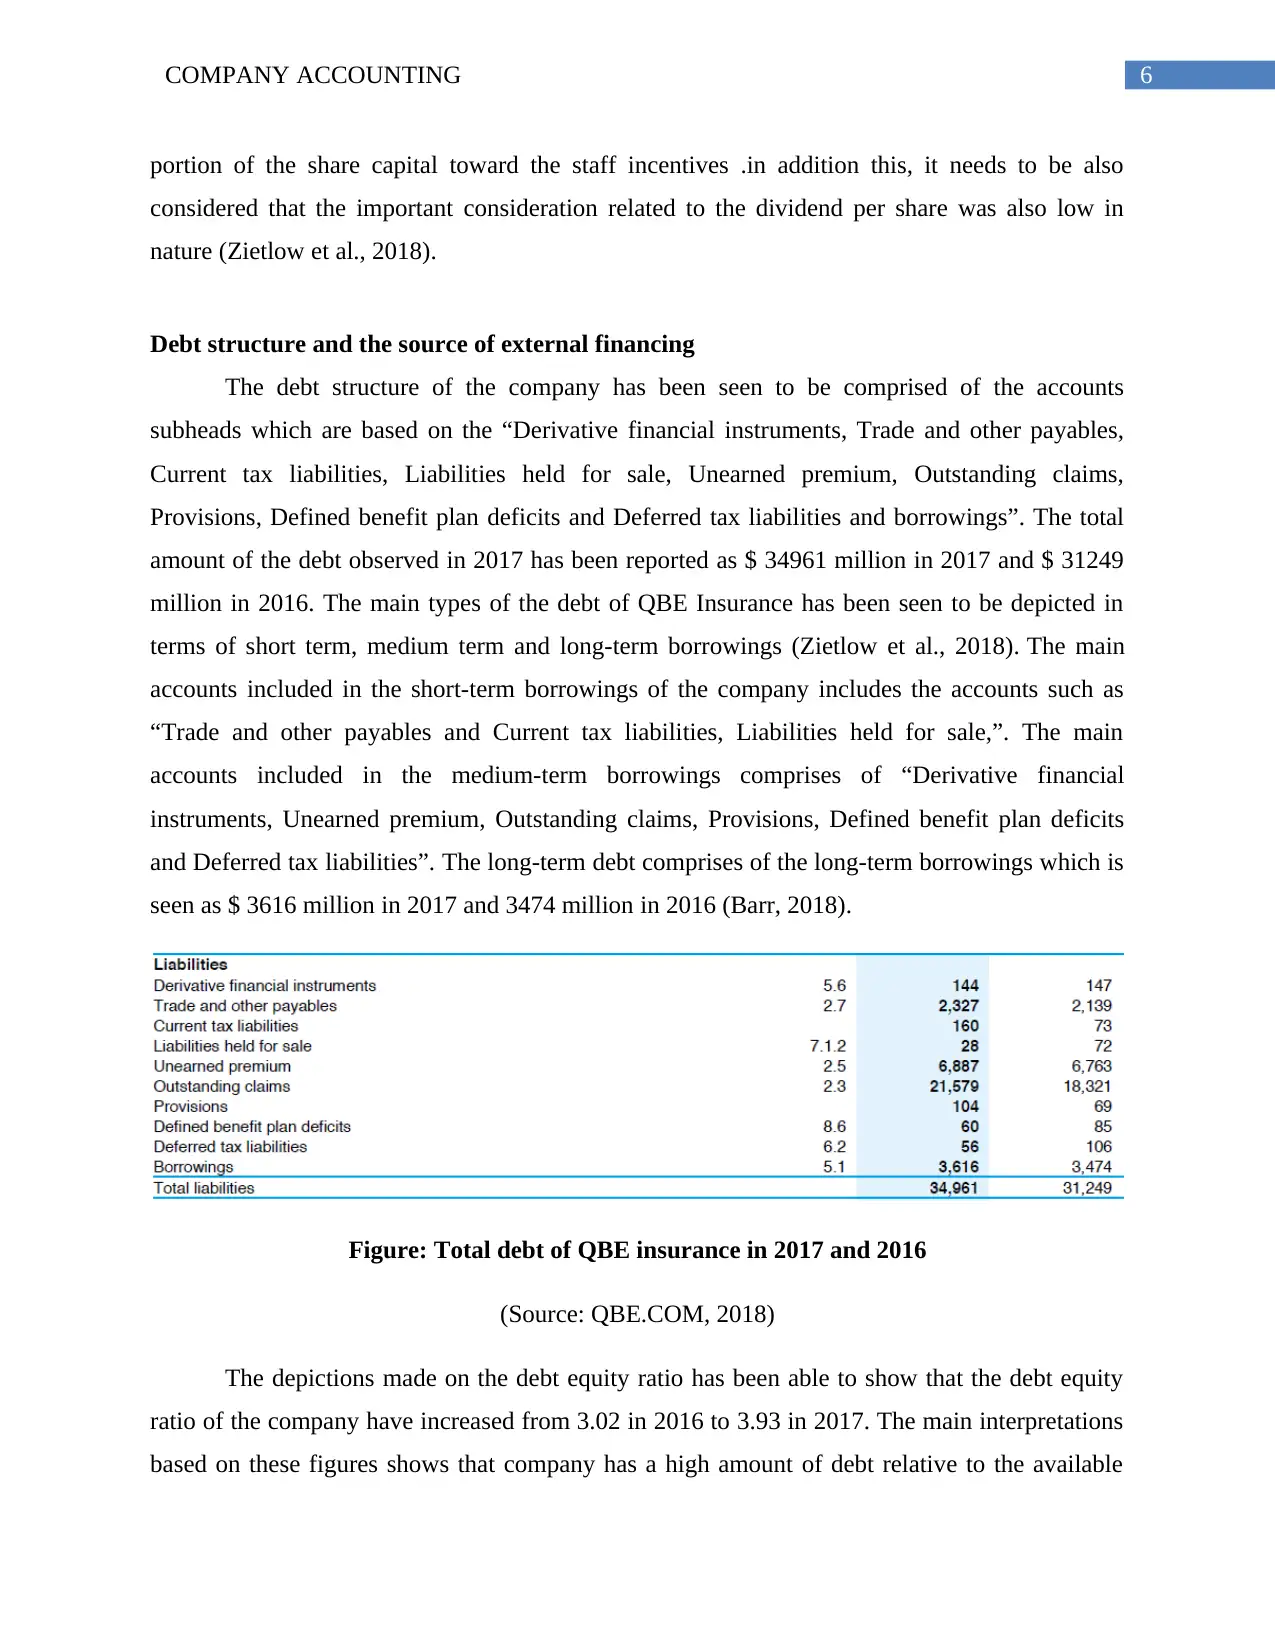
Debt structure and the source of external financing
The debt structure of the company has been seen to be comprised of the accounts
subheads which are based on the “Derivative financial instruments, Trade and other payables,
Current tax liabilities, Liabilities held for sale, Unearned premium, Outstanding claims,
Provisions, Defined benefit plan deficits and Deferred tax liabilities and borrowings”. The total
amount of the debt observed in 2017 has been reported as $ 34961 million in 2017 and $ 31249
million in 2016. The main types of the debt of QBE Insurance has been seen to be depicted in
terms of short term, medium term and long-term borrowings (Zietlow et al., 2018). The main
accounts included in the short-term borrowings of the company includes the accounts such as
“Trade and other payables and Current tax liabilities, Liabilities held for sale,”. The main
accounts included in the medium-term borrowings comprises of “Derivative financial
instruments, Unearned premium, Outstanding claims, Provisions, Defined benefit plan deficits
and Deferred tax liabilities”. The long-term debt comprises of the long-term borrowings which is
seen as $ 3616 million in 2017 and 3474 million in 2016 (Barr, 2018).
Figure: Total debt of QBE insurance in 2017 and 2016
(Source: QBE.COM, 2018)
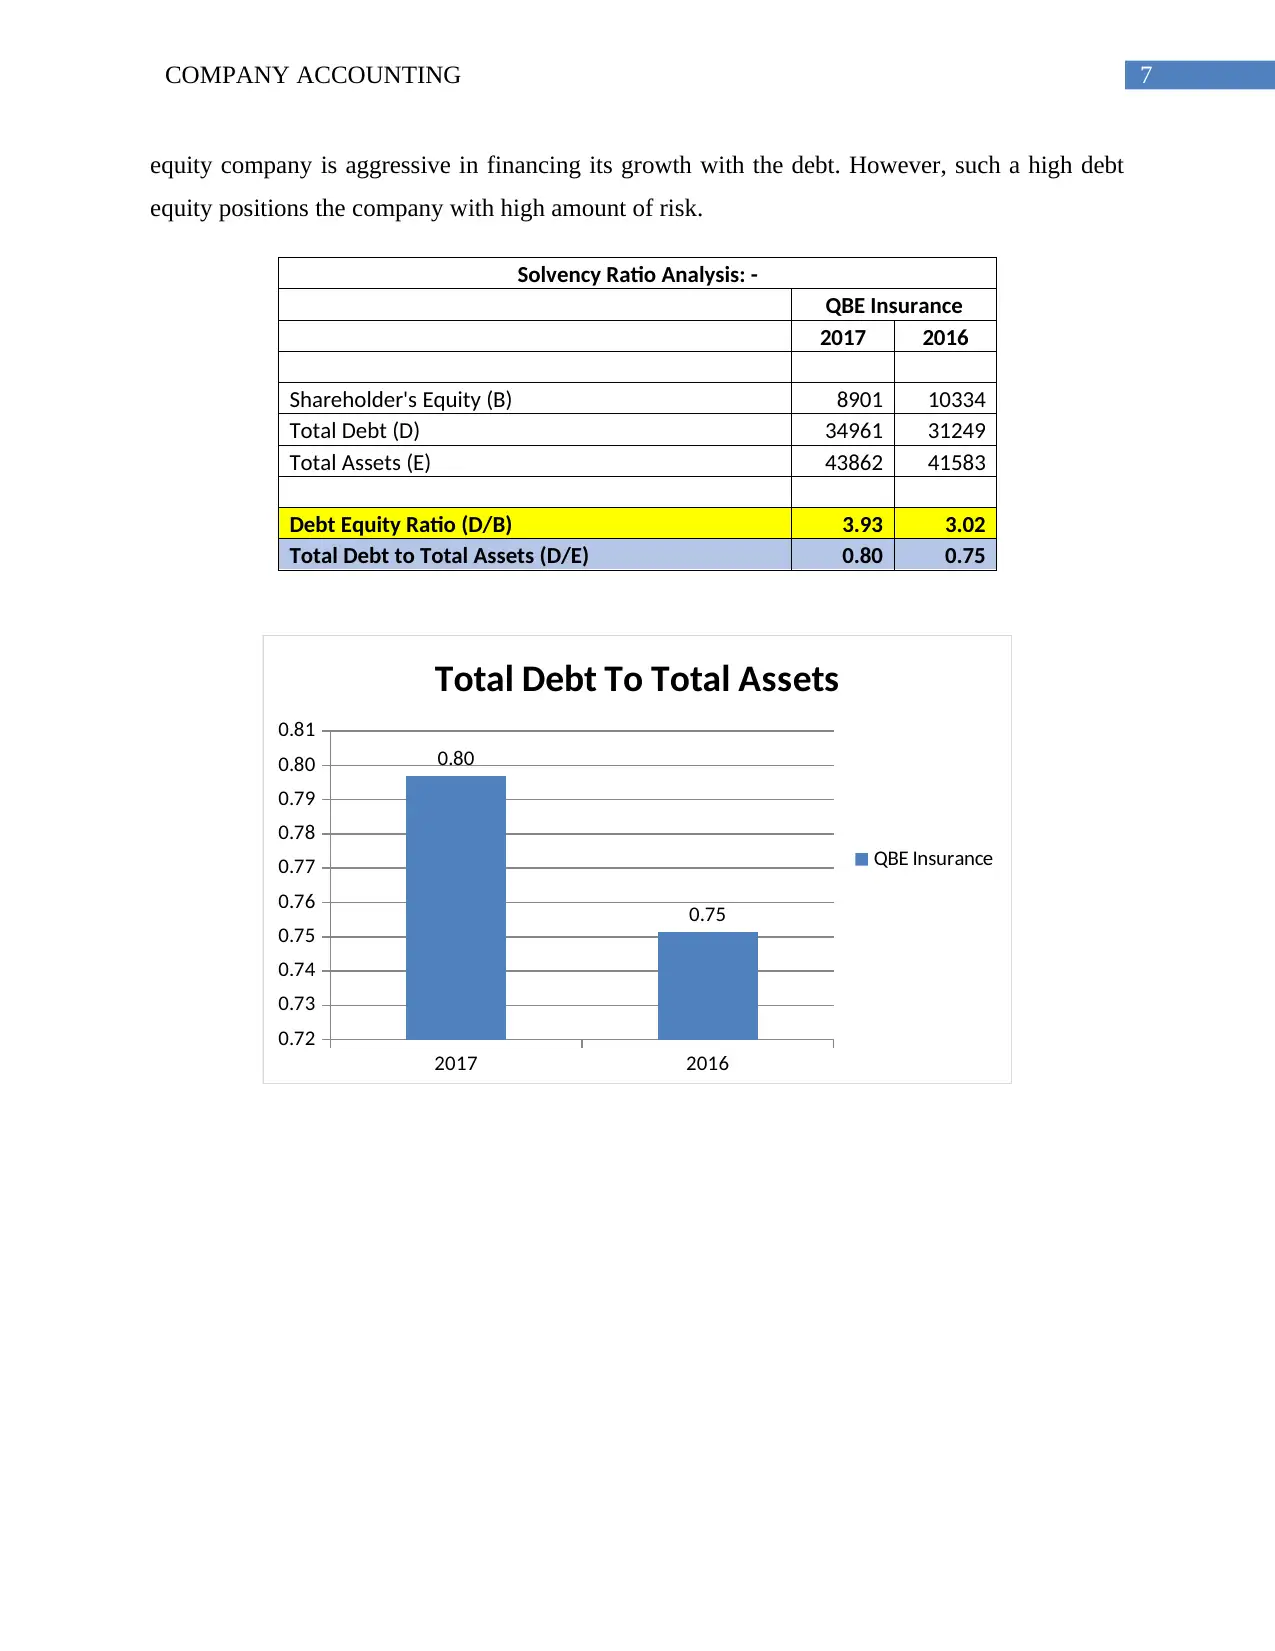
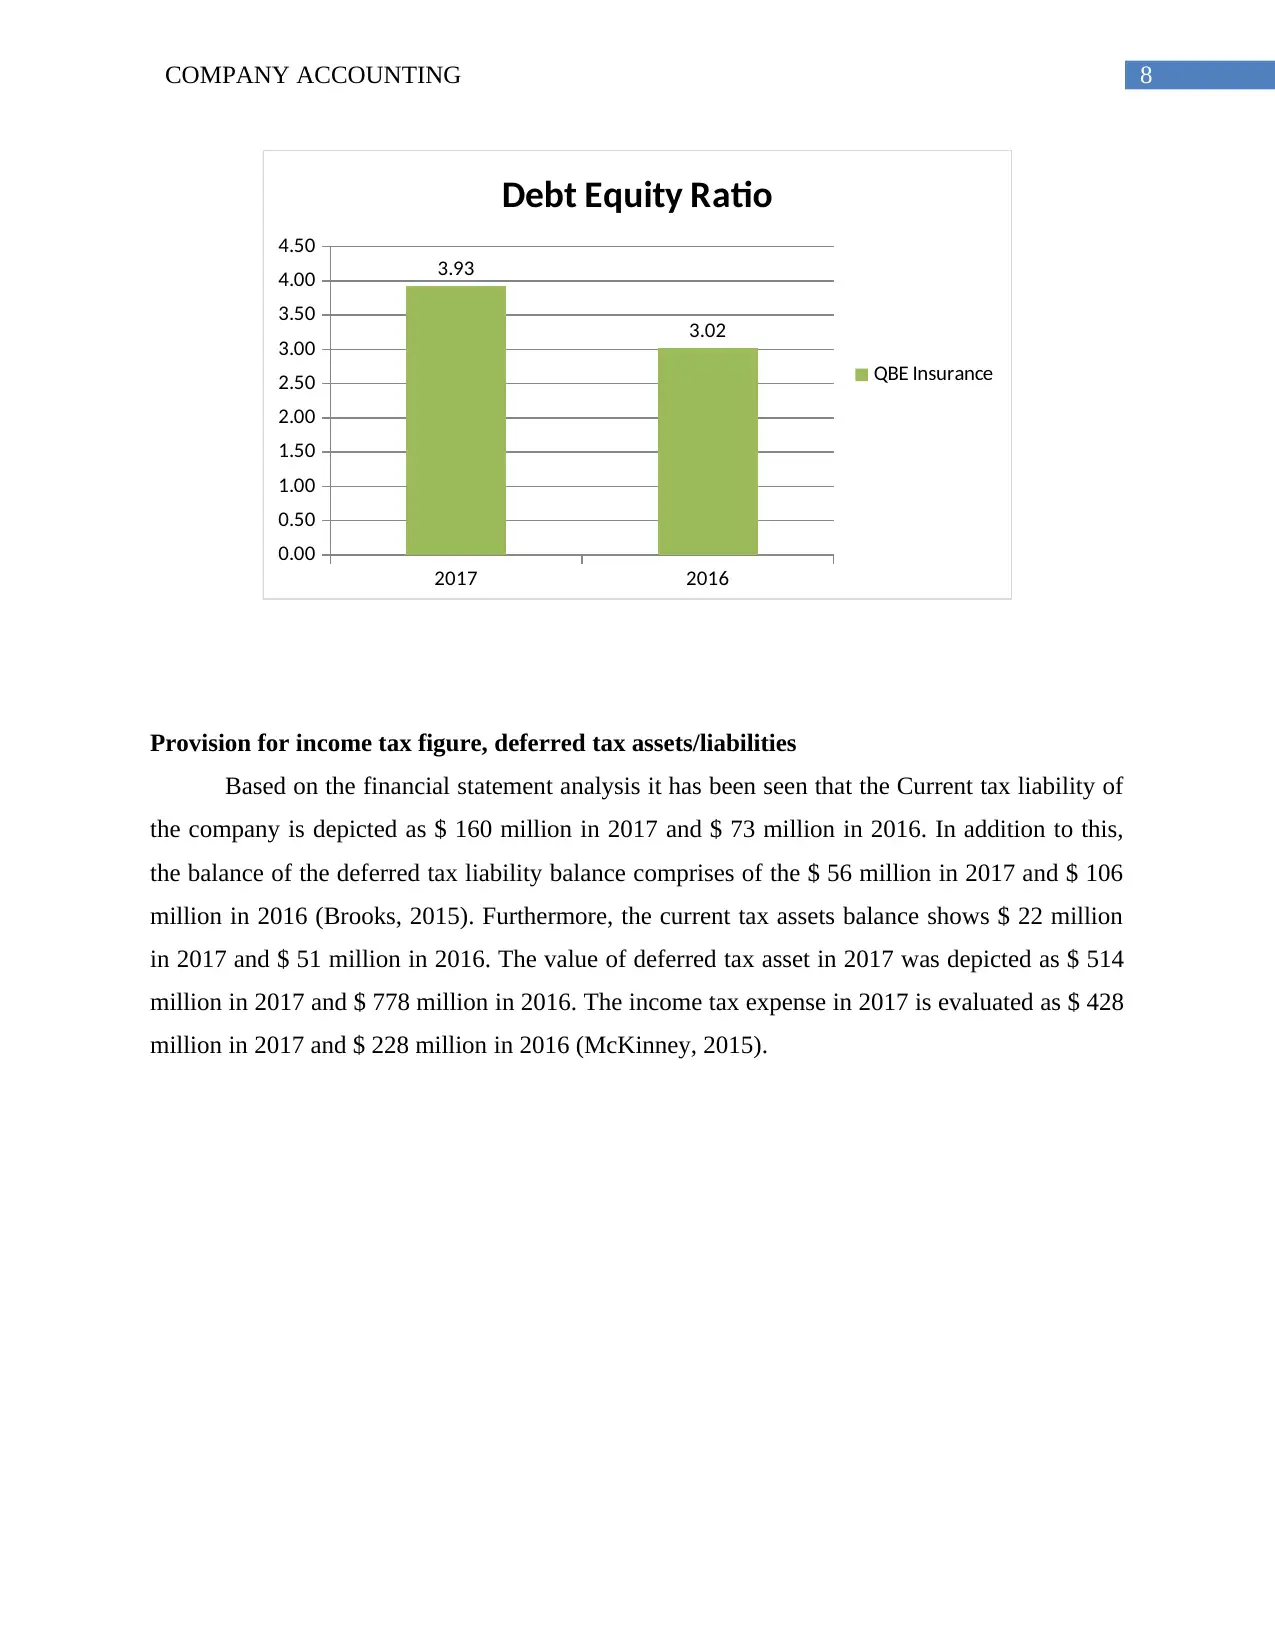
The depictions made on the debt equity ratio has been able to show that the debt equity
ratio of the company have increased from 3.02 in 2016 to 3.93 in 2017. The main interpretations
based on these figures shows that company has a high amount of debt relative to the available
portion of the share capital toward the staff incentives .in addition this, it needs to be also
considered that the important consideration related to the dividend per share was also low in
nature (Zietlow et al., 2018).
Debt structure and the source of external financing
The debt structure of the company has been seen to be comprised of the accounts
subheads which are based on the “Derivative financial instruments, Trade and other payables,
Current tax liabilities, Liabilities held for sale, Unearned premium, Outstanding claims,
Provisions, Defined benefit plan deficits and Deferred tax liabilities and borrowings”. The total
amount of the debt observed in 2017 has been reported as $ 34961 million in 2017 and $ 31249
million in 2016. The main types of the debt of QBE Insurance has been seen to be depicted in
terms of short term, medium term and long-term borrowings (Zietlow et al., 2018). The main
accounts included in the short-term borrowings of the company includes the accounts such as
“Trade and other payables and Current tax liabilities, Liabilities held for sale,”. The main
accounts included in the medium-term borrowings comprises of “Derivative financial
instruments, Unearned premium, Outstanding claims, Provisions, Defined benefit plan deficits
and Deferred tax liabilities”. The long-term debt comprises of the long-term borrowings which is
seen as $ 3616 million in 2017 and 3474 million in 2016 (Barr, 2018).
Figure: Total debt of QBE insurance in 2017 and 2016
(Source: QBE.COM, 2018)
The depictions made on the debt equity ratio has been able to show that the debt equity
ratio of the company have increased from 3.02 in 2016 to 3.93 in 2017. The main interpretations
based on these figures shows that company has a high amount of debt relative to the available
Paraphrase This Document
Need a fresh take? Get an instant paraphrase of this document with our AI Paraphraser
7COMPANY ACCOUNTING
equity company is aggressive in financing its growth with the debt. However, such a high debt
equity positions the company with high amount of risk.
Solvency Ratio Analysis: -
QBE Insurance
2017 2016
Shareholder's Equity (B) 8901 10334
Total Debt (D) 34961 31249
Total Assets (E) 43862 41583
Debt Equity Ratio (D/B) 3.93 3.02
Total Debt to Total Assets (D/E) 0.80 0.75
2017 2016
0.72
0.73
0.74
0.75
0.76
0.77
0.78
0.79
0.80
0.81
0.80
0.75
Total Debt To Total Assets
QBE Insurance
8COMPANY ACCOUNTING
2017 2016
0.00
0.50
1.00
1.50
2.00
2.50
3.00
3.50
4.00
4.50
3.93
3.02
Debt Equity Ratio
QBE Insurance
Provision for income tax figure, deferred tax assets/liabilities
Based on the financial statement analysis it has been seen that the Current tax liability of
the company is depicted as $ 160 million in 2017 and $ 73 million in 2016. In addition to this,
the balance of the deferred tax liability balance comprises of the $ 56 million in 2017 and $ 106
million in 2016 (Brooks, 2015). Furthermore, the current tax assets balance shows $ 22 million
in 2017 and $ 51 million in 2016. The value of deferred tax asset in 2017 was depicted as $ 514
million in 2017 and $ 778 million in 2016. The income tax expense in 2017 is evaluated as $ 428
million in 2017 and $ 228 million in 2016 (McKinney, 2015).
9COMPANY ACCOUNTING
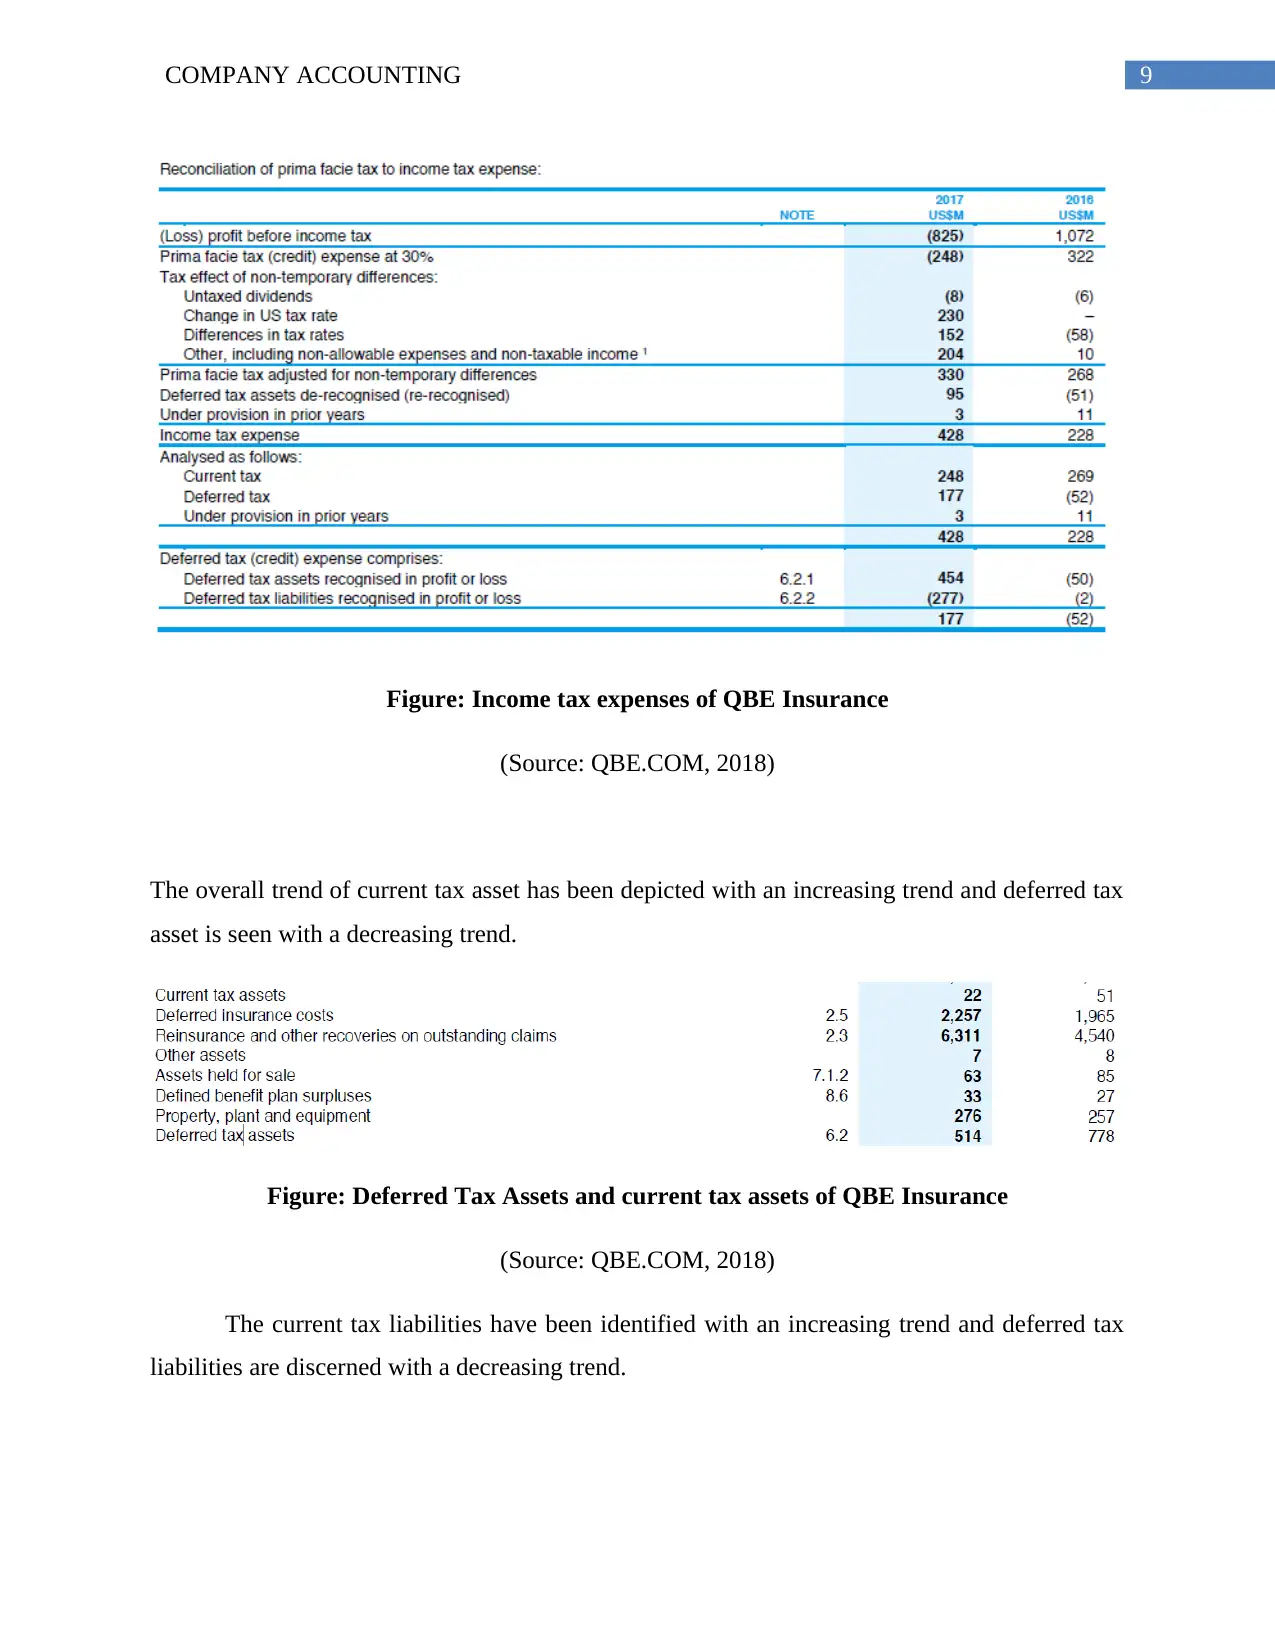
Figure: Income tax expenses of QBE Insurance
(Source: QBE.COM, 2018)
The overall trend of current tax asset has been depicted with an increasing trend and deferred tax
asset is seen with a decreasing trend.
Figure: Deferred Tax Assets and current tax assets of QBE Insurance
(Source: QBE.COM, 2018)
The current tax liabilities have been identified with an increasing trend and deferred tax
liabilities are discerned with a decreasing trend.
Secure Best Marks with AI Grader
Need help grading? Try our AI Grader for instant feedback on your assignments.
10COMPANY ACCOUNTING
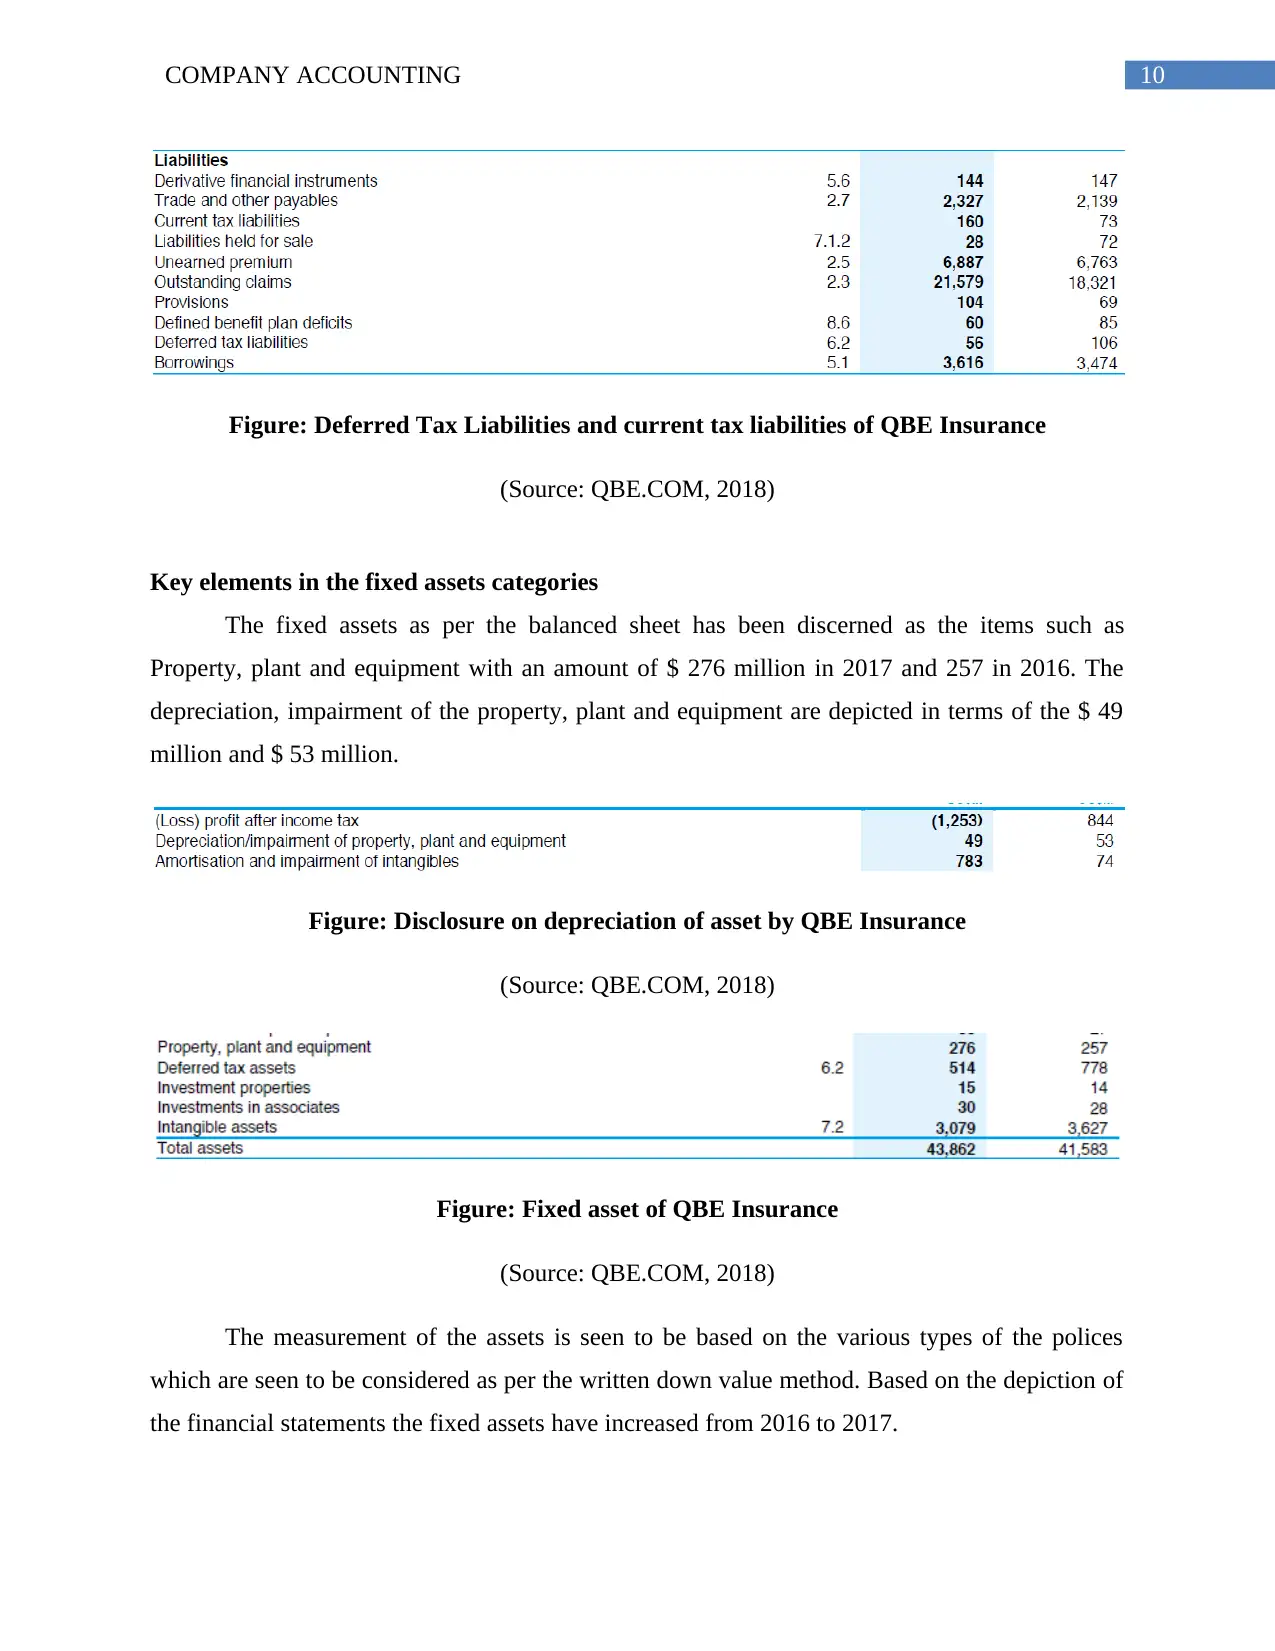
Figure: Deferred Tax Liabilities and current tax liabilities of QBE Insurance
(Source: QBE.COM, 2018)
Key elements in the fixed assets categories
The fixed assets as per the balanced sheet has been discerned as the items such as
Property, plant and equipment with an amount of $ 276 million in 2017 and 257 in 2016. The
depreciation, impairment of the property, plant and equipment are depicted in terms of the $ 49
million and $ 53 million.
Figure: Disclosure on depreciation of asset by QBE Insurance
(Source: QBE.COM, 2018)
Figure: Fixed asset of QBE Insurance
(Source: QBE.COM, 2018)
The measurement of the assets is seen to be based on the various types of the polices
which are seen to be considered as per the written down value method. Based on the depiction of
the financial statements the fixed assets have increased from 2016 to 2017.
11COMPANY ACCOUNTING
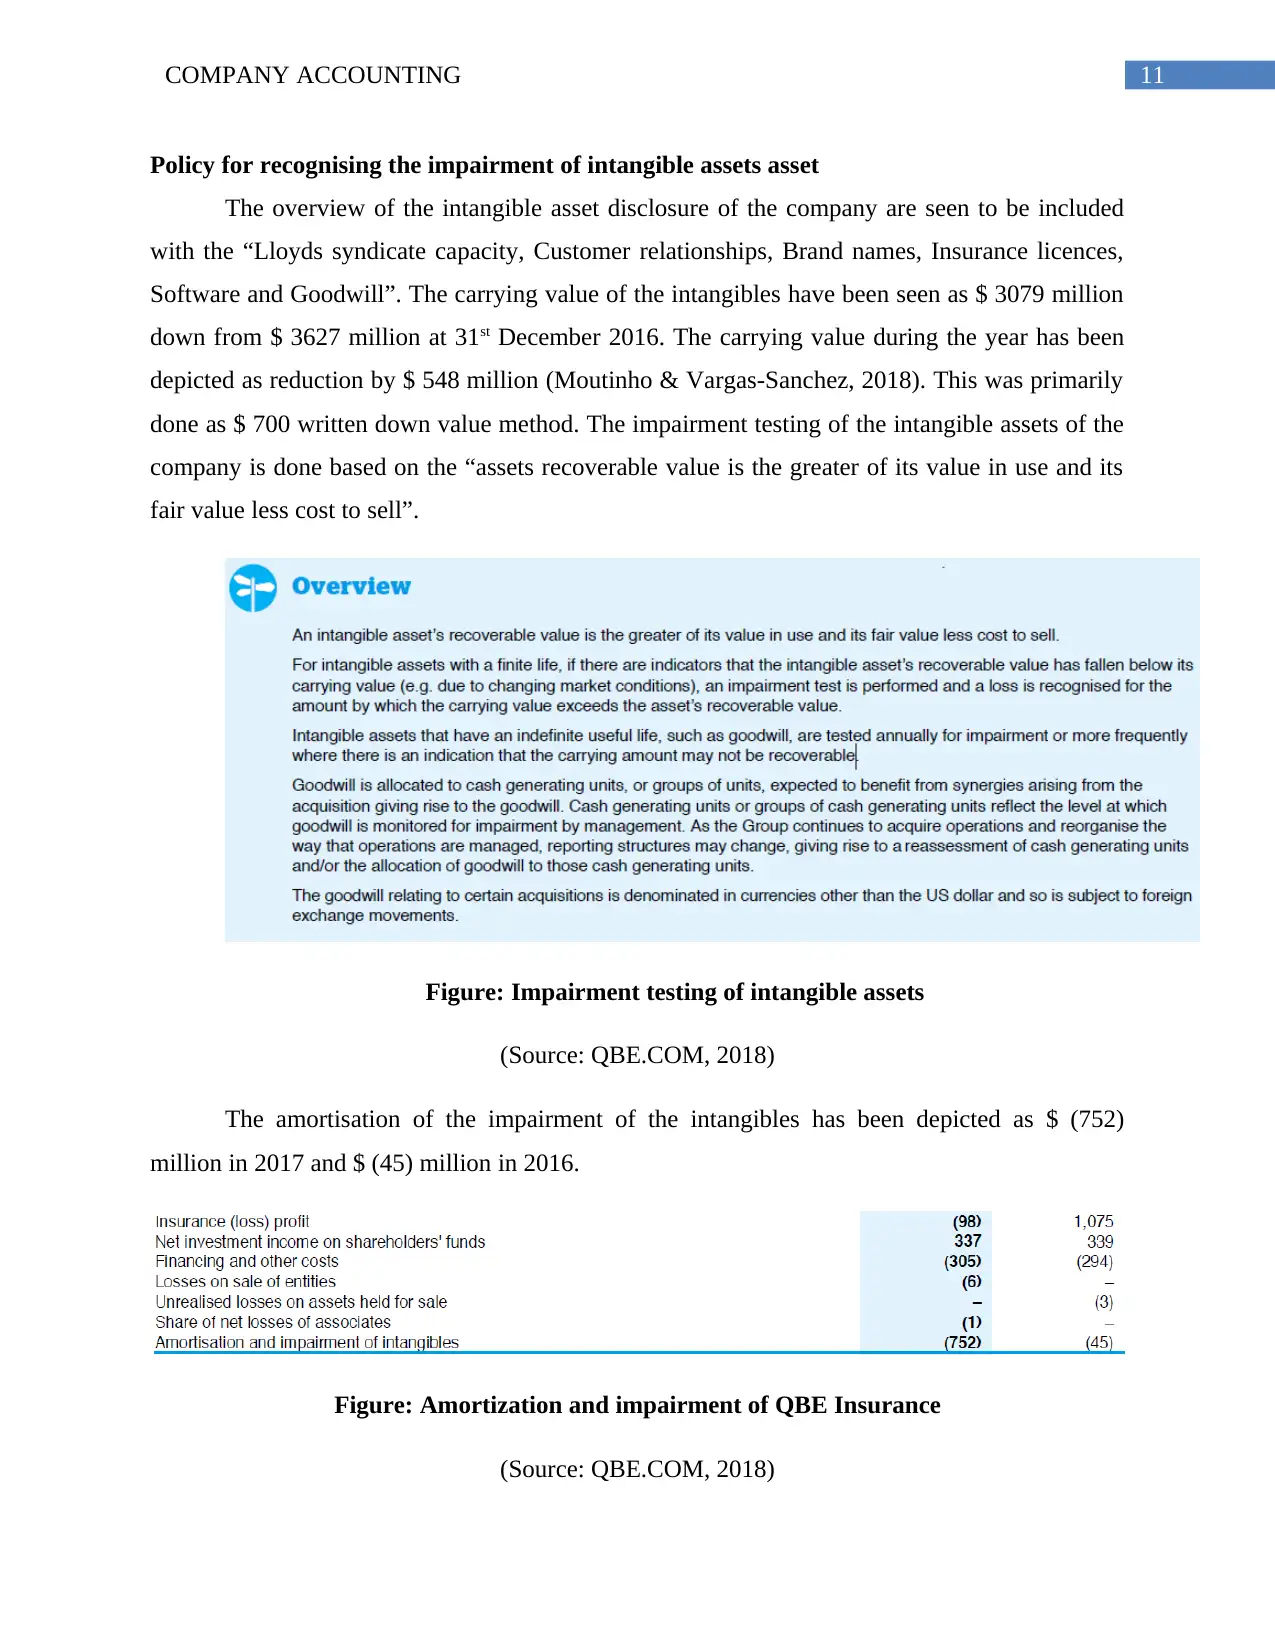
Policy for recognising the impairment of intangible assets asset
The overview of the intangible asset disclosure of the company are seen to be included
with the “Lloyds syndicate capacity, Customer relationships, Brand names, Insurance licences,
Software and Goodwill”. The carrying value of the intangibles have been seen as $ 3079 million
down from $ 3627 million at 31st December 2016. The carrying value during the year has been
depicted as reduction by $ 548 million (Moutinho & Vargas-Sanchez, 2018). This was primarily
done as $ 700 written down value method. The impairment testing of the intangible assets of the
company is done based on the “assets recoverable value is the greater of its value in use and its
fair value less cost to sell”.
Figure: Impairment testing of intangible assets
(Source: QBE.COM, 2018)
The amortisation of the impairment of the intangibles has been depicted as $ (752)
million in 2017 and $ (45) million in 2016.
Figure: Amortization and impairment of QBE Insurance
(Source: QBE.COM, 2018)
12COMPANY ACCOUNTING
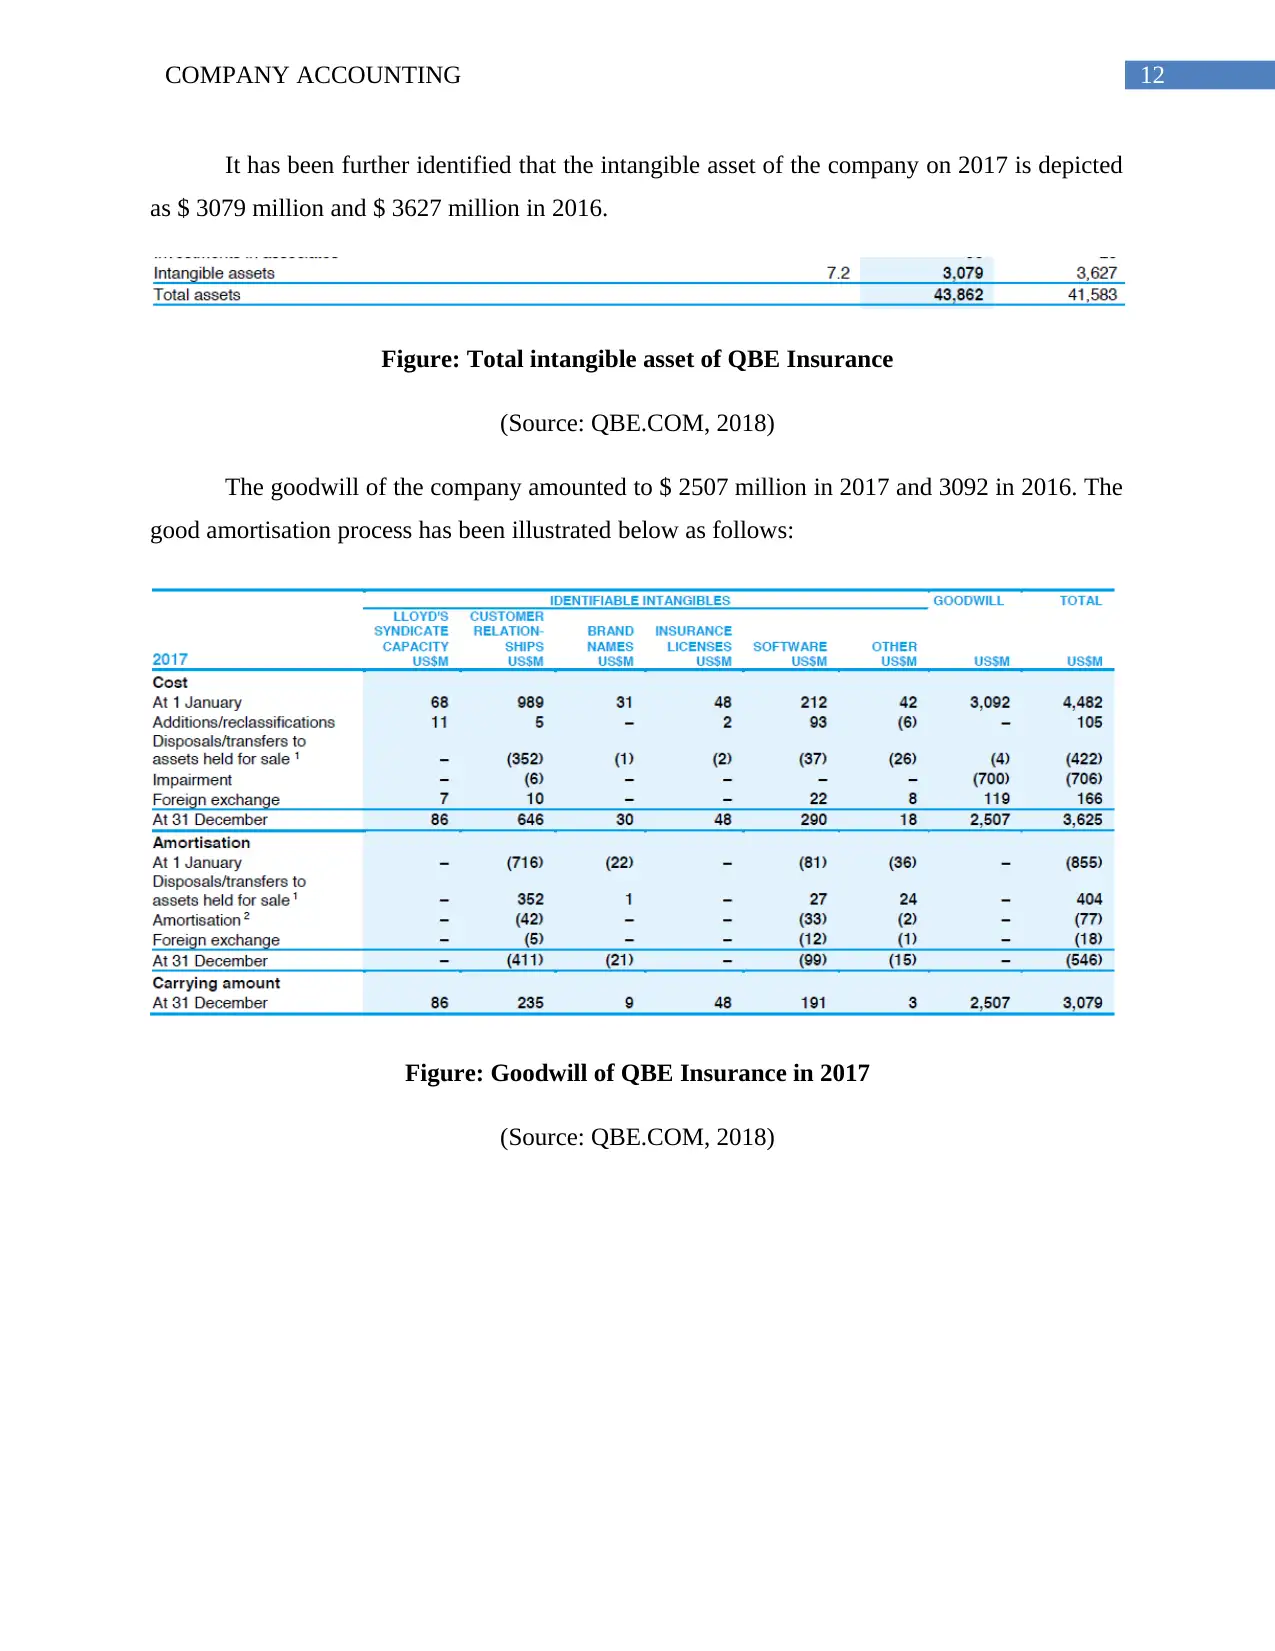
It has been further identified that the intangible asset of the company on 2017 is depicted
as $ 3079 million and $ 3627 million in 2016.
Figure: Total intangible asset of QBE Insurance
(Source: QBE.COM, 2018)
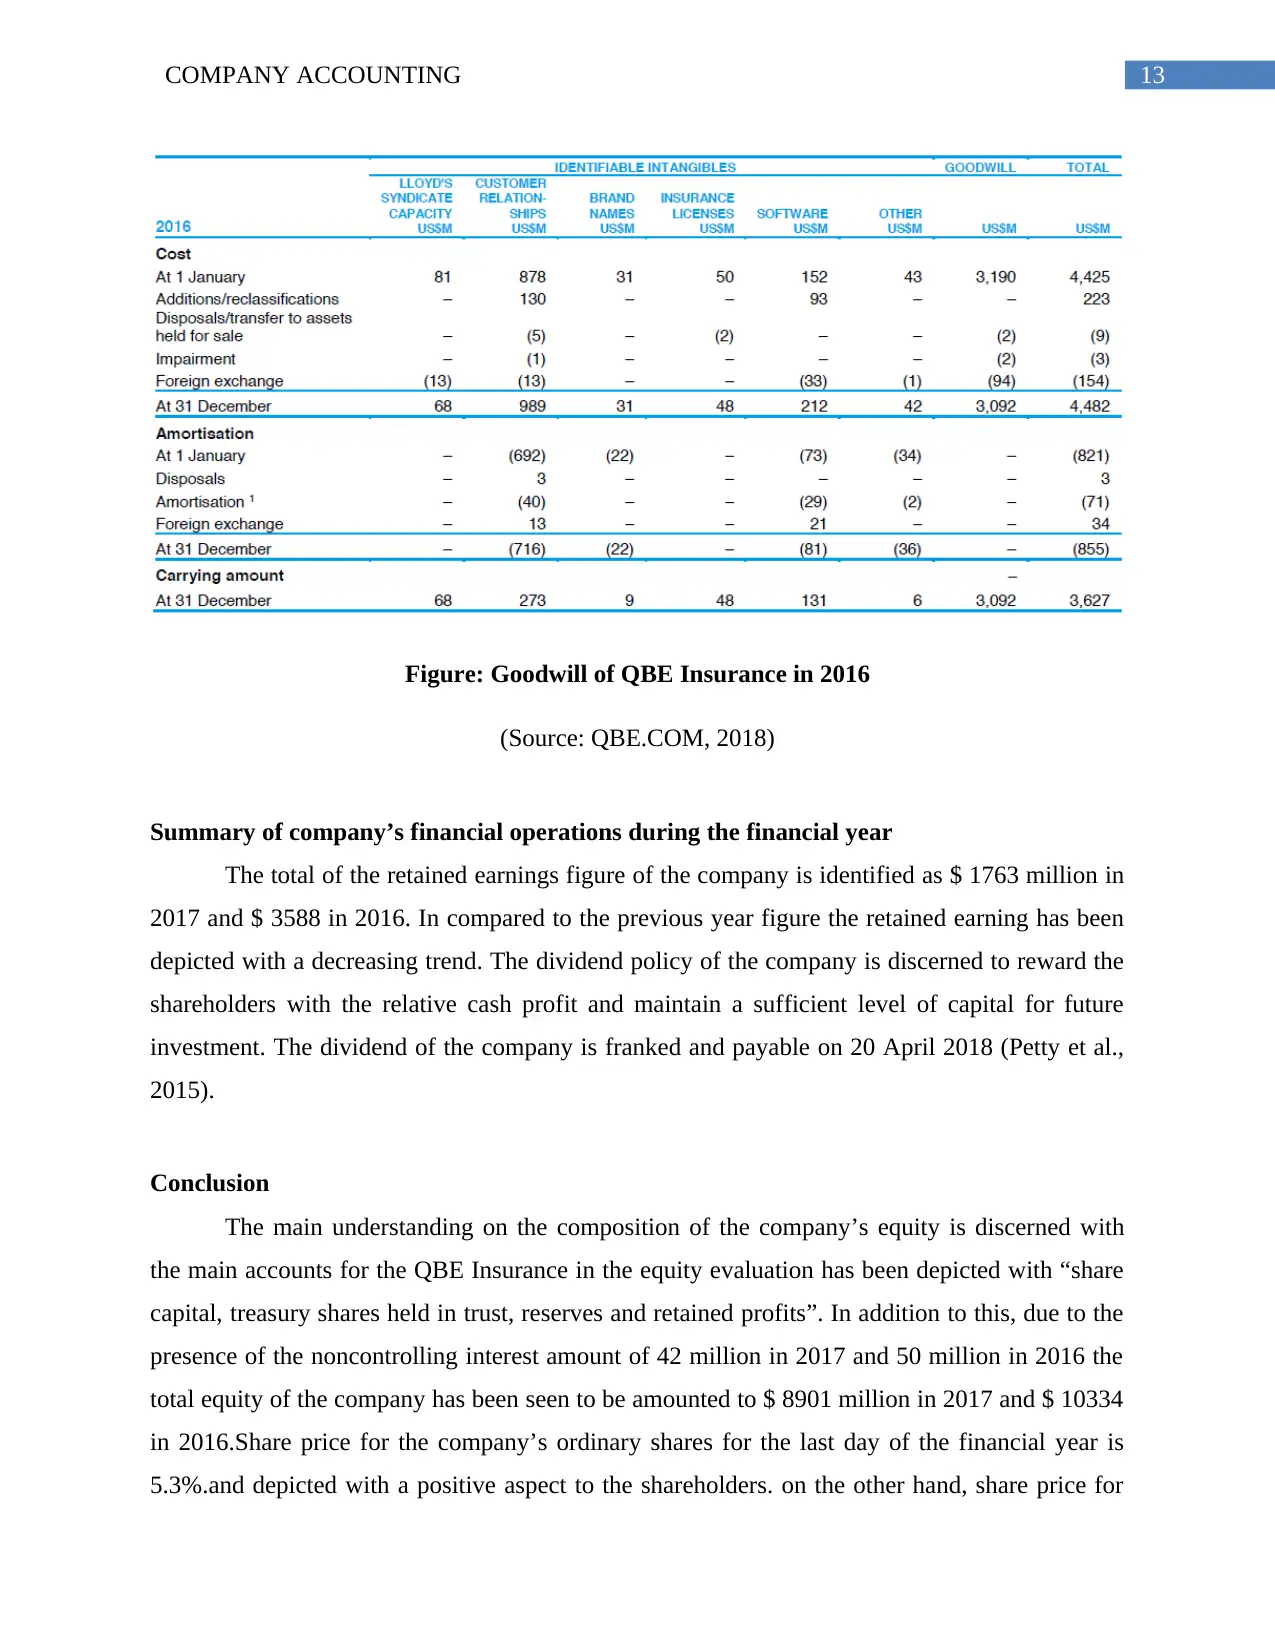
The goodwill of the company amounted to $ 2507 million in 2017 and 3092 in 2016. The
good amortisation process has been illustrated below as follows:
Figure: Goodwill of QBE Insurance in 2017
(Source: QBE.COM, 2018)
It has been further identified that the intangible asset of the company on 2017 is depicted
as $ 3079 million and $ 3627 million in 2016.
Figure: Total intangible asset of QBE Insurance
(Source: QBE.COM, 2018)
The goodwill of the company amounted to $ 2507 million in 2017 and 3092 in 2016. The
good amortisation process has been illustrated below as follows:
Figure: Goodwill of QBE Insurance in 2017
(Source: QBE.COM, 2018)
Paraphrase This Document
Need a fresh take? Get an instant paraphrase of this document with our AI Paraphraser
13COMPANY ACCOUNTING
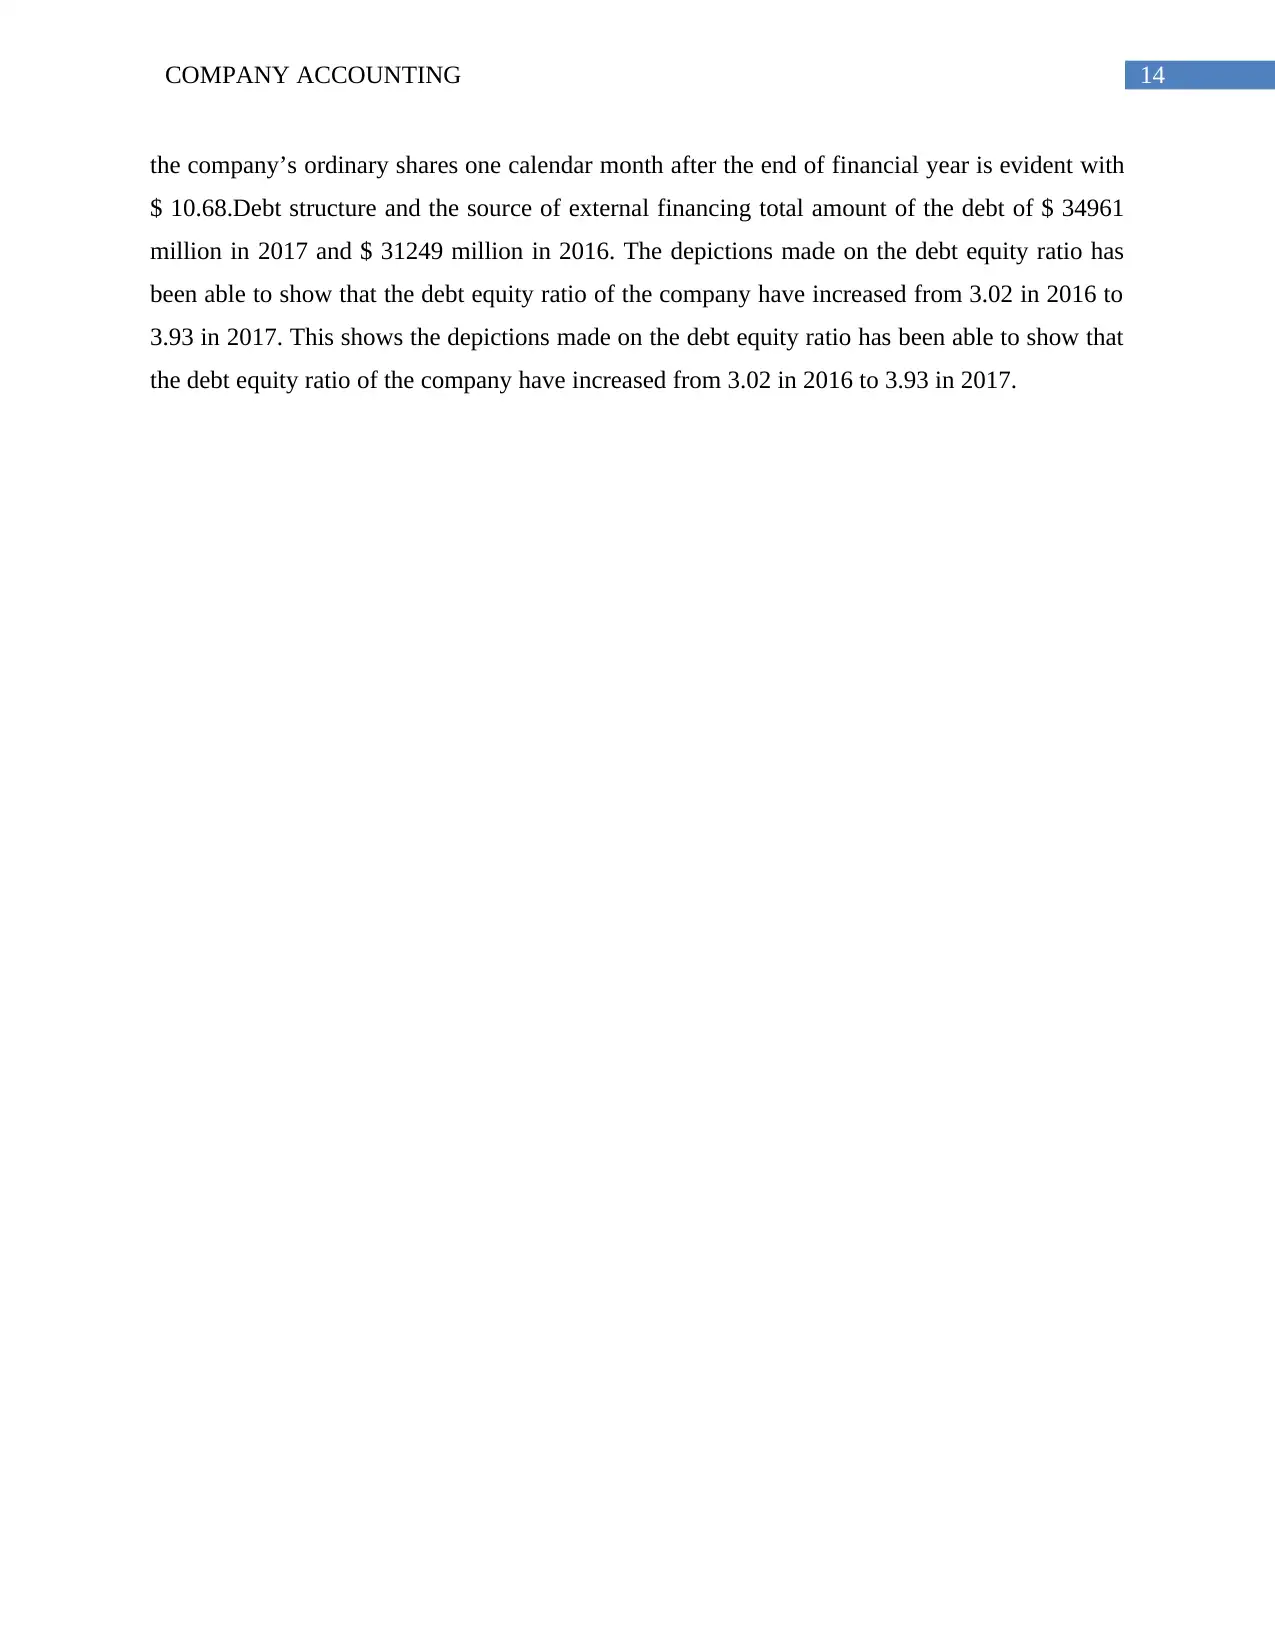
Figure: Goodwill of QBE Insurance in 2016
(Source: QBE.COM, 2018)
Summary of company’s financial operations during the financial year
The total of the retained earnings figure of the company is identified as $ 1763 million in
2017 and $ 3588 in 2016. In compared to the previous year figure the retained earning has been
depicted with a decreasing trend. The dividend policy of the company is discerned to reward the
shareholders with the relative cash profit and maintain a sufficient level of capital for future
investment. The dividend of the company is franked and payable on 20 April 2018 (Petty et al.,
2015).
Conclusion
The main understanding on the composition of the company’s equity is discerned with
the main accounts for the QBE Insurance in the equity evaluation has been depicted with “share
capital, treasury shares held in trust, reserves and retained profits”. In addition to this, due to the
presence of the noncontrolling interest amount of 42 million in 2017 and 50 million in 2016 the
total equity of the company has been seen to be amounted to $ 8901 million in 2017 and $ 10334
in 2016.Share price for the company’s ordinary shares for the last day of the financial year is
5.3%.and depicted with a positive aspect to the shareholders. on the other hand, share price for
14COMPANY ACCOUNTING
the company’s ordinary shares one calendar month after the end of financial year is evident with
$ 10.68.Debt structure and the source of external financing total amount of the debt of $ 34961
million in 2017 and $ 31249 million in 2016. The depictions made on the debt equity ratio has
been able to show that the debt equity ratio of the company have increased from 3.02 in 2016 to
3.93 in 2017. This shows the depictions made on the debt equity ratio has been able to show that
the debt equity ratio of the company have increased from 3.02 in 2016 to 3.93 in 2017.
15COMPANY ACCOUNTING
References
Barr, M. J. (2018). Budgets and financial management in higher education. John Wiley & Sons.
Barr, M. J. (2018). Budgets and financial management in higher education. John Wiley & Sons.
Brooks, R. (2015). Financial management: core concepts. Pearson
Finkler, S. A., Smith, D. L., Calabrese, T. D., & Purtell, R. M. (2016). Financial management
for public, health, and not-for-profit organizations. CQ Press.
Martin, L. L. (2016). Financial management for human service administrators. Waveland Press.
McKinney, J. B. (2015). Effective financial management in public and nonprofit agencies. ABC-
CLIO.
Moutinho, L., & Vargas-Sanchez, A. (Eds.). (2018). Strategic Management in Tourism, CABI
Tourism Texts. Cabi.
Pauw, J. C., Van der Linde, G. J. A., Fourie, D. J., & Visser, C. B. (2015). Managing public
money. Pearson Holdings Southern Africa.
Petty, J. W., Titman, S., Keown, A. J., Martin, P., Martin, J. D., & Burrow, M. (2015). Financial
management: Principles and applications. Pearson Higher Education AU.
QBE.COM. (2018). 2017 Annual Report. Retrieved 11 May 2018, from
https://www.group.qbe.com/reportpresentation/2017-annual-report
Renz, D. O., & Herman, R. D. (Eds.). (2016). The Jossey-Bass handbook of nonprofit leadership
and management. John Wiley & Sons.
Titman, S., Keown, A. J., & Martin, J. D. (2017). Financial management: Principles and
applications. Pearson.
Zietlow, J., Hankin, J. A., Seidner, A., & O'Brien, T. (2018). Financial management for
nonprofit organizations: Policies and practices. John Wiley & Sons.
1 out of 16
Related Documents


Your All-in-One AI-Powered Toolkit for Academic Success.
+13062052269
info@desklib.com
Available 24*7 on WhatsApp / Email
![[object Object]](/_next/static/media/star-bottom.7253800d.svg)
Unlock your academic potential
© 2024 | Zucol Services PVT LTD | All rights reserved.