Financial Performance Analysis of Company L - 2013 Report
VerifiedAdded on 2022/11/13
|12
|360
|55
Report
AI Summary
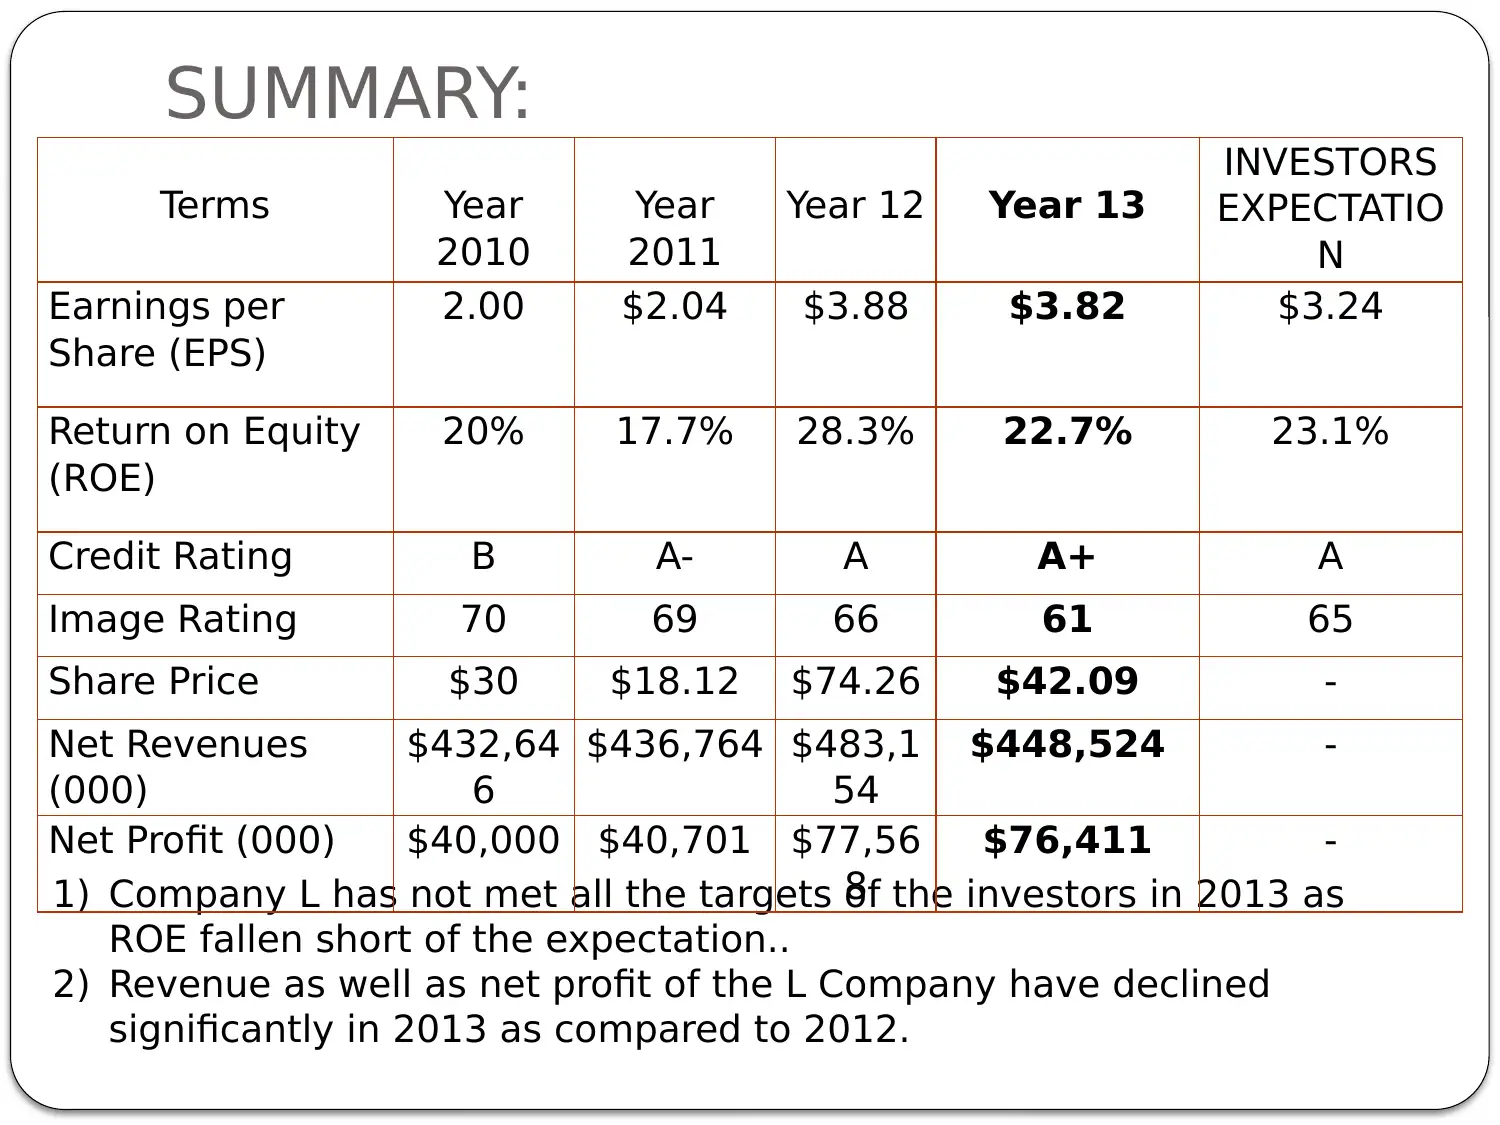
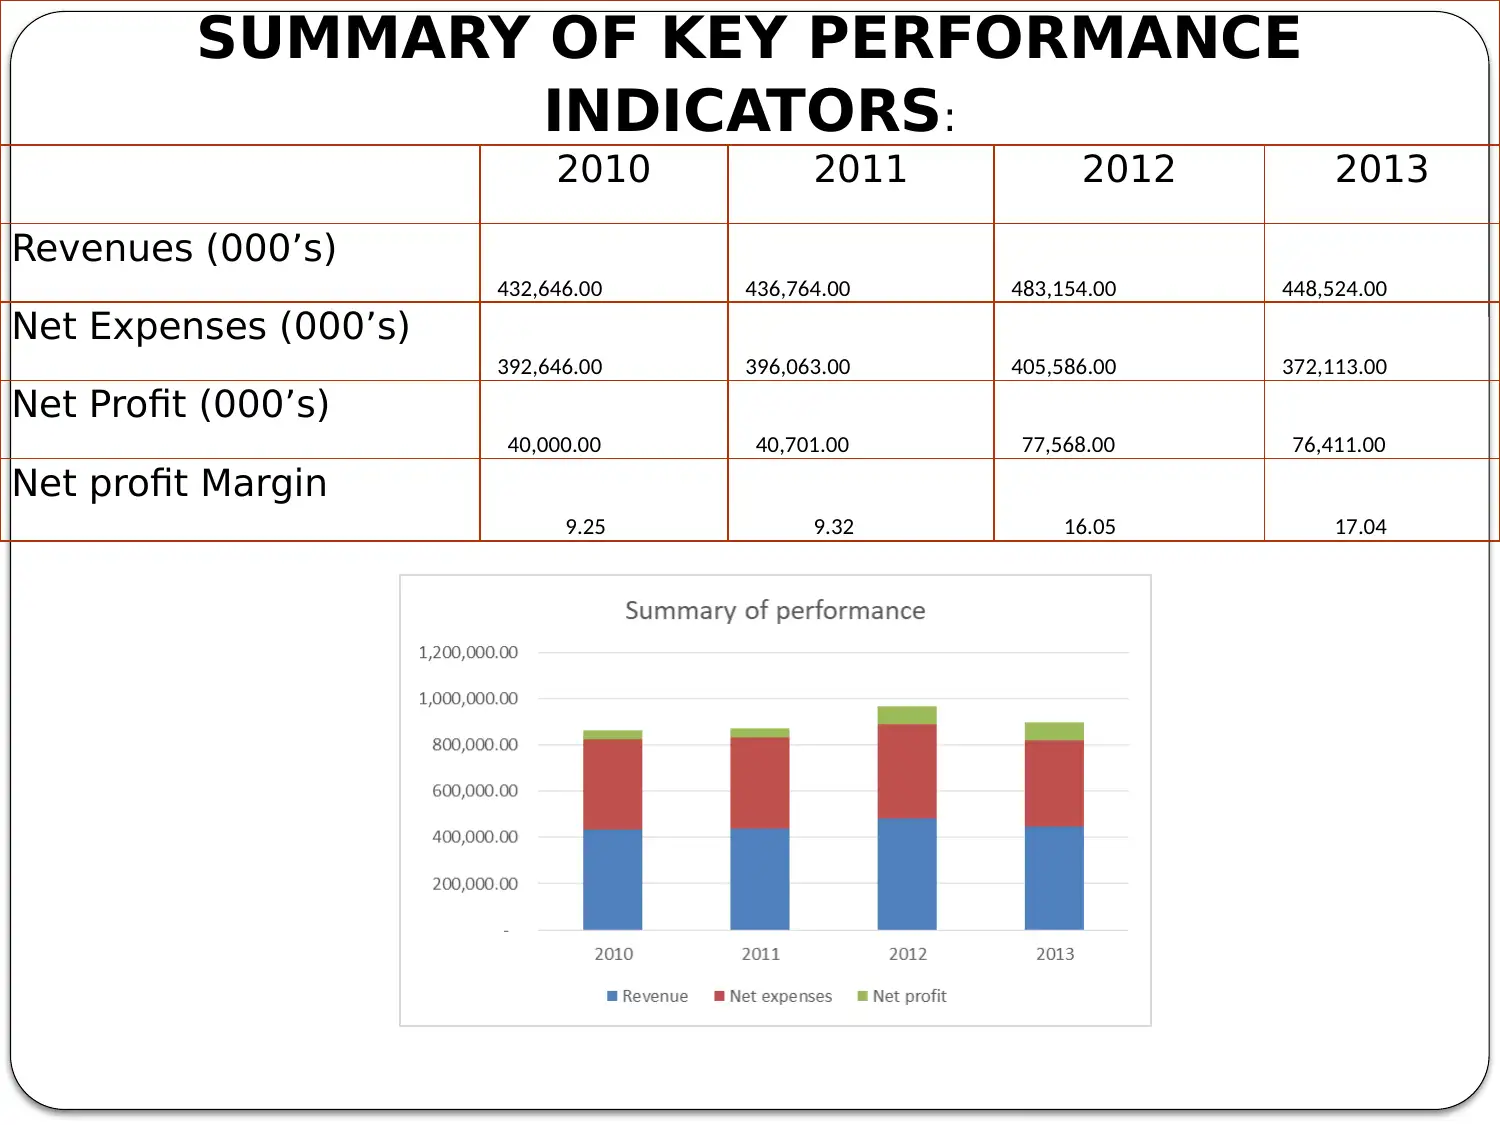
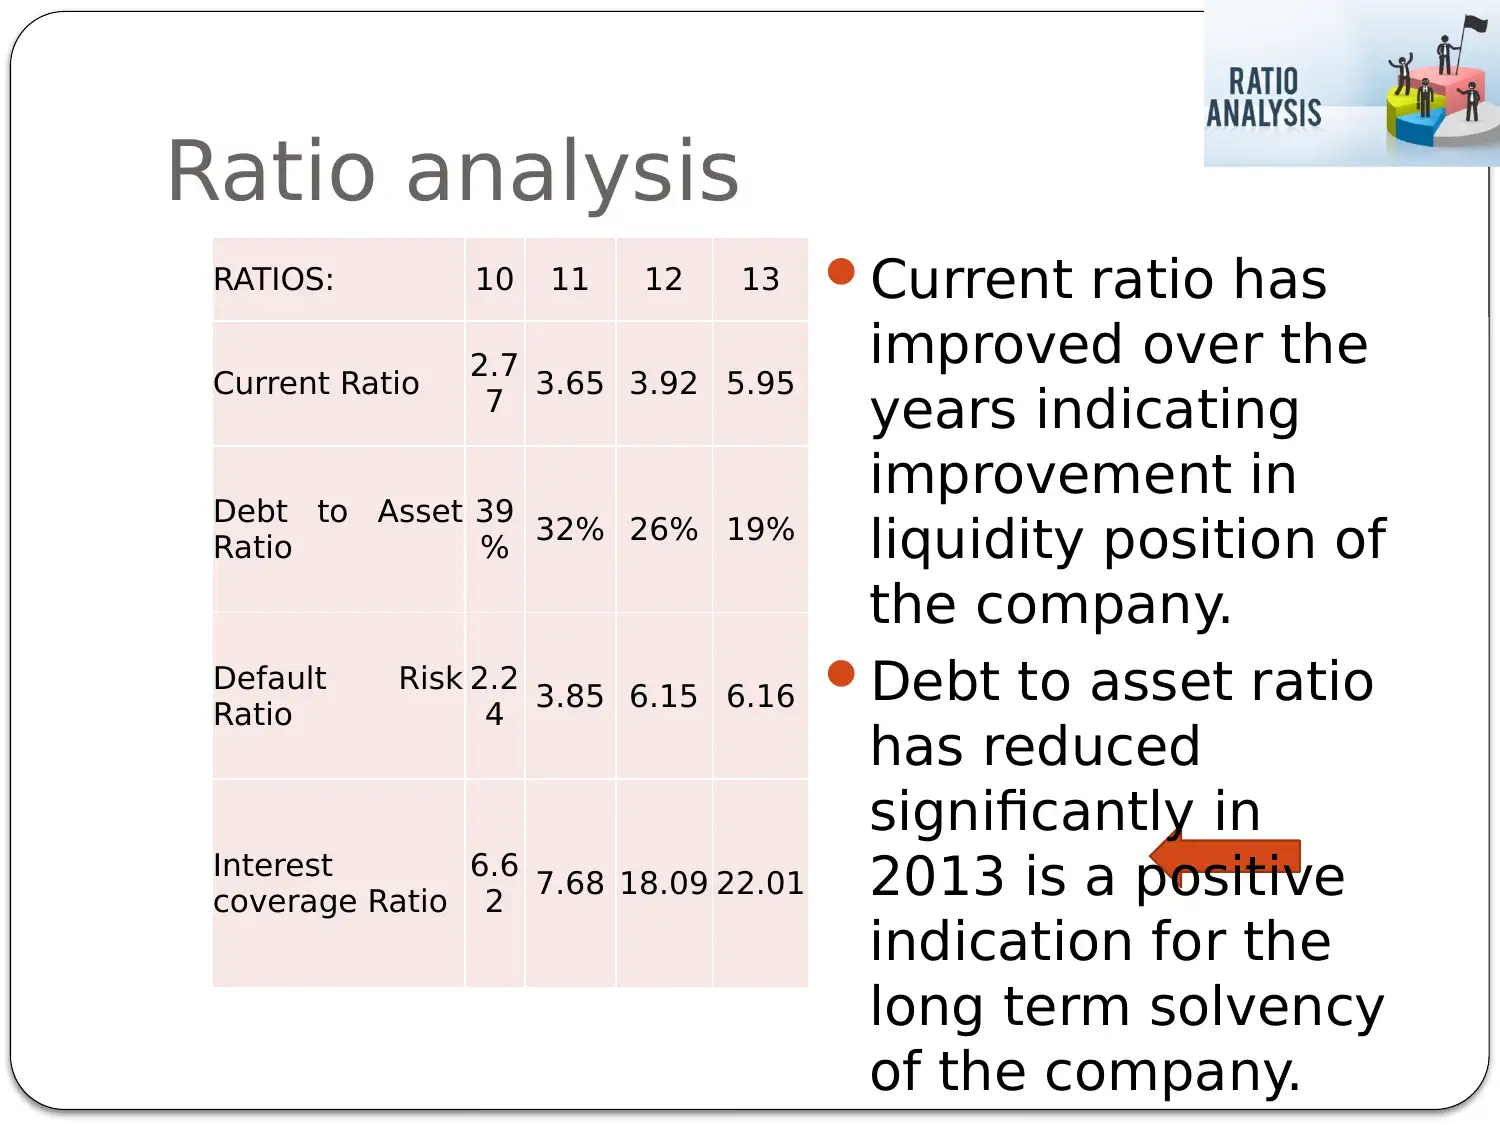
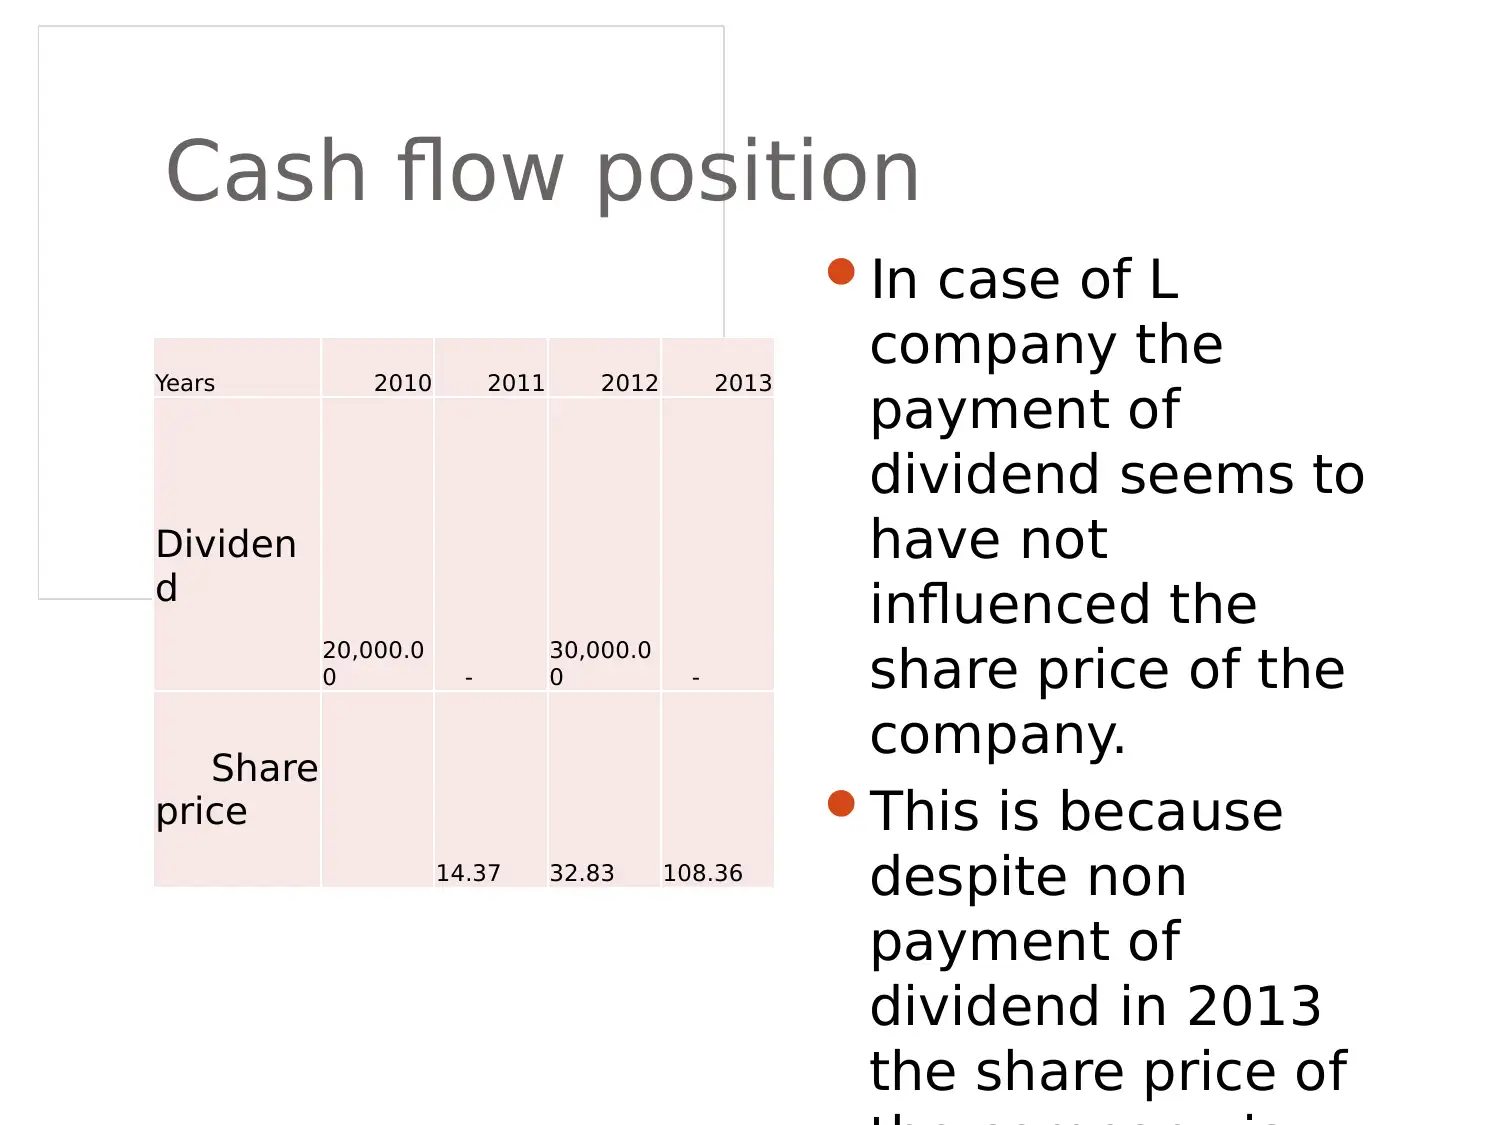
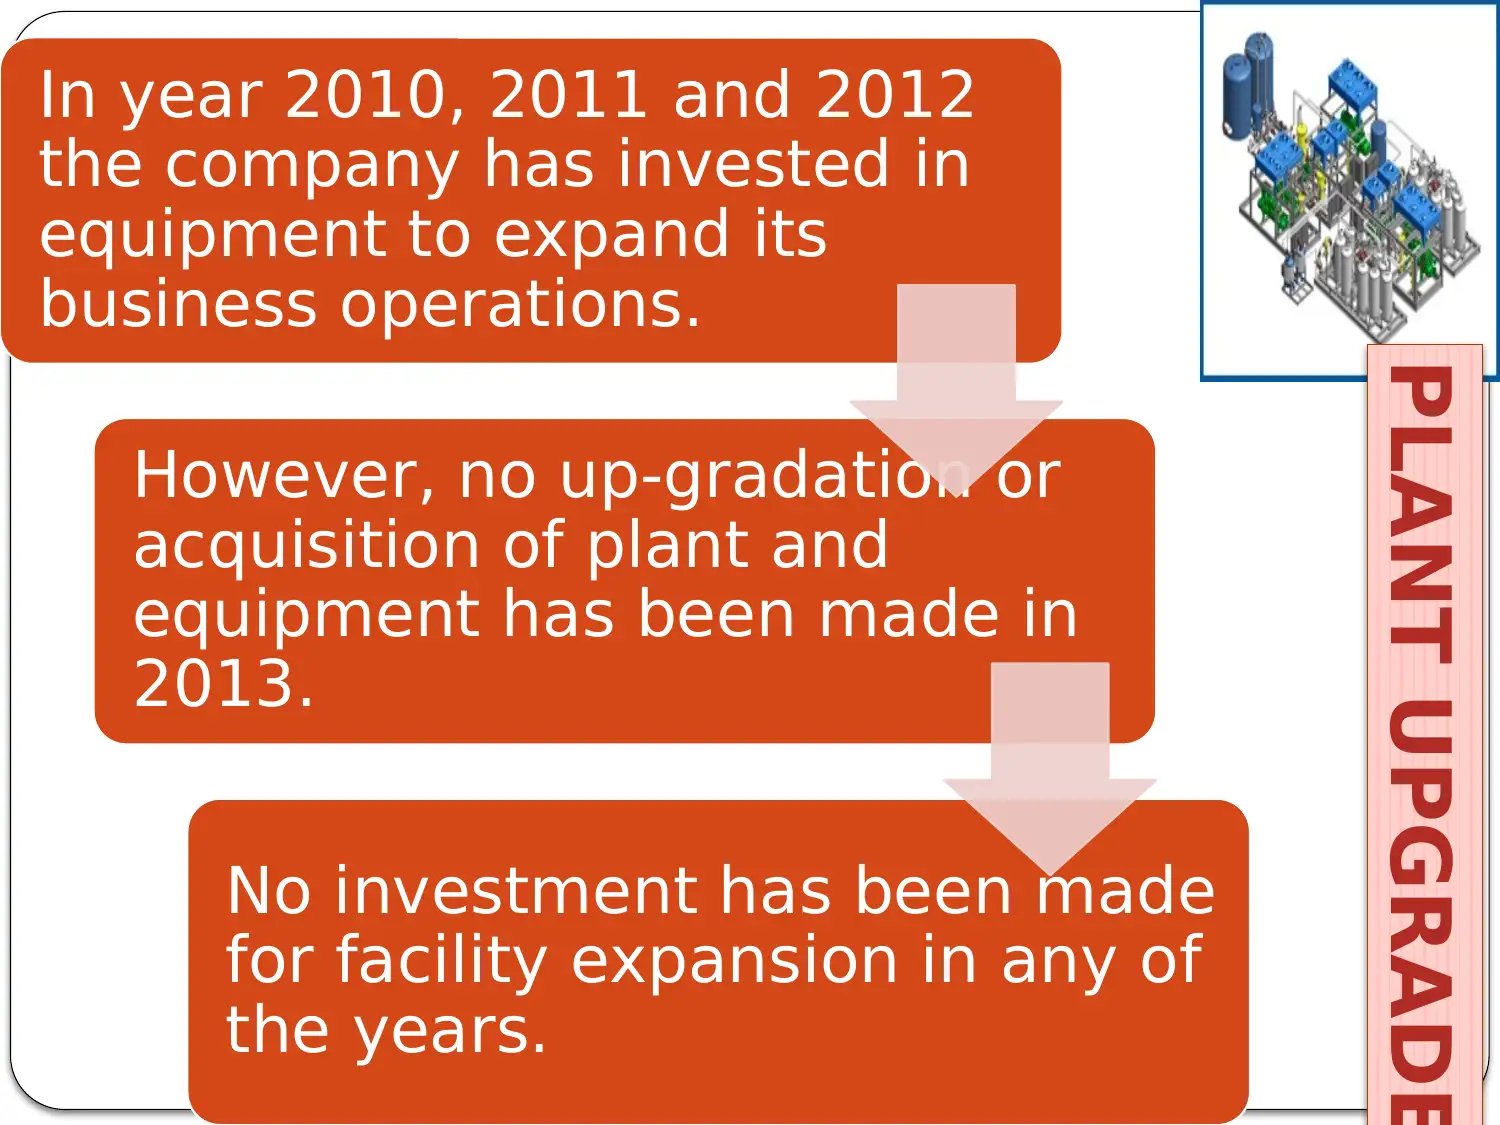
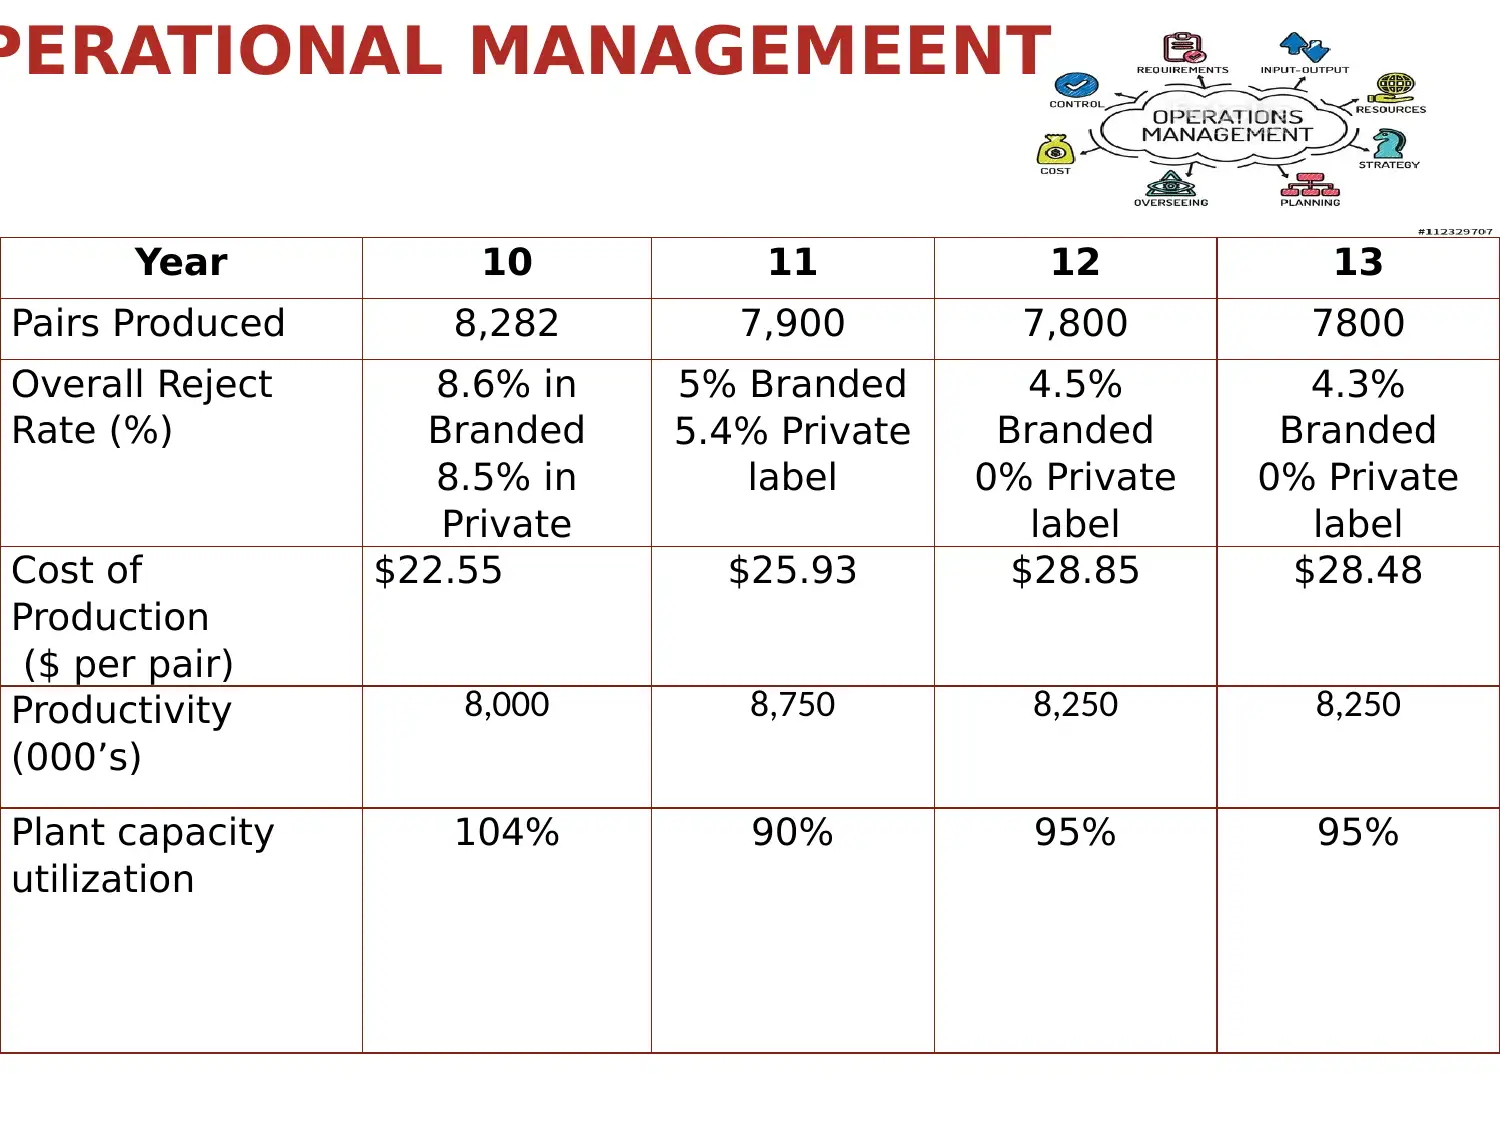
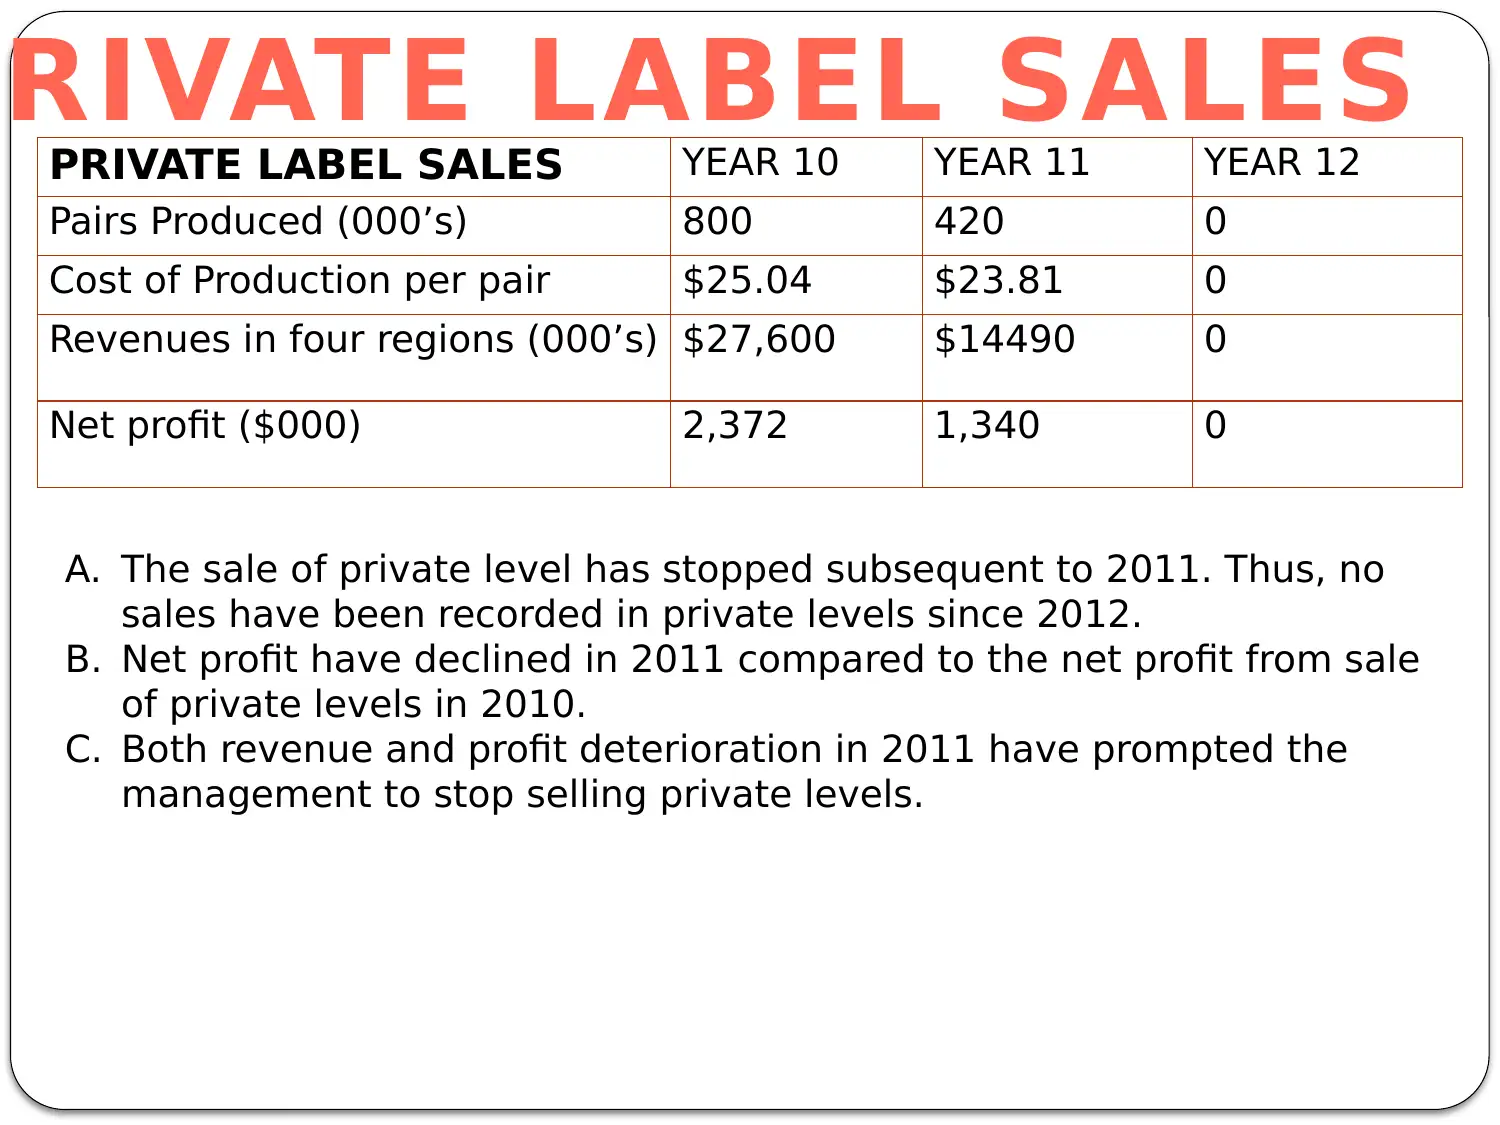
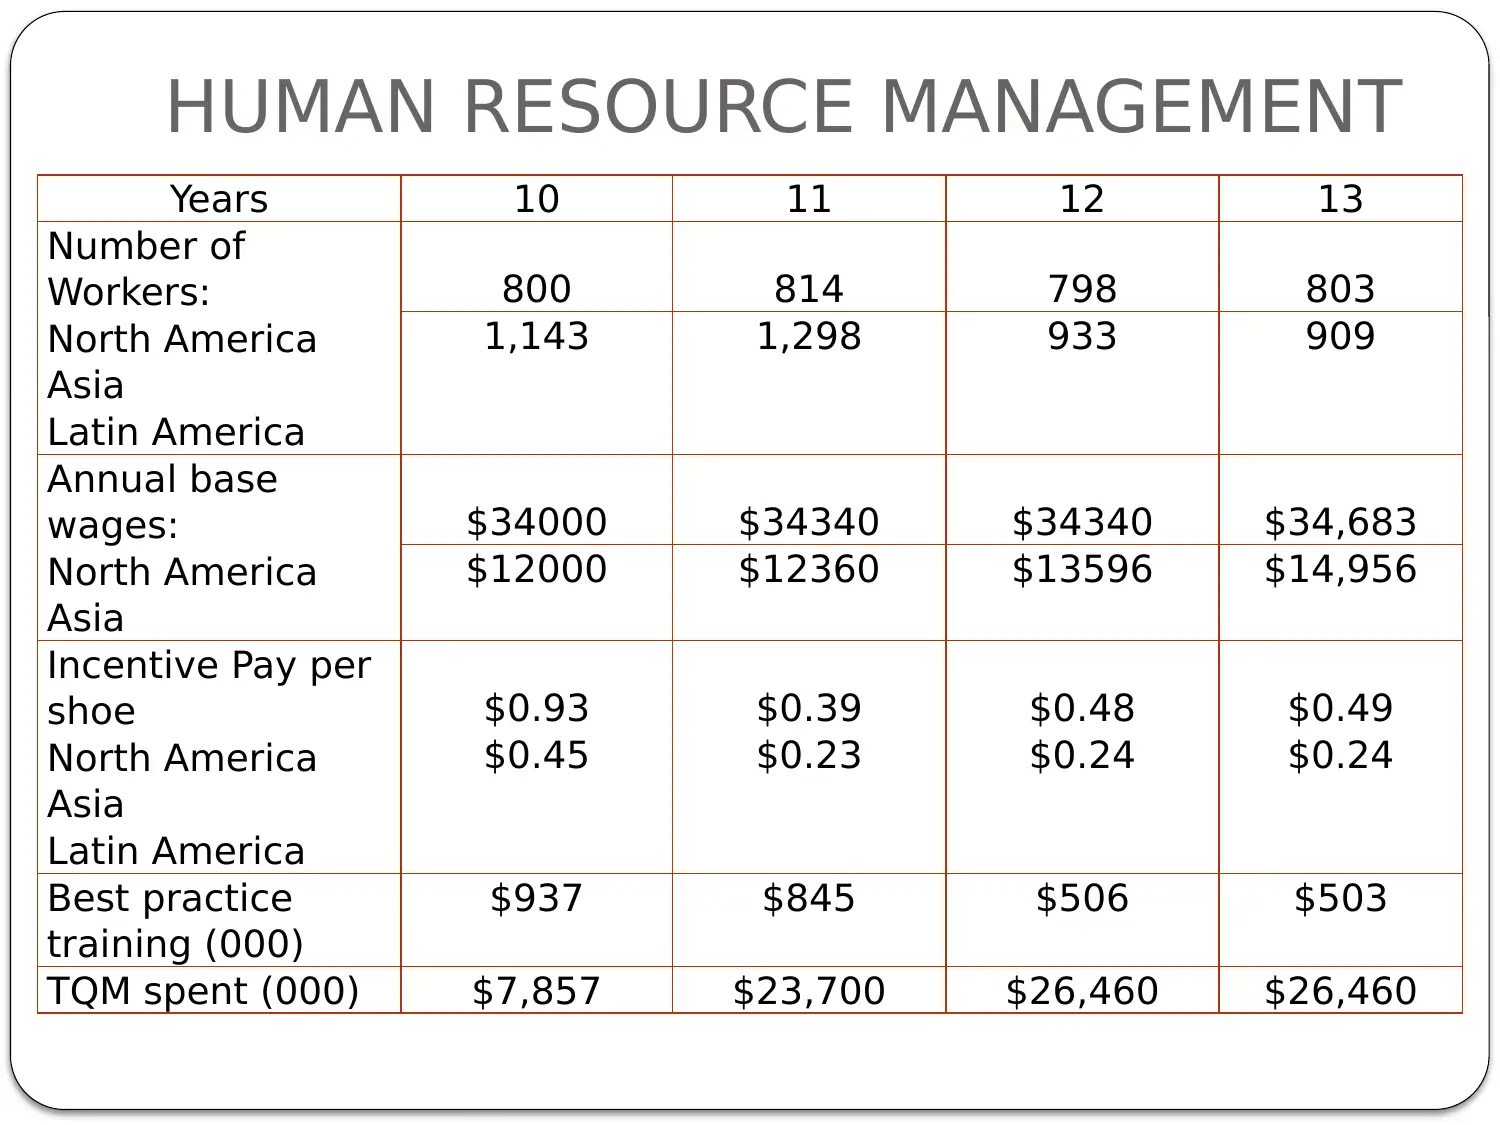
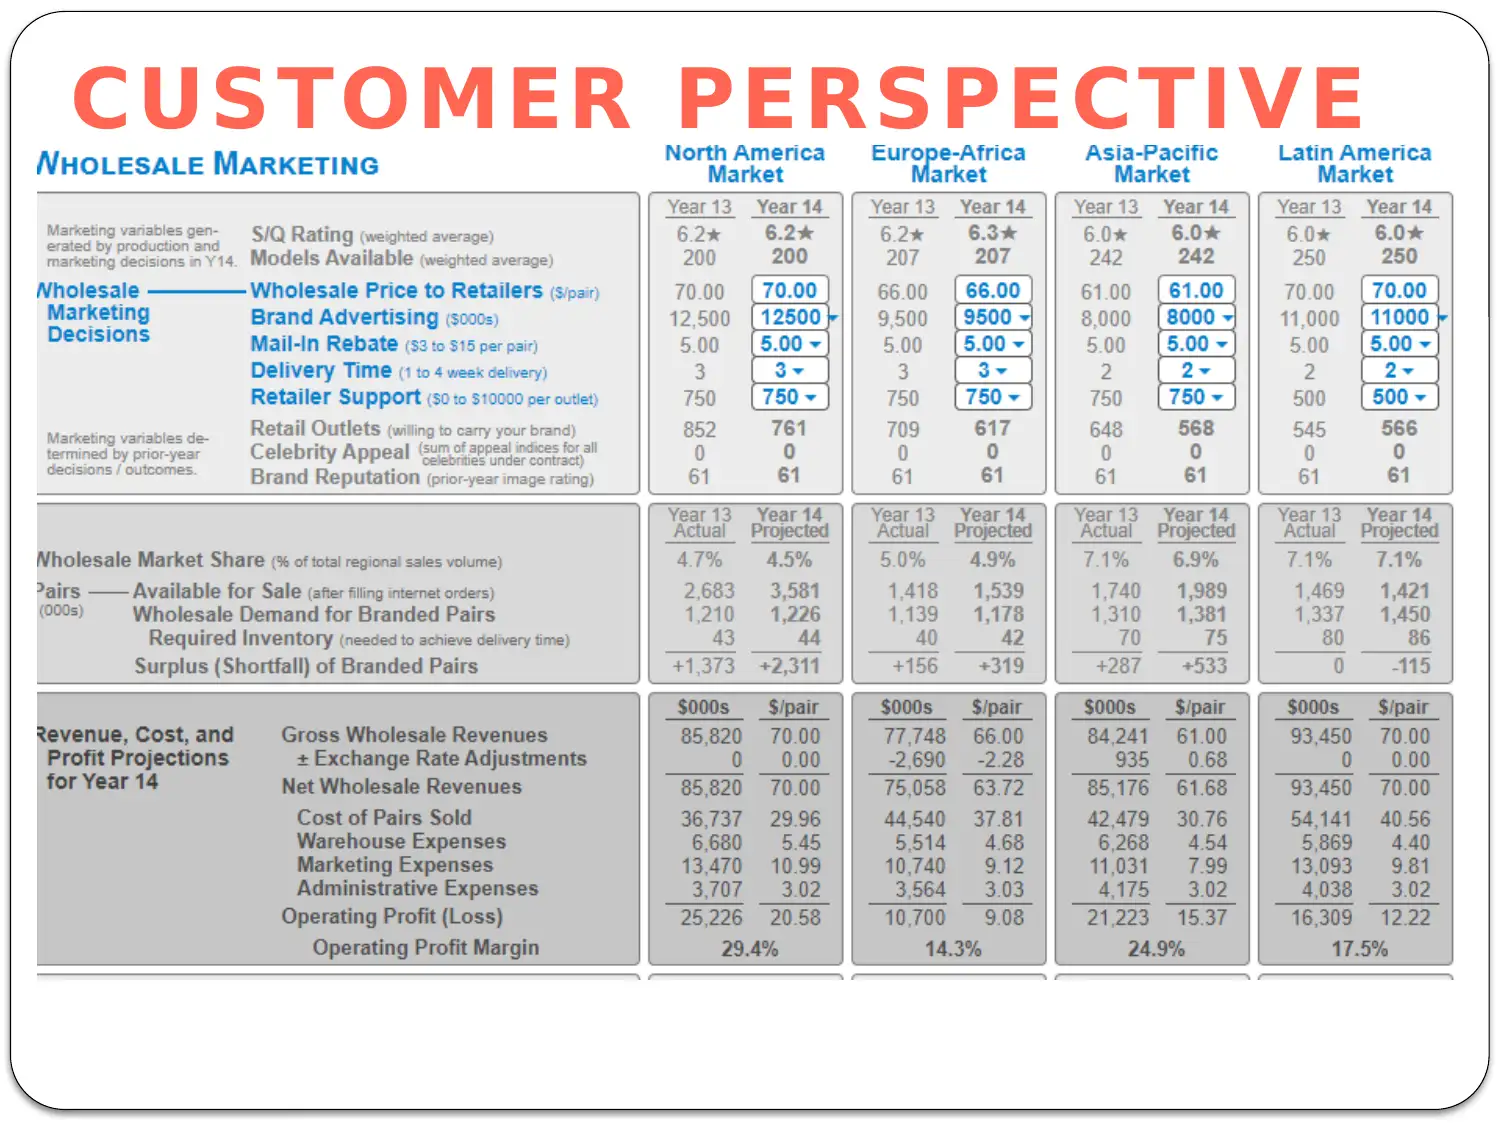
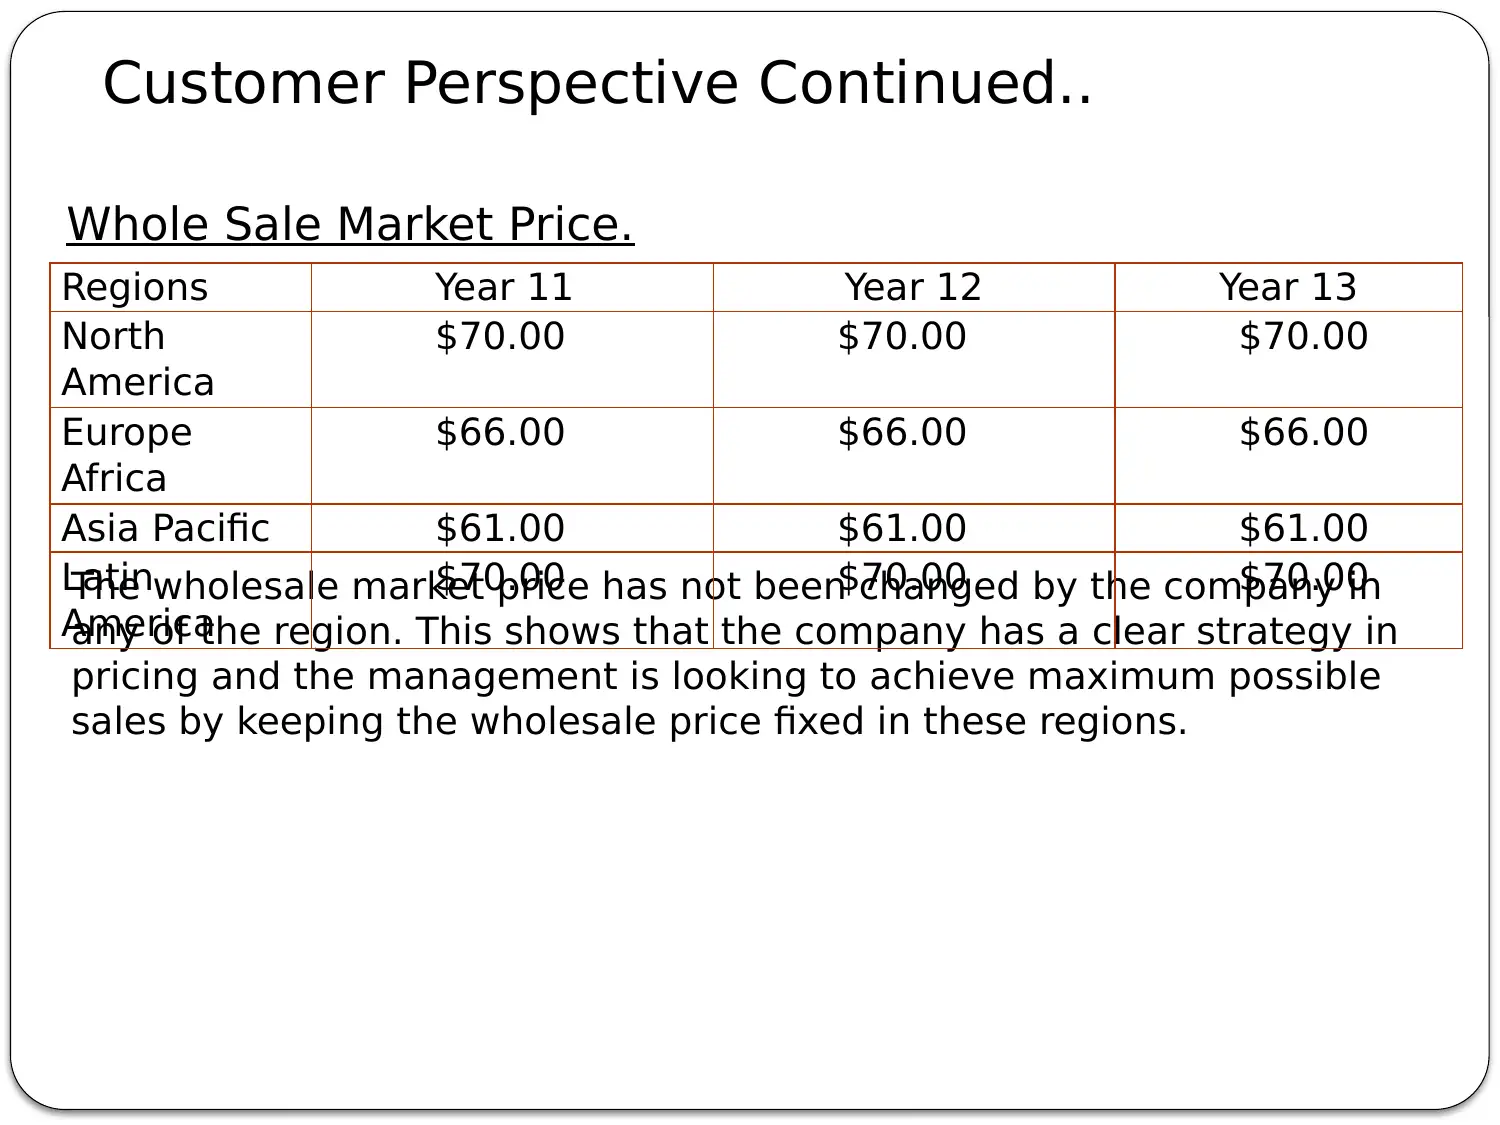
This report analyzes the financial performance of Company L, focusing on the year 2013. It examines key metrics such as revenue, net profit, and return on equity (ROE), highlighting a decline in these areas compared to 2012. The report includes a ratio analysis, showing improvements in liquidity and debt management. It explores the impact of dividend payments on share prices and discusses the cessation of private label sales. The report also covers operational management, including strategies to improve efficiency and increase production. Furthermore, it addresses customer perspectives, such as the wholesale market price strategy, and outlines future strategies focusing on advertising, facility expansion, and dividend payments. The analysis provides insights into the company's performance, challenges, and strategic directions.

COMPANY PERFORMANCE
Prepared by:
L COMPANY
Prepared by:
L COMPANY
Paraphrase This Document
Need a fresh take? Get an instant paraphrase of this document with our AI Paraphraser

SUMMARY:
1) Company L has not met all the targets of the investors in 2013 as
ROE fallen short of the expectation..
2) Revenue as well as net profit of the L Company have declined
significantly in 2013 as compared to 2012.
Terms Year
2010
Year
2011
Year 12 Year 13
INVESTORS
EXPECTATIO
N
Earnings per
Share (EPS)
2.00 $2.04 $3.88 $3.82 $3.24
Return on Equity
(ROE)
20% 17.7% 28.3% 22.7% 23.1%
Credit Rating B A- A A+ A
Image Rating 70 69 66 61 65
Share Price $30 $18.12 $74.26 $42.09 -
Net Revenues
(000)
$432,64
6
$436,764 $483,1
54
$448,524 -
Net Profit (000) $40,000 $40,701 $77,56
8
$76,411 -

SUMMARY OF KEY PERFORMANCE
INDICATORS:
2010 2011 2012 2013
Revenues (000’s) 432,646.00 436,764.00 483,154.00 448,524.00
Net Expenses (000’s) 392,646.00 396,063.00 405,586.00 372,113.00
Net Profit (000’s) 40,000.00 40,701.00 77,568.00 76,411.00
Net profit Margin
9.25 9.32 16.05 17.04
INDICATORS:
2010 2011 2012 2013
Revenues (000’s) 432,646.00 436,764.00 483,154.00 448,524.00
Net Expenses (000’s) 392,646.00 396,063.00 405,586.00 372,113.00
Net Profit (000’s) 40,000.00 40,701.00 77,568.00 76,411.00
Net profit Margin
9.25 9.32 16.05 17.04
⊘ This is a preview!⊘
Do you want full access?
Subscribe today to unlock all pages.

Trusted by 1+ million students worldwide

Ratio analysis
Current ratio has
improved over the
years indicating
improvement in
liquidity position of
the company.
Debt to asset ratio
has reduced
significantly in
2013 is a positive
indication for the
long term solvency
of the company.
RATIOS: 10 11 12 13
Current Ratio 2.7
7 3.65 3.92 5.95
Debt to Asset
Ratio
39
% 32% 26% 19%
Default Risk
Ratio
2.2
4 3.85 6.15 6.16
Interest
coverage Ratio
6.6
2 7.68 18.09 22.01
Paraphrase This Document
Need a fresh take? Get an instant paraphrase of this document with our AI Paraphraser

Cash flow position
Years 2010 2011 2012 2013
Dividen
d
20,000.0
0 -
30,000.0
0 -
Share
price
14.37 32.83 108.36
In case of L
company the
payment of
dividend seems to
have not
influenced the
share price of the
company.
This is because
despite non
payment of
dividend in 2013
the share price of
Years 2010 2011 2012 2013
Dividen
d
20,000.0
0 -
30,000.0
0 -
Share
price
14.37 32.83 108.36
In case of L
company the
payment of
dividend seems to
have not
influenced the
share price of the
company.
This is because
despite non
payment of
dividend in 2013
the share price of

In year 2010, 2011 and 2012
the company has invested in
equipment to expand its
business operations.
However, no up-gradation or
acquisition of plant and
equipment has been made in
2013.
No investment has been made
for facility expansion in any of
the years.
PLANT UPGRADE
the company has invested in
equipment to expand its
business operations.
However, no up-gradation or
acquisition of plant and
equipment has been made in
2013.
No investment has been made
for facility expansion in any of
the years.
PLANT UPGRADE
⊘ This is a preview!⊘
Do you want full access?
Subscribe today to unlock all pages.

Trusted by 1+ million students worldwide

Year 10 11 12 13
Pairs Produced 8,282 7,900 7,800 7800
Overall Reject
Rate (%)
8.6% in
Branded
8.5% in
Private
5% Branded
5.4% Private
label
4.5%
Branded
0% Private
label
4.3%
Branded
0% Private
label
Cost of
Production
($ per pair)
$22.55 $25.93 $28.85 $28.48
Productivity
(000’s)
8,000 8,750 8,250 8,250
Plant capacity
utilization
104% 90% 95% 95%
PERATIONAL MANAGEMEENT
Paraphrase This Document
Need a fresh take? Get an instant paraphrase of this document with our AI Paraphraser

PRIVATE LABEL SALES YEAR 10 YEAR 11 YEAR 12
Pairs Produced (000’s) 800 420 0
Cost of Production per pair $25.04 $23.81 0
Revenues in four regions (000’s) $27,600 $14490 0
Net profit ($000) 2,372 1,340 0
RIVATE LABEL SALES
A. The sale of private level has stopped subsequent to 2011. Thus, no
sales have been recorded in private levels since 2012.
B. Net profit have declined in 2011 compared to the net profit from sale
of private levels in 2010.
C. Both revenue and profit deterioration in 2011 have prompted the
management to stop selling private levels.

HUMAN RESOURCE MANAGEMENT
Years 10 11 12 13
Number of
Workers:
North America
Asia
Latin America
800 814 798 803
1,143 1,298 933 909
Annual base
wages:
North America
Asia
$34000 $34340 $34340 $34,683
$12000 $12360 $13596 $14,956
Incentive Pay per
shoe
North America
Asia
Latin America
$0.93
$0.45
$0.39
$0.23
$0.48
$0.24
$0.49
$0.24
Best practice
training (000)
$937 $845 $506 $503
TQM spent (000) $7,857 $23,700 $26,460 $26,460
⊘ This is a preview!⊘
Do you want full access?
Subscribe today to unlock all pages.

Trusted by 1+ million students worldwide

CUSTOMER PERSPECTIVE
Paraphrase This Document
Need a fresh take? Get an instant paraphrase of this document with our AI Paraphraser

The wholesale market price has not been changed by the company in
any of the region. This shows that the company has a clear strategy in
pricing and the management is looking to achieve maximum possible
sales by keeping the wholesale price fixed in these regions.
Regions Year 11 Year 12 Year 13
North
America
$70.00 $70.00 $70.00
Europe
Africa
$66.00 $66.00 $66.00
Asia Pacific $61.00 $61.00 $61.00
Latin
America
$70.00 $70.00 $70.00
Customer Perspective Continued..
Whole Sale Market Price.

1) Improving the efficiency in the workplace by
reducing the idle machine time as well as idle
time during the working hours.
2) Taking necessary steps to increase the
production of footwear in all the regions.
3) Increasing the advertisement budget will help
the company to attract more customers in the
future to increase sales in different regions.
4) Expansion of facilities will further improve the
chances of the company to increase its market
share.
5) The company should pay pay dividend
regularly to improve its market outlook.
FUTURE STRATEGIES
!
⊘ This is a preview!⊘
Do you want full access?
Subscribe today to unlock all pages.

Trusted by 1+ million students worldwide
1 out of 12
Related Documents
Your All-in-One AI-Powered Toolkit for Academic Success.
+13062052269
info@desklib.com
Available 24*7 on WhatsApp / Email
Unlock your academic potential
Copyright © 2020–2026 A2Z Services. All Rights Reserved. Developed and managed by ZUCOL.


