Murdoch University BUS329: Comparative Financial Ratio Analysis Report
VerifiedAdded on 2022/08/11
|12
|1364
|18
Report
AI Summary
This report conducts a comparative financial analysis of COCHLEAR LIMITED (COH) and COGSTATE LTD (CGS), both operating in the Health Care Equipment & Services sector, based on their financial performance over the last five years. The analysis utilizes various financial ratios, including debt, liqui...
Running head: COMPARATIVE ANALYSIS OF RATIOS
COMPARATIVE ANALYSIS OF RATIOS
Name of Student
Name of University
Author’s Note
COMPARATIVE ANALYSIS OF RATIOS
Name of Student
Name of University
Author’s Note
Paraphrase This Document
Need a fresh take? Get an instant paraphrase of this document with our AI Paraphraser
2COMPARATIVE ANALYSIS OF RATIOS
EXECUTIVE SUMMARY:
This report provides information regarding the financial performance of COCHLEAR
LIMITED (COH) Health Care Equipment & Services and COGSTATE LTD (CGS) Health
Care Equipment & Services based on last five years. The ratio analysis has been used to
complete the financial analysis of the company. As per the analysis the main issue that can be
observed is that the net profit margin ratio of COGSTATE LTD (CGS) Health Care
Equipment & Services is very low in comparison to COCHLEAR LIMITED (COH) Health
Care Equipment & Services. Thus, for better return it is feasible for the investor to invest in
COCHLEAR LIMITED (COH) Health Care Equipment & Services.
3COMPARATIVE ANALYSIS OF RATIOS
Table of Contents
INTRODUCTION:........................................................................................................4
IDENTIFICATION OF THE ISSUES:.........................................................................4
FINANCIAL ANALYSIS:............................................................................................4
Debt to Asset Ratio:...................................................................................................4
Debt to Equity Ratio:.................................................................................................5
Assets to Equity Ratio:...............................................................................................5
Receivables Turnover Ratio:......................................................................................6
Total Asset Turnover Ratio:.......................................................................................7
Current Ratio:.............................................................................................................7
Cash Ratio:.................................................................................................................8
Gross Profit Margin Ratio:.........................................................................................9
Net Profit Margin Ratio:............................................................................................9
Operating Cash Flow Ratio:.....................................................................................10
RECOMMENDATION:..............................................................................................10
REFERENCING:.........................................................................................................12
⊘ This is a preview!⊘
Do you want full access?
Subscribe today to unlock all pages.
Trusted by 1+ million students worldwide
4COMPARATIVE ANALYSIS OF RATIOS
INTRODUCTION:
The financial statement analysis holds a considerable amount of importance for an
investor. It is the financial statement that provides complete overview about the company’s
performance in a single accounting year. The financial ratios is also one of the financial
statement analysis that provides complete insight about the company’s financial performance
in a single financial year. Thus, to analyse the financial performance of COH and CGS
leverage ratios, profitability ratios, liquidity ratios, asset utilization ratios and cash flow ratios
are being analysed to oversee which company performed well.
IDENTIFICATION OF THE ISSUES:
COCHLEAR LIMITED (COH) Health Care Equipment & Services and COGSTATE
LTD (CGS) Health Care Equipment & Services are the two Australian companies that mainly
deals with the medical instruments of the country. To analyse the performance of both the
company’s ratio analysis has been performed. The analysis has been performed based on the
five years of financial performance of the company. The main problem that can be identified
while analysing the financial statements of both the companies is that the net profit of both
the companies is low in spite of having high revenue.
FINANCIAL ANALYSIS:
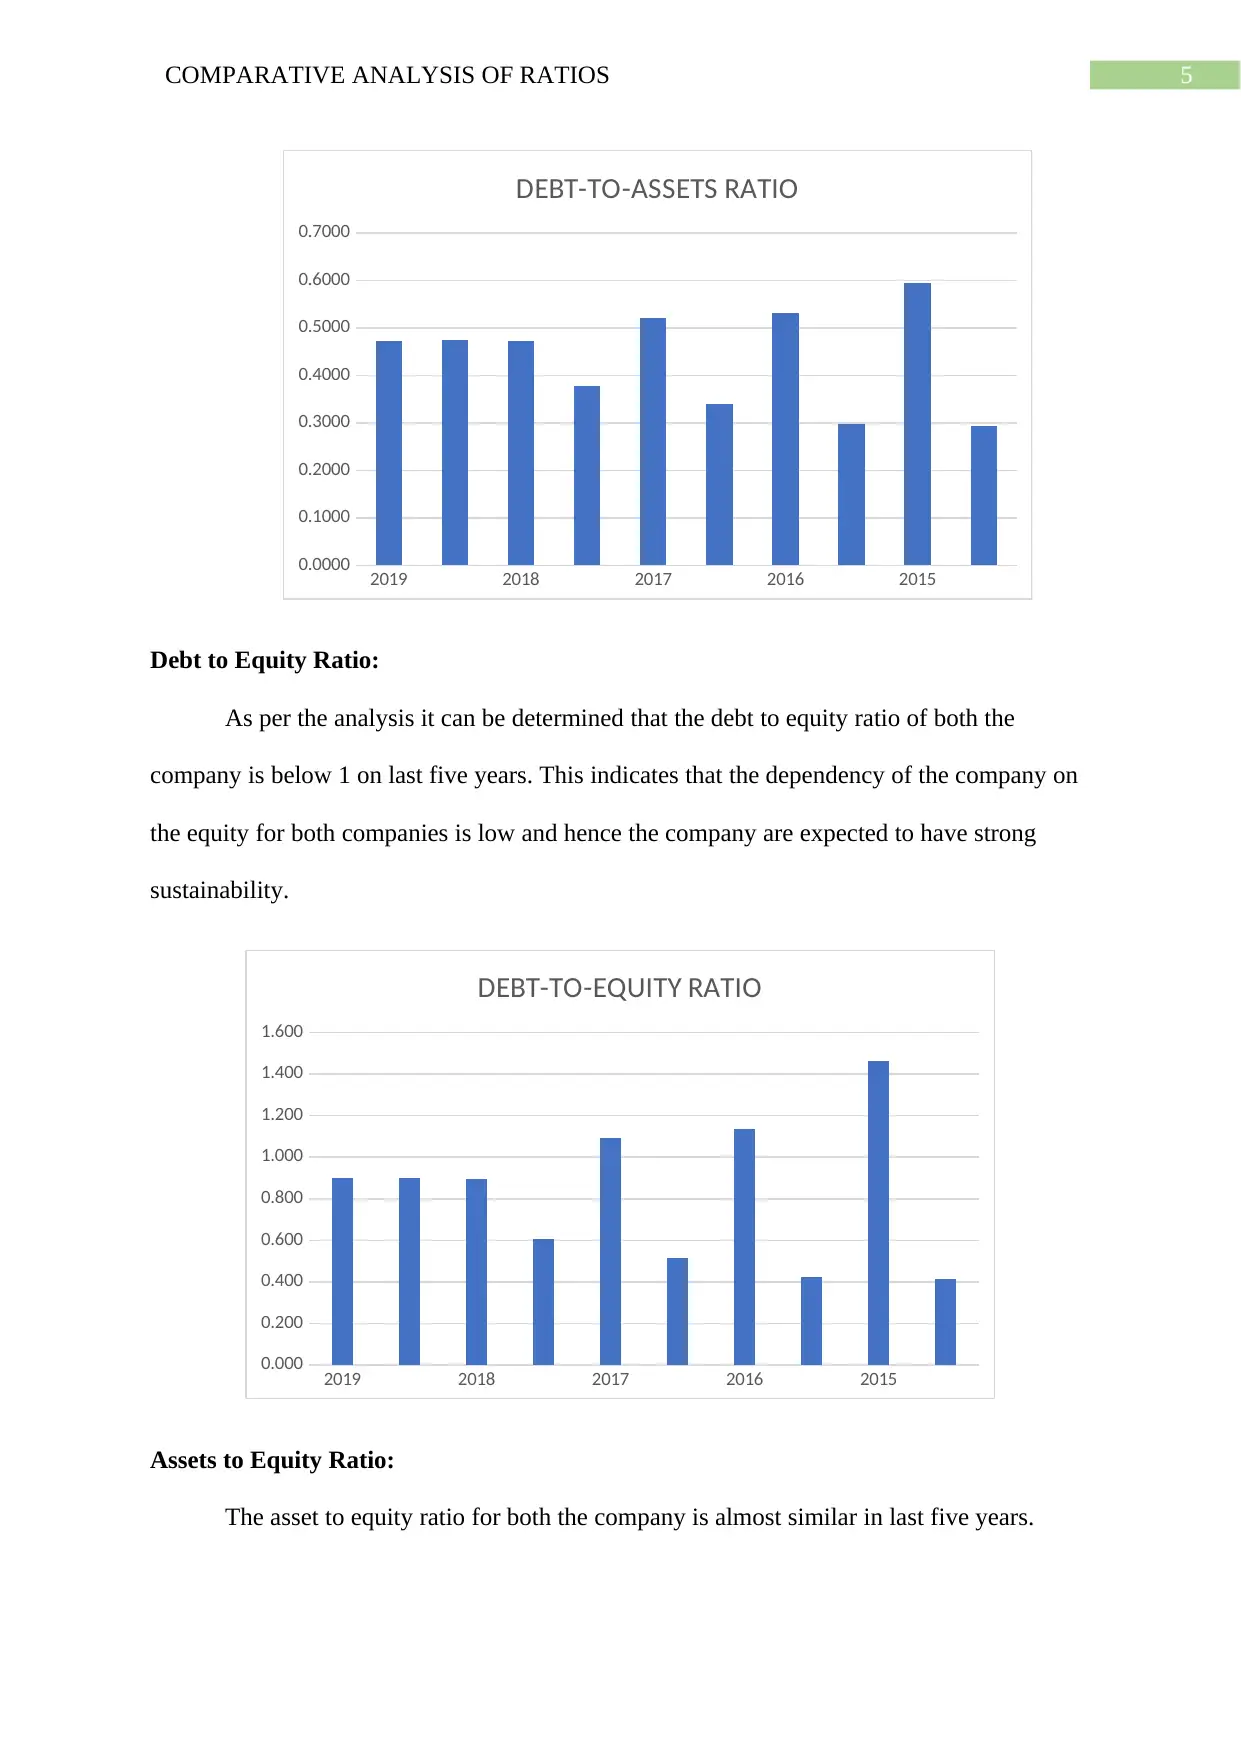
Debt to Asset Ratio:
As per the analysis it can be said that COCHLEAR LIMITED (COH) Health Care
Equipment & Services performed low in comparison to COGSTATE LTD (CGS) Health
Care Equipment & Services. The percentage of assets that borrowed by COCHLEAR
LIMITED (COH) Health Care Equipment & Services is higher in comparison to its
counterpart.
INTRODUCTION:
The financial statement analysis holds a considerable amount of importance for an
investor. It is the financial statement that provides complete overview about the company’s
performance in a single accounting year. The financial ratios is also one of the financial
statement analysis that provides complete insight about the company’s financial performance
in a single financial year. Thus, to analyse the financial performance of COH and CGS
leverage ratios, profitability ratios, liquidity ratios, asset utilization ratios and cash flow ratios
are being analysed to oversee which company performed well.
IDENTIFICATION OF THE ISSUES:
COCHLEAR LIMITED (COH) Health Care Equipment & Services and COGSTATE
LTD (CGS) Health Care Equipment & Services are the two Australian companies that mainly
deals with the medical instruments of the country. To analyse the performance of both the
company’s ratio analysis has been performed. The analysis has been performed based on the
five years of financial performance of the company. The main problem that can be identified
while analysing the financial statements of both the companies is that the net profit of both
the companies is low in spite of having high revenue.
FINANCIAL ANALYSIS:
Debt to Asset Ratio:
As per the analysis it can be said that COCHLEAR LIMITED (COH) Health Care
Equipment & Services performed low in comparison to COGSTATE LTD (CGS) Health
Care Equipment & Services. The percentage of assets that borrowed by COCHLEAR
LIMITED (COH) Health Care Equipment & Services is higher in comparison to its
counterpart.
Paraphrase This Document
Need a fresh take? Get an instant paraphrase of this document with our AI Paraphraser
5COMPARATIVE ANALYSIS OF RATIOS
2019 2018 2017 2016 2015
0.0000
0.1000
0.2000
0.3000
0.4000
0.5000
0.6000
0.7000
DEBT-TO-ASSETS RATIO
Debt to Equity Ratio:
As per the analysis it can be determined that the debt to equity ratio of both the
company is below 1 on last five years. This indicates that the dependency of the company on
the equity for both companies is low and hence the company are expected to have strong
sustainability.
2019 2018 2017 2016 2015
0.000
0.200
0.400
0.600
0.800
1.000
1.200
1.400
1.600
DEBT-TO-EQUITY RATIO
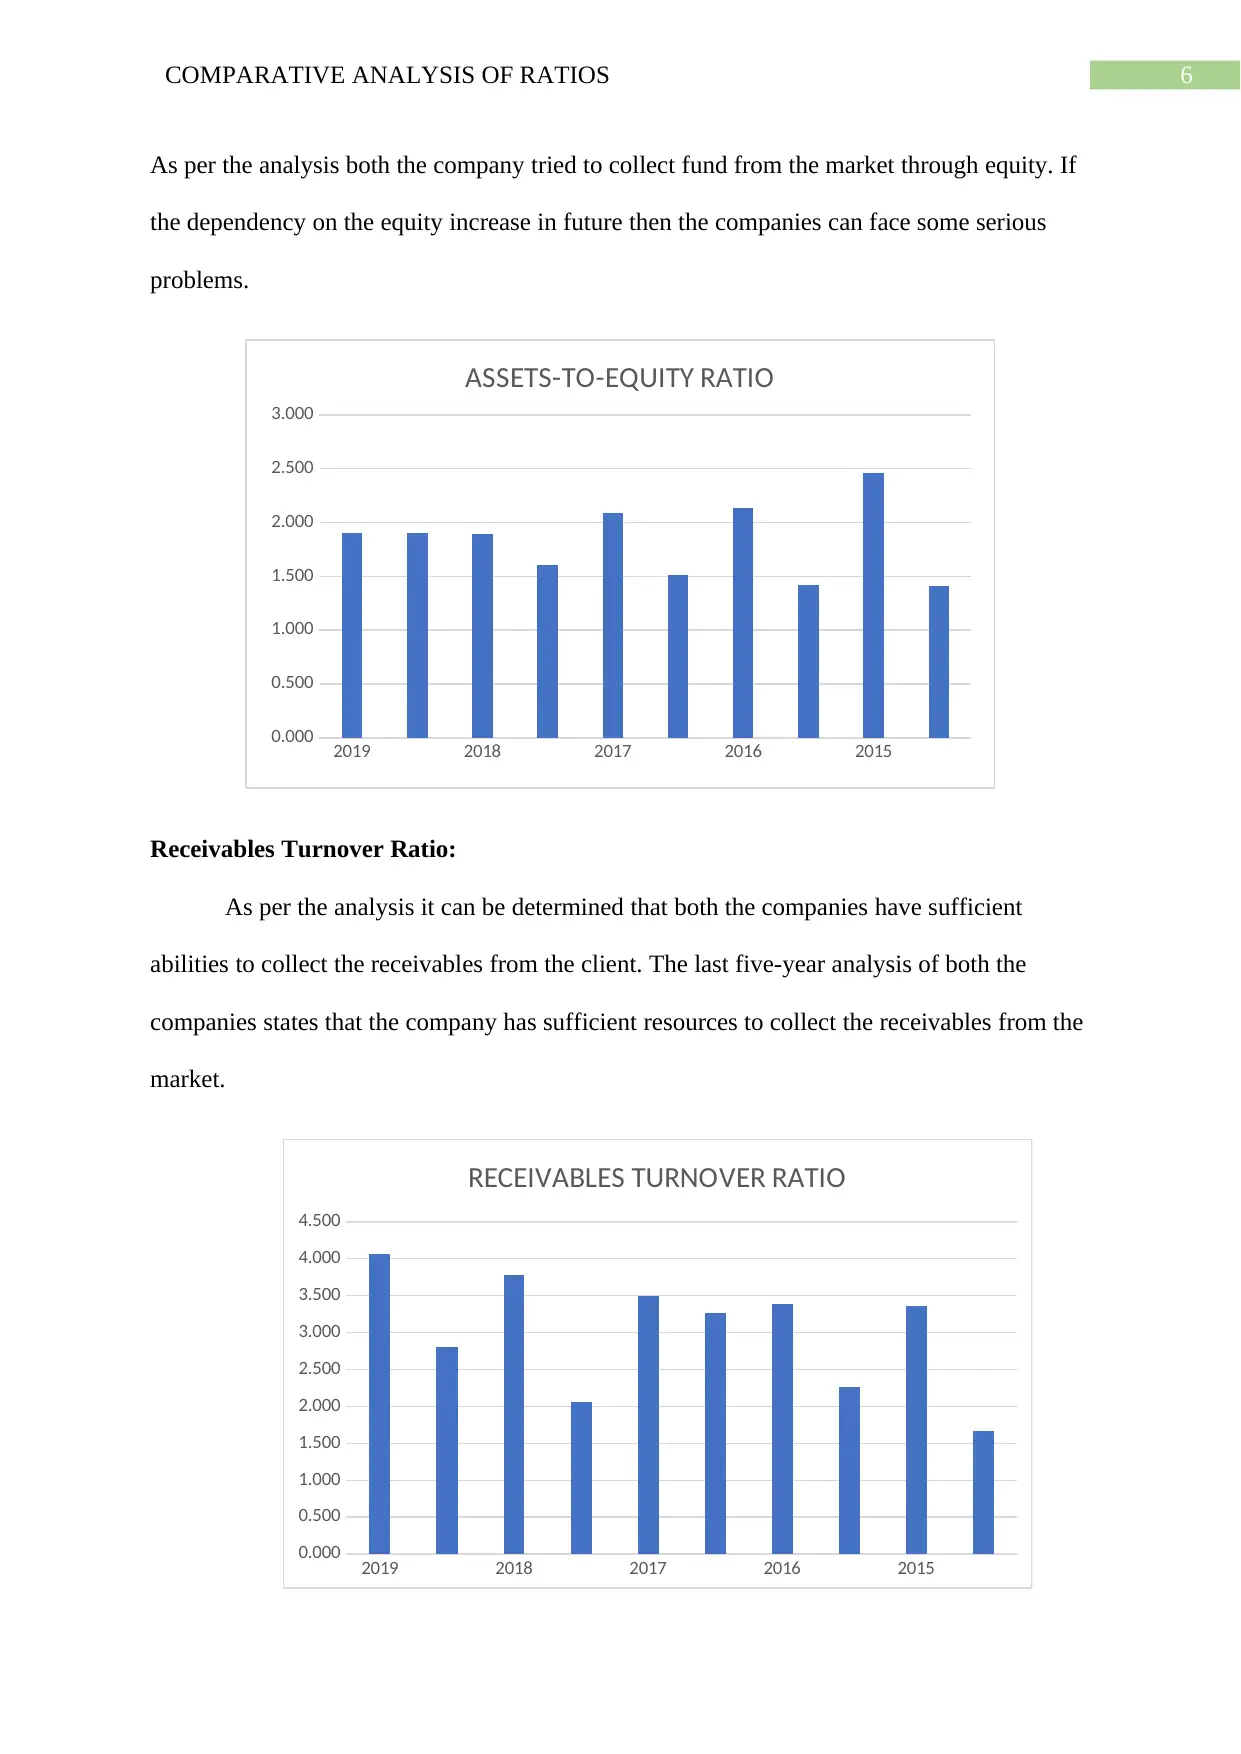
Assets to Equity Ratio:
The asset to equity ratio for both the company is almost similar in last five years.
2019 2018 2017 2016 2015
0.0000
0.1000
0.2000
0.3000
0.4000
0.5000
0.6000
0.7000
DEBT-TO-ASSETS RATIO
Debt to Equity Ratio:
As per the analysis it can be determined that the debt to equity ratio of both the
company is below 1 on last five years. This indicates that the dependency of the company on
the equity for both companies is low and hence the company are expected to have strong
sustainability.
2019 2018 2017 2016 2015
0.000
0.200
0.400
0.600
0.800
1.000
1.200
1.400
1.600
DEBT-TO-EQUITY RATIO
Assets to Equity Ratio:
The asset to equity ratio for both the company is almost similar in last five years.
6COMPARATIVE ANALYSIS OF RATIOS
As per the analysis both the company tried to collect fund from the market through equity. If
the dependency on the equity increase in future then the companies can face some serious
problems.
2019 2018 2017 2016 2015
0.000
0.500
1.000
1.500
2.000
2.500
3.000
ASSETS-TO-EQUITY RATIO
Receivables Turnover Ratio:
As per the analysis it can be determined that both the companies have sufficient
abilities to collect the receivables from the client. The last five-year analysis of both the
companies states that the company has sufficient resources to collect the receivables from the
market.
2019 2018 2017 2016 2015
0.000
0.500
1.000
1.500
2.000
2.500
3.000
3.500
4.000
4.500
RECEIVABLES TURNOVER RATIO
⊘ This is a preview!⊘
Do you want full access?
Subscribe today to unlock all pages.
Trusted by 1+ million students worldwide
7COMPARATIVE ANALYSIS OF RATIOS
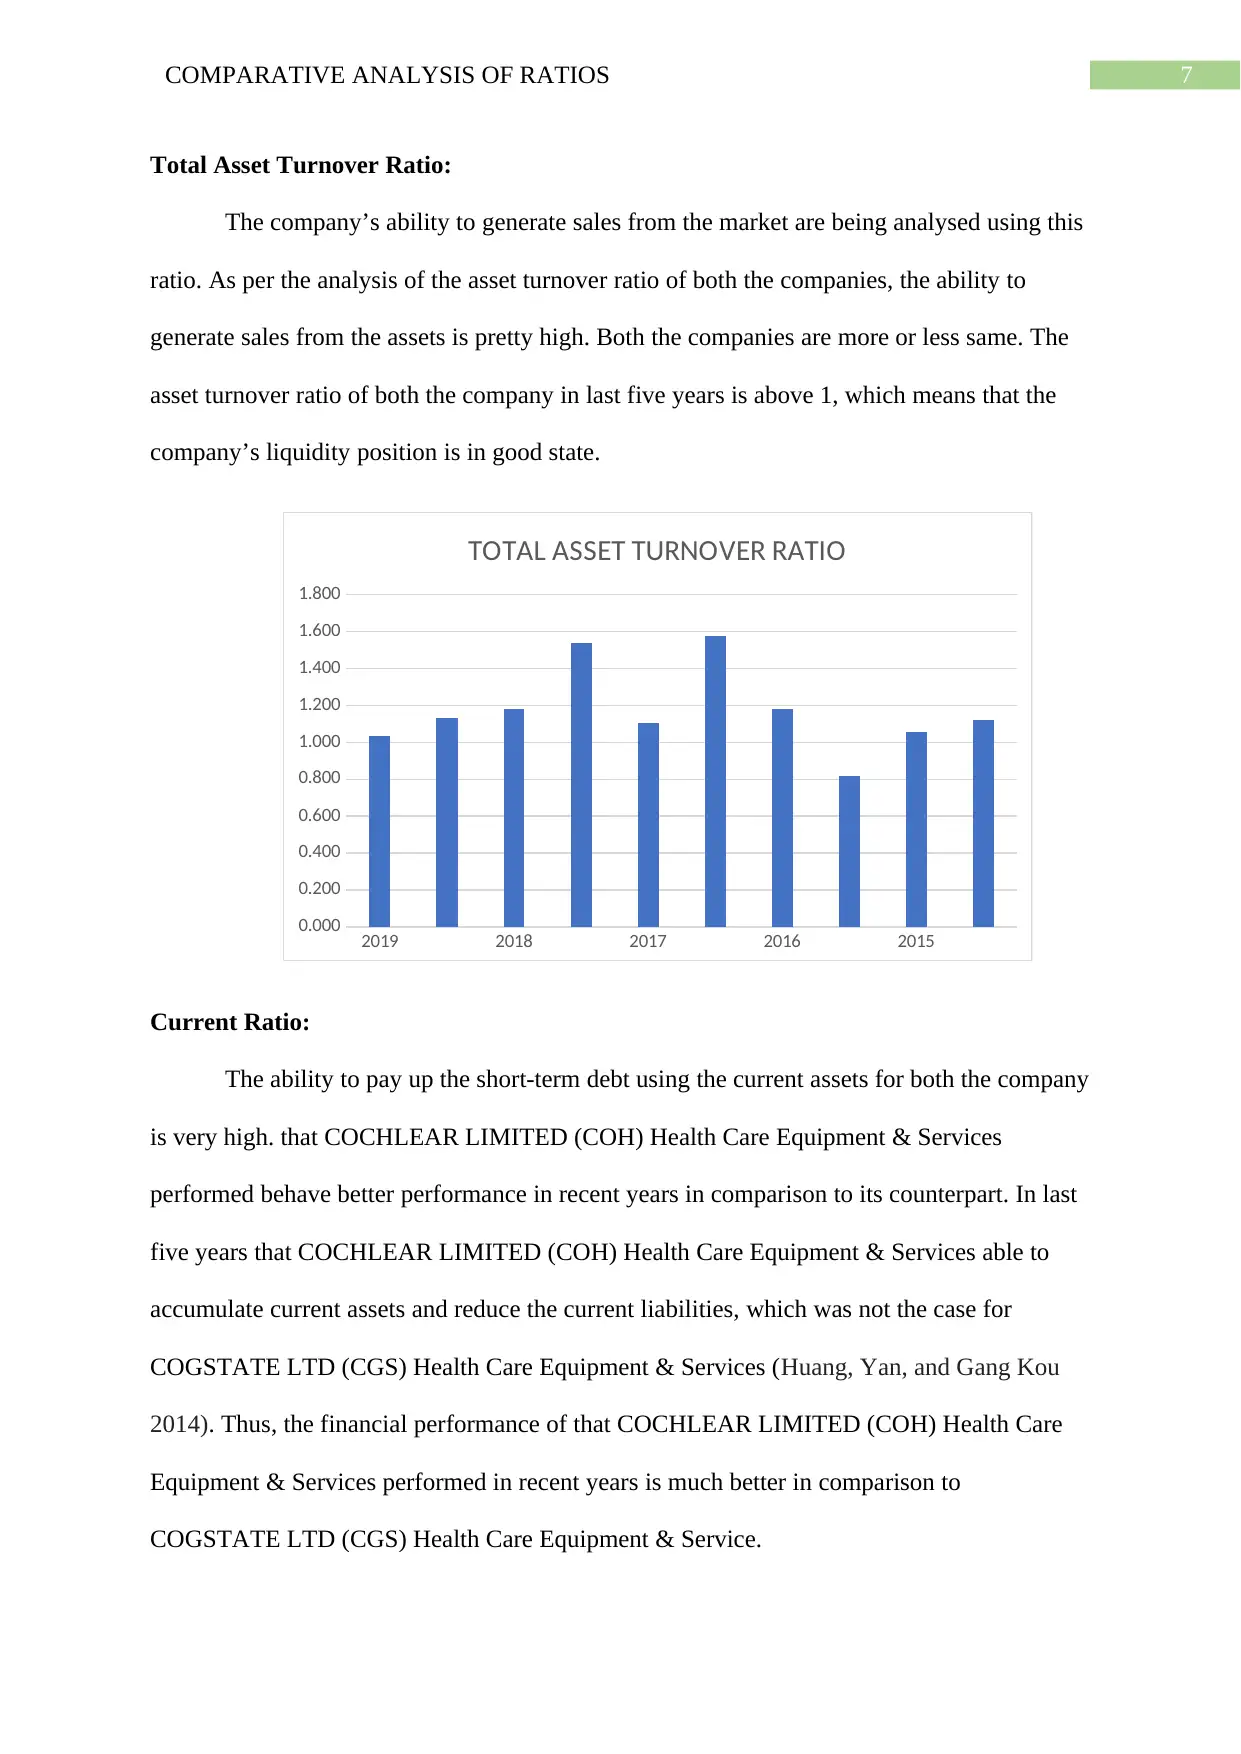
Total Asset Turnover Ratio:
The company’s ability to generate sales from the market are being analysed using this
ratio. As per the analysis of the asset turnover ratio of both the companies, the ability to
generate sales from the assets is pretty high. Both the companies are more or less same. The
asset turnover ratio of both the company in last five years is above 1, which means that the
company’s liquidity position is in good state.
2019 2018 2017 2016 2015
0.000
0.200
0.400
0.600
0.800
1.000
1.200
1.400
1.600
1.800
TOTAL ASSET TURNOVER RATIO
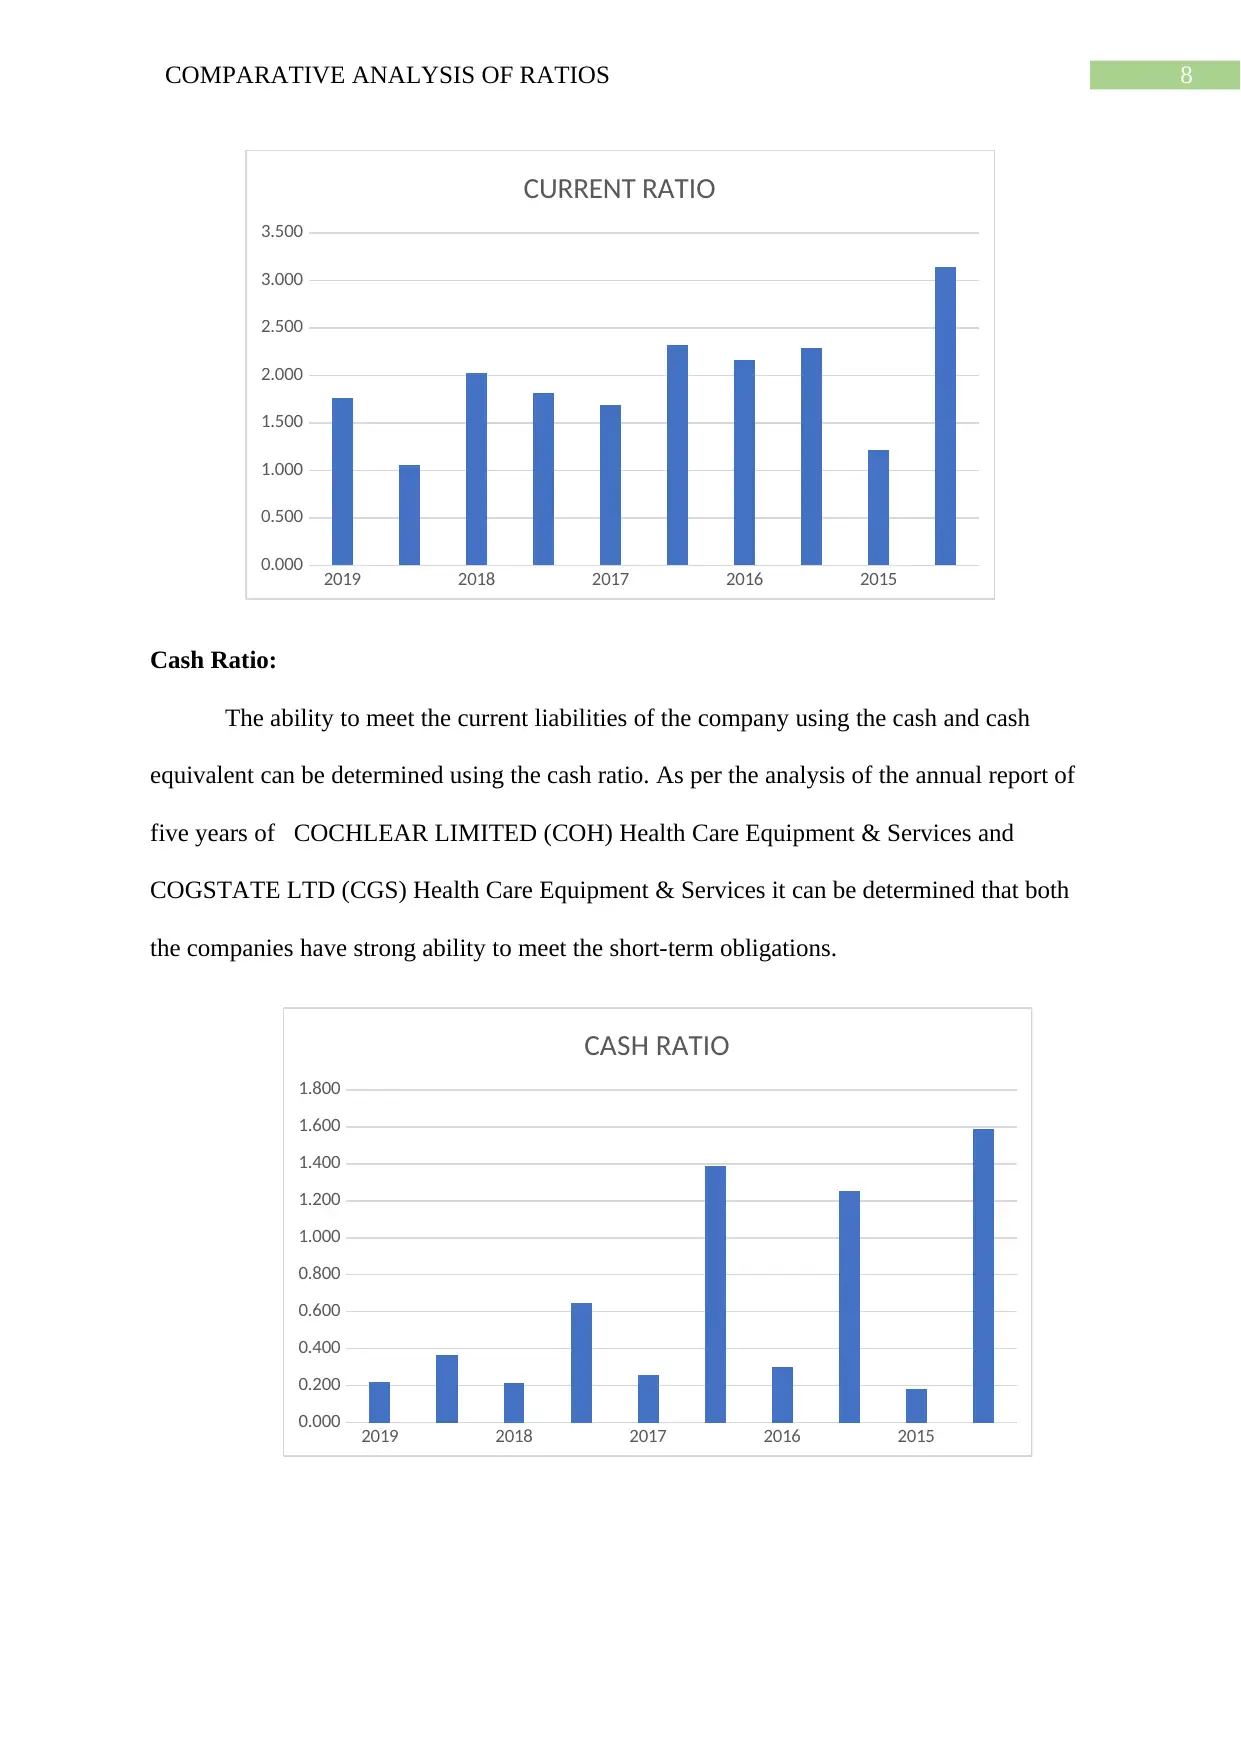
Current Ratio:
The ability to pay up the short-term debt using the current assets for both the company
is very high. that COCHLEAR LIMITED (COH) Health Care Equipment & Services
performed behave better performance in recent years in comparison to its counterpart. In last
five years that COCHLEAR LIMITED (COH) Health Care Equipment & Services able to
accumulate current assets and reduce the current liabilities, which was not the case for
COGSTATE LTD (CGS) Health Care Equipment & Services (Huang, Yan, and Gang Kou
2014). Thus, the financial performance of that COCHLEAR LIMITED (COH) Health Care
Equipment & Services performed in recent years is much better in comparison to
COGSTATE LTD (CGS) Health Care Equipment & Service.
Total Asset Turnover Ratio:
The company’s ability to generate sales from the market are being analysed using this
ratio. As per the analysis of the asset turnover ratio of both the companies, the ability to
generate sales from the assets is pretty high. Both the companies are more or less same. The
asset turnover ratio of both the company in last five years is above 1, which means that the
company’s liquidity position is in good state.
2019 2018 2017 2016 2015
0.000
0.200
0.400
0.600
0.800
1.000
1.200
1.400
1.600
1.800
TOTAL ASSET TURNOVER RATIO
Current Ratio:
The ability to pay up the short-term debt using the current assets for both the company
is very high. that COCHLEAR LIMITED (COH) Health Care Equipment & Services
performed behave better performance in recent years in comparison to its counterpart. In last
five years that COCHLEAR LIMITED (COH) Health Care Equipment & Services able to
accumulate current assets and reduce the current liabilities, which was not the case for
COGSTATE LTD (CGS) Health Care Equipment & Services (Huang, Yan, and Gang Kou
2014). Thus, the financial performance of that COCHLEAR LIMITED (COH) Health Care
Equipment & Services performed in recent years is much better in comparison to
COGSTATE LTD (CGS) Health Care Equipment & Service.
Paraphrase This Document
Need a fresh take? Get an instant paraphrase of this document with our AI Paraphraser
8COMPARATIVE ANALYSIS OF RATIOS
2019 2018 2017 2016 2015
0.000
0.500
1.000
1.500
2.000
2.500
3.000
3.500
CURRENT RATIO
Cash Ratio:
The ability to meet the current liabilities of the company using the cash and cash
equivalent can be determined using the cash ratio. As per the analysis of the annual report of
five years of COCHLEAR LIMITED (COH) Health Care Equipment & Services and
COGSTATE LTD (CGS) Health Care Equipment & Services it can be determined that both
the companies have strong ability to meet the short-term obligations.
2019 2018 2017 2016 2015
0.000
0.200
0.400
0.600
0.800
1.000
1.200
1.400
1.600
1.800
CASH RATIO
2019 2018 2017 2016 2015
0.000
0.500
1.000
1.500
2.000
2.500
3.000
3.500
CURRENT RATIO
Cash Ratio:
The ability to meet the current liabilities of the company using the cash and cash
equivalent can be determined using the cash ratio. As per the analysis of the annual report of
five years of COCHLEAR LIMITED (COH) Health Care Equipment & Services and
COGSTATE LTD (CGS) Health Care Equipment & Services it can be determined that both
the companies have strong ability to meet the short-term obligations.
2019 2018 2017 2016 2015
0.000
0.200
0.400
0.600
0.800
1.000
1.200
1.400
1.600
1.800
CASH RATIO
9COMPARATIVE ANALYSIS OF RATIOS
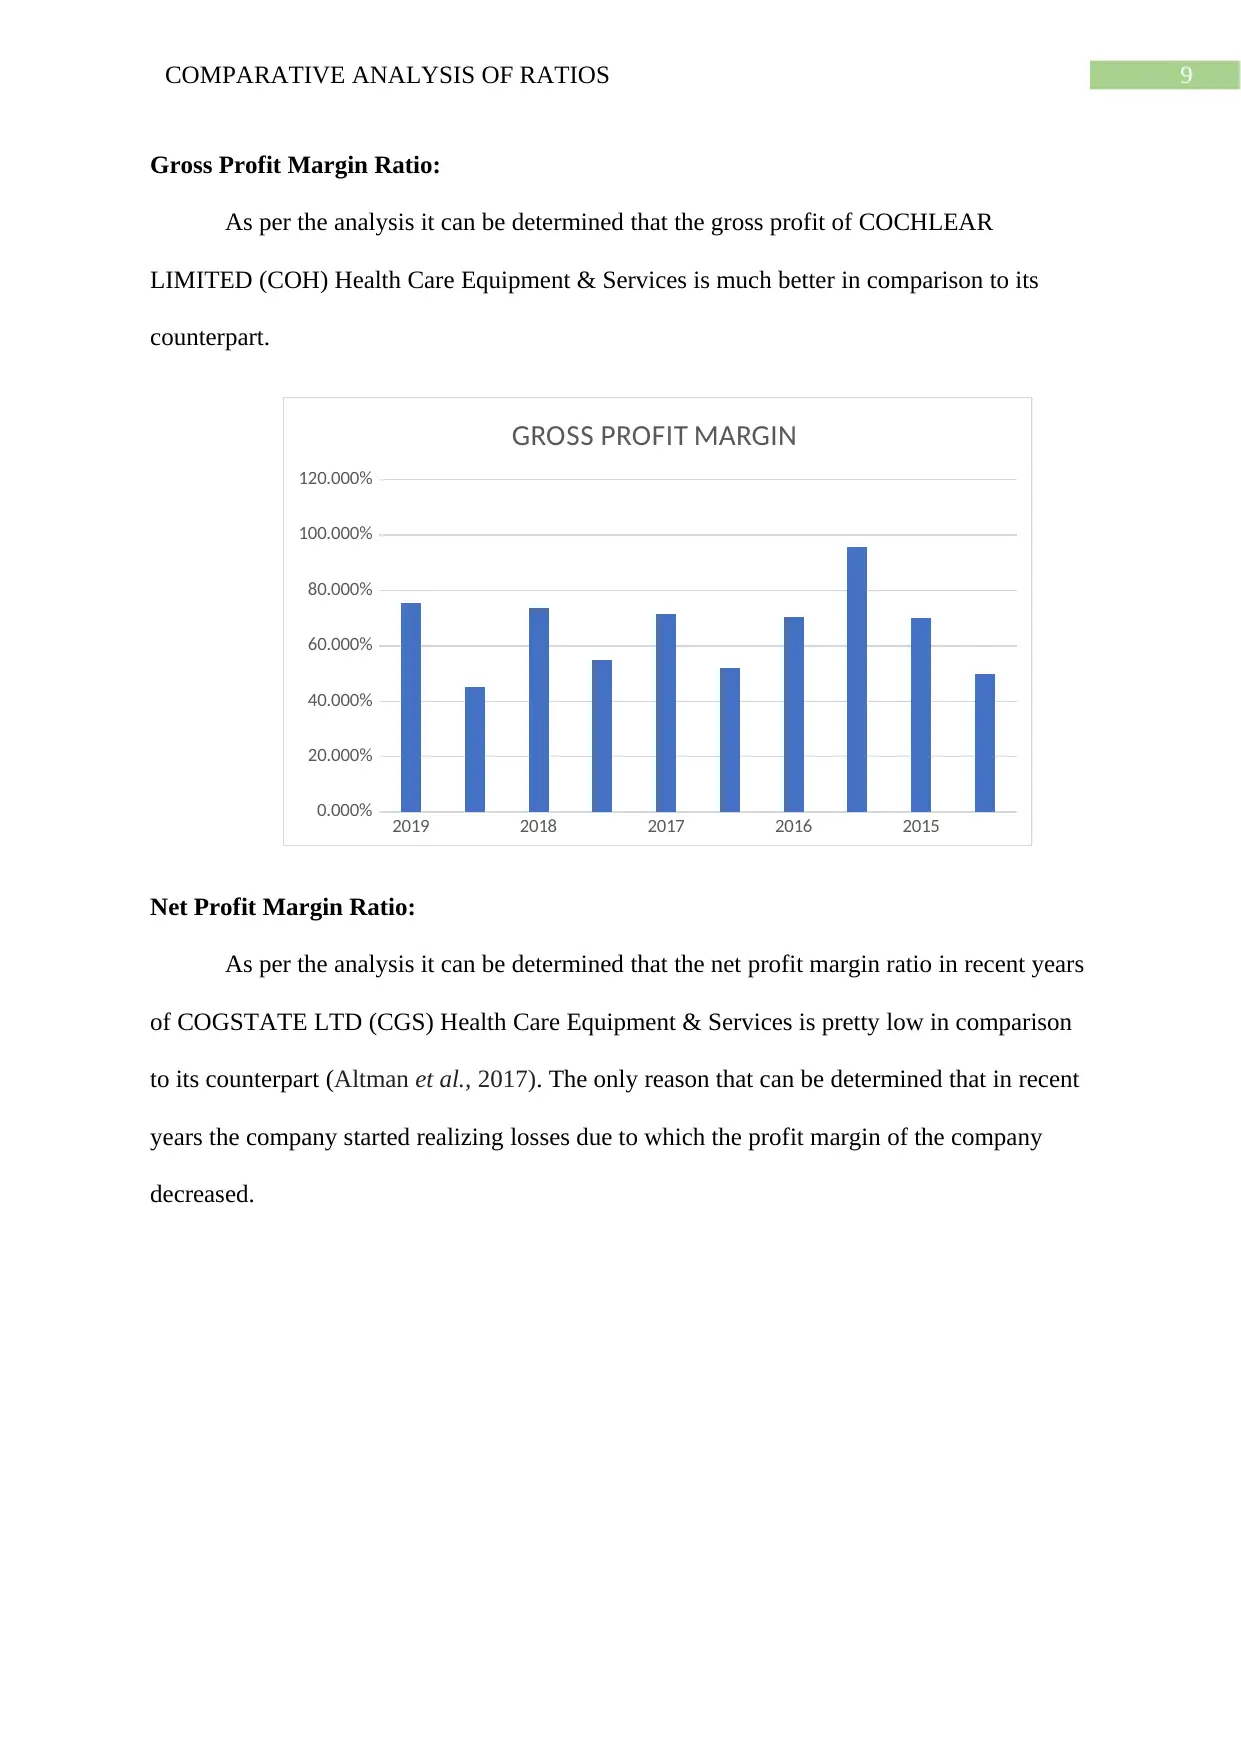
Gross Profit Margin Ratio:
As per the analysis it can be determined that the gross profit of COCHLEAR
LIMITED (COH) Health Care Equipment & Services is much better in comparison to its
counterpart.
2019 2018 2017 2016 2015
0.000%
20.000%
40.000%
60.000%
80.000%
100.000%
120.000%
GROSS PROFIT MARGIN
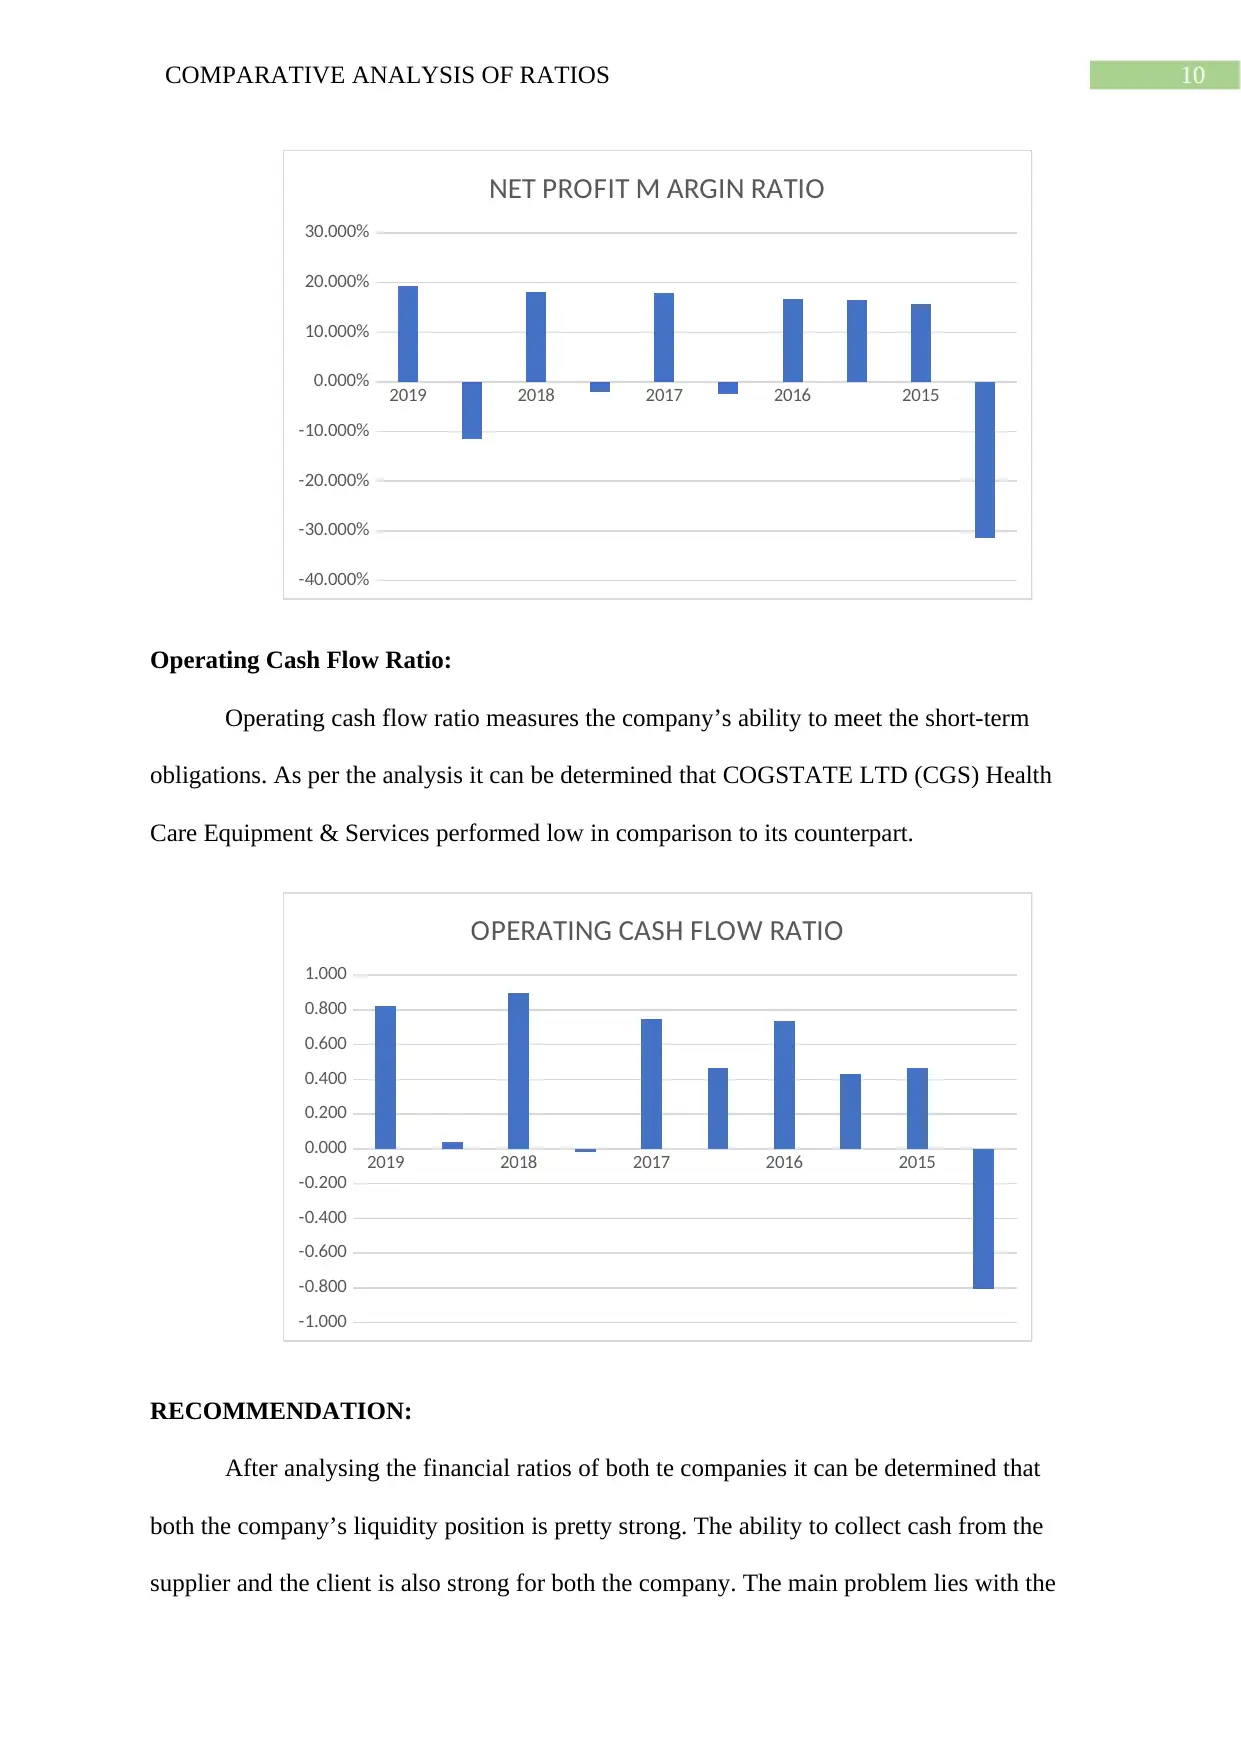
Net Profit Margin Ratio:
As per the analysis it can be determined that the net profit margin ratio in recent years
of COGSTATE LTD (CGS) Health Care Equipment & Services is pretty low in comparison
to its counterpart (Altman et al., 2017). The only reason that can be determined that in recent
years the company started realizing losses due to which the profit margin of the company
decreased.
Gross Profit Margin Ratio:
As per the analysis it can be determined that the gross profit of COCHLEAR
LIMITED (COH) Health Care Equipment & Services is much better in comparison to its
counterpart.
2019 2018 2017 2016 2015
0.000%
20.000%
40.000%
60.000%
80.000%
100.000%
120.000%
GROSS PROFIT MARGIN
Net Profit Margin Ratio:
As per the analysis it can be determined that the net profit margin ratio in recent years
of COGSTATE LTD (CGS) Health Care Equipment & Services is pretty low in comparison
to its counterpart (Altman et al., 2017). The only reason that can be determined that in recent
years the company started realizing losses due to which the profit margin of the company
decreased.
⊘ This is a preview!⊘
Do you want full access?
Subscribe today to unlock all pages.
Trusted by 1+ million students worldwide
10COMPARATIVE ANALYSIS OF RATIOS
2019 2018 2017 2016 2015
-40.000%
-30.000%
-20.000%
-10.000%
0.000%
10.000%
20.000%
30.000%
NET PROFIT M ARGIN RATIO
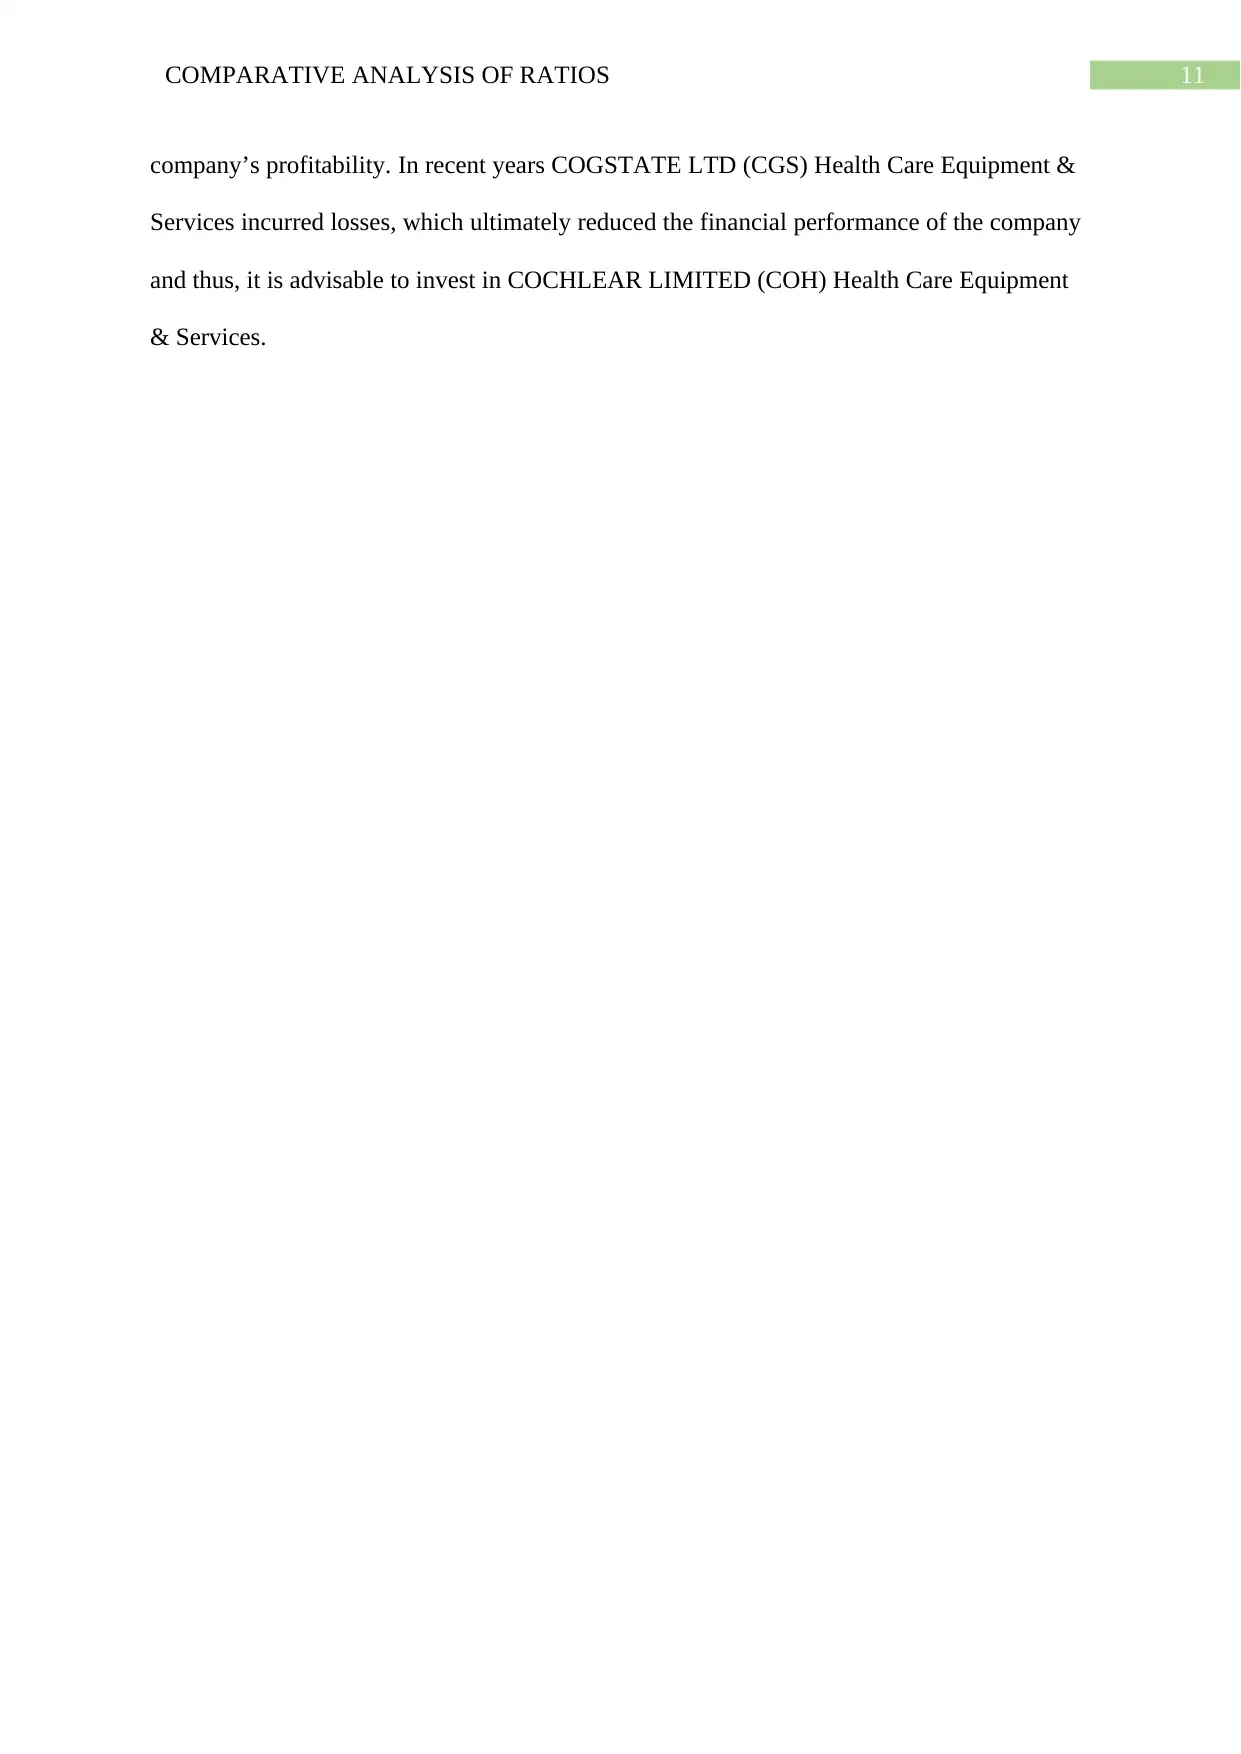
Operating Cash Flow Ratio:
Operating cash flow ratio measures the company’s ability to meet the short-term
obligations. As per the analysis it can be determined that COGSTATE LTD (CGS) Health
Care Equipment & Services performed low in comparison to its counterpart.
2019 2018 2017 2016 2015
-1.000
-0.800
-0.600
-0.400
-0.200
0.000
0.200
0.400
0.600
0.800
1.000
OPERATING CASH FLOW RATIO
RECOMMENDATION:
After analysing the financial ratios of both te companies it can be determined that
both the company’s liquidity position is pretty strong. The ability to collect cash from the
supplier and the client is also strong for both the company. The main problem lies with the
2019 2018 2017 2016 2015
-40.000%
-30.000%
-20.000%
-10.000%
0.000%
10.000%
20.000%
30.000%
NET PROFIT M ARGIN RATIO
Operating Cash Flow Ratio:
Operating cash flow ratio measures the company’s ability to meet the short-term
obligations. As per the analysis it can be determined that COGSTATE LTD (CGS) Health
Care Equipment & Services performed low in comparison to its counterpart.
2019 2018 2017 2016 2015
-1.000
-0.800
-0.600
-0.400
-0.200
0.000
0.200
0.400
0.600
0.800
1.000
OPERATING CASH FLOW RATIO
RECOMMENDATION:
After analysing the financial ratios of both te companies it can be determined that
both the company’s liquidity position is pretty strong. The ability to collect cash from the
supplier and the client is also strong for both the company. The main problem lies with the
Paraphrase This Document
Need a fresh take? Get an instant paraphrase of this document with our AI Paraphraser
11COMPARATIVE ANALYSIS OF RATIOS
company’s profitability. In recent years COGSTATE LTD (CGS) Health Care Equipment &
Services incurred losses, which ultimately reduced the financial performance of the company
and thus, it is advisable to invest in COCHLEAR LIMITED (COH) Health Care Equipment
& Services.
company’s profitability. In recent years COGSTATE LTD (CGS) Health Care Equipment &
Services incurred losses, which ultimately reduced the financial performance of the company
and thus, it is advisable to invest in COCHLEAR LIMITED (COH) Health Care Equipment
& Services.
12COMPARATIVE ANALYSIS OF RATIOS
REFERENCING:
Altman, Edward I., Małgorzata Iwanicz‐Drozdowska, Erkki K. Laitinen, and Arto Suvas.
"Financial distress prediction in an international context: A review and empirical analysis of
Altman's Z‐score model." Journal of International Financial Management & Accounting 28,
no. 2 (2017): 131-171.
http://www.annualreports.com/HostedData/AnnualReportArchive/C/ASX_COH_2017.pdf
http://www.annualreports.com/HostedData/AnnualReportArchive/C/ASX_COH_2016.pdf
http://www.annualreports.com/HostedData/AnnualReportArchive/C/ASX_COH_2017.pdf
http://www.annualreports.com/HostedData/AnnualReports/PDF/ASX_COH_2018.pdf
https://www.cochlear.com/c782c6e8-cd66-402e-87b8-936db9f1fea8/2019AnnualReport.pdf?
MOD=AJPERES&CONVERT_TO=url&CACHEID=ROOTWORKSPACE-
c782c6e8-cd66-402e-87b8-936db9f1fea8-mOnUHj-
https://www.cogstate.com/wp-content/uploads/2016/09/2016-Annual-Report-Web.pdf
https://www.cogstate.com/wp-content/uploads/2018/09/Annual-Report-to-shareholders-21-
Sept-18.pdf
https://www.cogstate.com/wp-content/uploads/2019/10/2019-Annual-Report.pdf
Huang, Yan, and Gang Kou. "A kernel entropy manifold learning approach for financial data
analysis." Decision Support Systems 64 (2014): 31-42.
⊘ This is a preview!⊘
Do you want full access?
Subscribe today to unlock all pages.
Trusted by 1+ million students worldwide
1 out of 12
Related Documents


Your All-in-One AI-Powered Toolkit for Academic Success.
+13062052269
info@desklib.com
Available 24*7 on WhatsApp / Email
![[object Object]](/_next/static/media/star-bottom.7253800d.svg)
Unlock your academic potential
© 2024 | Zucol Services PVT LTD | All rights reserved.