Comparison of Two London Stock Exchange Companies: Finance Report
VerifiedAdded on 2020/11/23
|11
|2721
|368
Report
AI Summary
This report presents a detailed financial comparison of The Go-Ahead Group Plc and Barratt Developments Plc, both listed on the London Stock Exchange. The analysis employs ratio analysis, including liquidity, profitability, and financial leverage ratios, to evaluate their financial performance over three years. The report assesses key financial aspects such as current and quick ratios, net and gross profit margins, and debt-to-equity and debt-to-total-assets ratios. The findings highlight the companies' strengths and weaknesses, providing insights into their financial positions and performance trends. Furthermore, the report examines financial and non-financial factors influencing the companies, such as inflation, government regulations, and technological changes, to offer a comprehensive understanding of their operational environments. The conclusion emphasizes the importance of comparative financial analysis for informed decision-making, particularly for investment purposes.

Comparison Of Two
London Stock Exchange
Companies
1
London Stock Exchange
Companies
1
Paraphrase This Document
Need a fresh take? Get an instant paraphrase of this document with our AI Paraphraser
Table of Contents
INTRODUCTION...........................................................................................................................3
TASK...............................................................................................................................................3
1. Overview of Companies: ........................................................................................................3
2. Analysis:..................................................................................................................................4
3. Performance Factors:...............................................................................................................8
CONCLUSION................................................................................................................................9
REFERENCES ............................................................................................................................10
APPENDICES...............................................................................................................................12
2
INTRODUCTION
A Listed company refers to company whose share are trading on an authorised or official
stock exchange. Financial comparison between two or more listed companies are required to take
signifiant investment decisions. Such comparative analysis is vital to choose best appropriate
company out of several alternatives (Edwards, 2013). Comparison is done by covering various
financial aspects like accounting ratios, views of company's shareholders to evaluate financial
performance and financial position of different companies. This report describes a financial
comparison of two listed companies: The Go-Ahead Group Plc and Barratt Developments Plc.
Both these companies are belongs to different sectors but listed on same stock exchange. This
report also covers discussion on financial and non-financial factors that may affect these
companies' performance.
TASK
1. Overview of Companies:
The GO-Ahead Group Plc belongs to Travel & Leisure service sector and provider of
passenger transport in United Kingdom. Company provides transportation services through three
segments: Local Bus services, London Bus services and Rail. Company is also engaged in
offering rail replacements and other contracts based services. Company's bus segment provides
deregulated services in North East, south east, southern England and regulated services in
London.
Barratt Developments Plc is UK's one of the leading residential property development
company and operating its business through approx 30 Divisions. Company is engaged in
purchase or acquisition of lands, accessing planning consents and construction of rich quality
homes. Company builds and constructs rich quality homes as per criteria of rating of HBF five
star. Company's key operation is construction of residential house and commercial buildings in
UK.
2. Analysis:
Generally financial analytical tool is use by business organisations for analysis of various
financial and non-financial aspects. Most popular and widely used tool for financial analysis is
Ratio analysis (Fourie, 2015). It is a systematic formula based financial analytical tool in which
various ratios are calculated by business organisation to measure liquidity position, profitability
3
⊘ This is a preview!⊘
Do you want full access?
Subscribe today to unlock all pages.
Trusted by 1+ million students worldwide
condition, leverage of firm etc. These accounting ratios are calculated by using data of annual
report and financial statements. Ratio analysis provides a comparison of performance of
company in related industry and helps to determine year to year performance of company. Ratio
analysis also provide a framework for comparison of two or more companies concerned with
different-different industries. As Go-Ahead Group Plc and Barratt Developments Plc are two
different sector companies but through ratio analysis shareholder can evaluate companies'
performance and take decision regarding purchase or sell of securities. Accounting ratios are
further classified as: Liquidity ratios, Asset Turnover ratios, Financial Leverage ratios,
Profitability ratios and Dividend policy ratio. Following are various accounting ratios for three
years of selected companies, as follows:
I. Liquidity Ratios: It refers to accounting ratios that points out towards a business organisation'
ability to pay its current liabilities or obligations. These ratios helps to describes liquidity
position of company. Following are the major liquidity ratio:
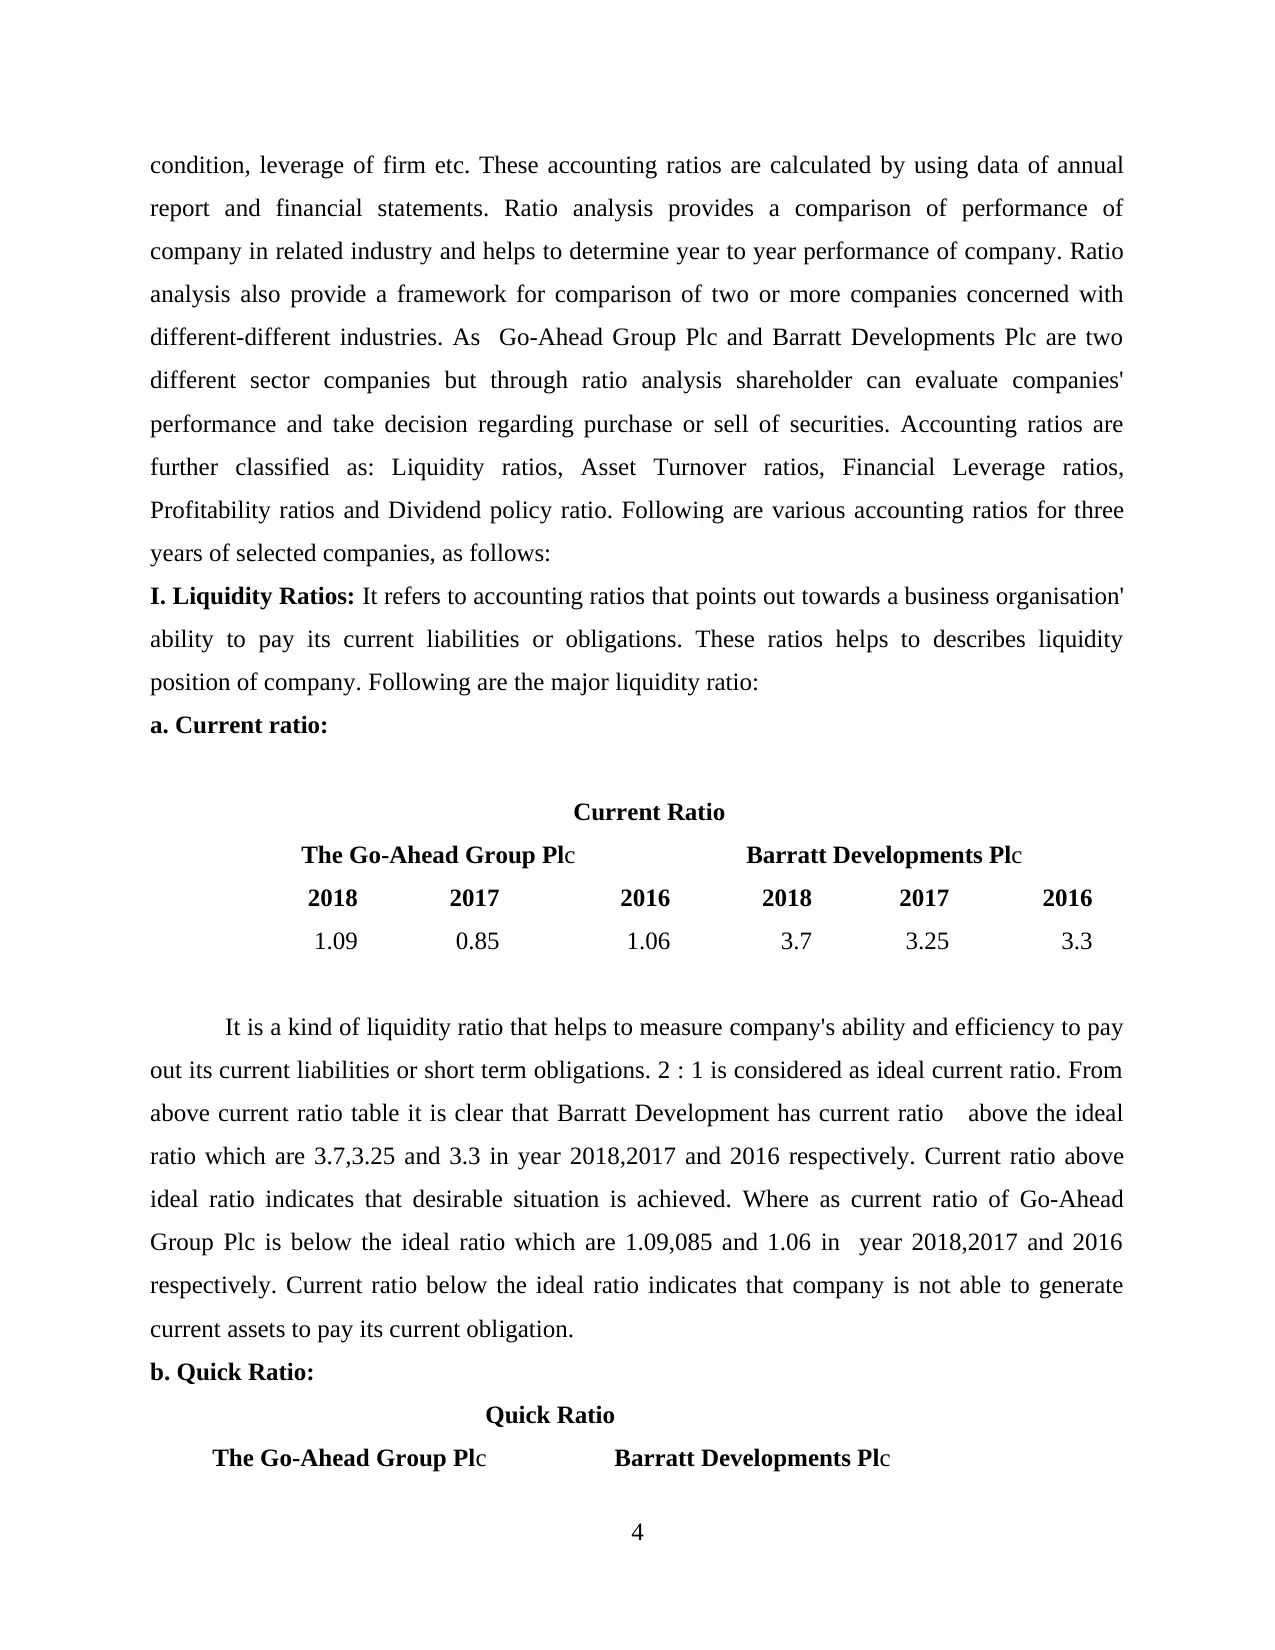
a. Current ratio:
Current Ratio
The Go-Ahead Group Plc Barratt Developments Plc
2018 2017 2016 2018 2017 2016
1.09 0.85 1.06 3.7 3.25 3.3
It is a kind of liquidity ratio that helps to measure company's ability and efficiency to pay
out its current liabilities or short term obligations. 2 : 1 is considered as ideal current ratio. From
above current ratio table it is clear that Barratt Development has current ratio above the ideal
ratio which are 3.7,3.25 and 3.3 in year 2018,2017 and 2016 respectively. Current ratio above
ideal ratio indicates that desirable situation is achieved. Where as current ratio of Go-Ahead
Group Plc is below the ideal ratio which are 1.09,085 and 1.06 in year 2018,2017 and 2016
respectively. Current ratio below the ideal ratio indicates that company is not able to generate
current assets to pay its current obligation.
b. Quick Ratio:
Quick Ratio
The Go-Ahead Group Plc Barratt Developments Plc
4
report and financial statements. Ratio analysis provides a comparison of performance of
company in related industry and helps to determine year to year performance of company. Ratio
analysis also provide a framework for comparison of two or more companies concerned with
different-different industries. As Go-Ahead Group Plc and Barratt Developments Plc are two
different sector companies but through ratio analysis shareholder can evaluate companies'
performance and take decision regarding purchase or sell of securities. Accounting ratios are
further classified as: Liquidity ratios, Asset Turnover ratios, Financial Leverage ratios,
Profitability ratios and Dividend policy ratio. Following are various accounting ratios for three
years of selected companies, as follows:
I. Liquidity Ratios: It refers to accounting ratios that points out towards a business organisation'
ability to pay its current liabilities or obligations. These ratios helps to describes liquidity
position of company. Following are the major liquidity ratio:
a. Current ratio:
Current Ratio
The Go-Ahead Group Plc Barratt Developments Plc
2018 2017 2016 2018 2017 2016
1.09 0.85 1.06 3.7 3.25 3.3
It is a kind of liquidity ratio that helps to measure company's ability and efficiency to pay
out its current liabilities or short term obligations. 2 : 1 is considered as ideal current ratio. From
above current ratio table it is clear that Barratt Development has current ratio above the ideal
ratio which are 3.7,3.25 and 3.3 in year 2018,2017 and 2016 respectively. Current ratio above
ideal ratio indicates that desirable situation is achieved. Where as current ratio of Go-Ahead
Group Plc is below the ideal ratio which are 1.09,085 and 1.06 in year 2018,2017 and 2016
respectively. Current ratio below the ideal ratio indicates that company is not able to generate
current assets to pay its current obligation.
b. Quick Ratio:
Quick Ratio
The Go-Ahead Group Plc Barratt Developments Plc
4
Paraphrase This Document
Need a fresh take? Get an instant paraphrase of this document with our AI Paraphraser
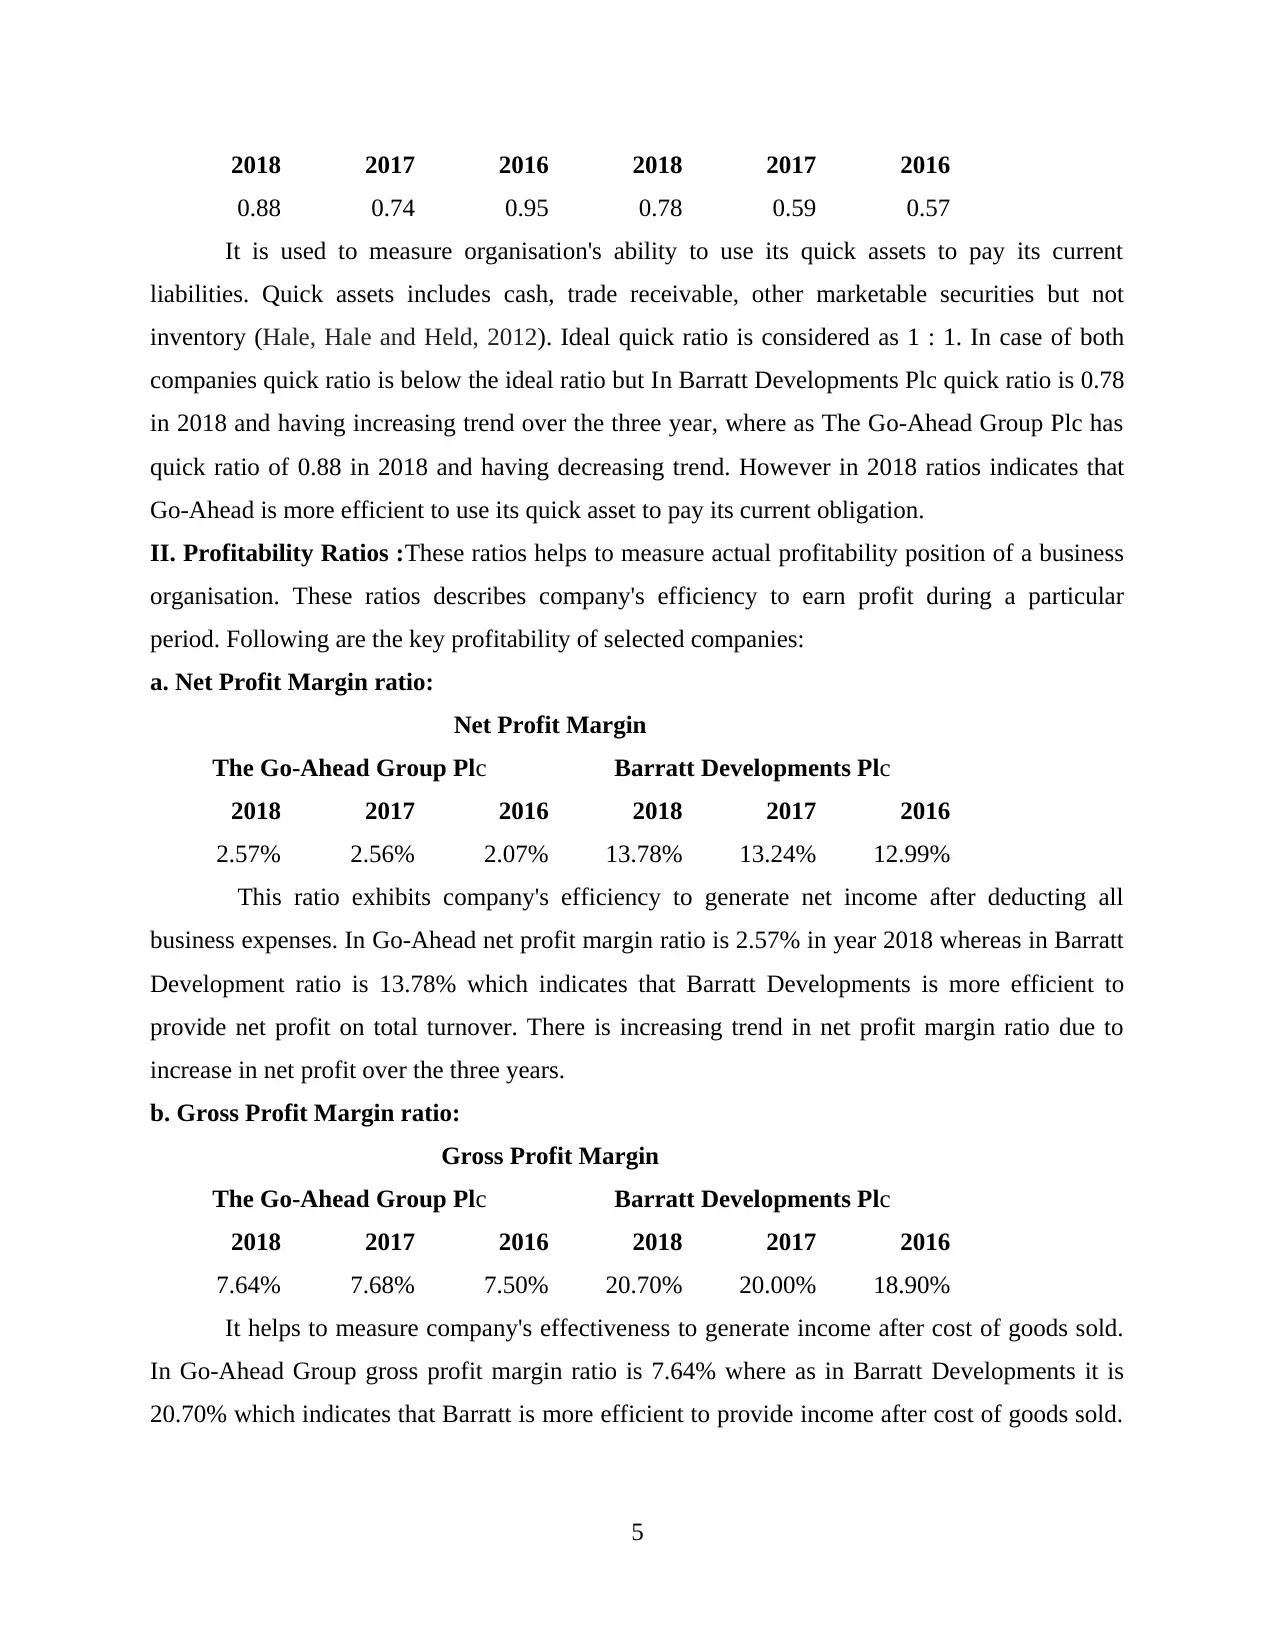
2018 2017 2016 2018 2017 2016
0.88 0.74 0.95 0.78 0.59 0.57
It is used to measure organisation's ability to use its quick assets to pay its current
liabilities. Quick assets includes cash, trade receivable, other marketable securities but not
inventory (Hale, Hale and Held, 2012). Ideal quick ratio is considered as 1 : 1. In case of both
companies quick ratio is below the ideal ratio but In Barratt Developments Plc quick ratio is 0.78
in 2018 and having increasing trend over the three year, where as The Go-Ahead Group Plc has
quick ratio of 0.88 in 2018 and having decreasing trend. However in 2018 ratios indicates that
Go-Ahead is more efficient to use its quick asset to pay its current obligation.
II. Profitability Ratios :These ratios helps to measure actual profitability position of a business
organisation. These ratios describes company's efficiency to earn profit during a particular
period. Following are the key profitability of selected companies:
a. Net Profit Margin ratio:
Net Profit Margin
The Go-Ahead Group Plc Barratt Developments Plc
2018 2017 2016 2018 2017 2016
2.57% 2.56% 2.07% 13.78% 13.24% 12.99%
This ratio exhibits company's efficiency to generate net income after deducting all
business expenses. In Go-Ahead net profit margin ratio is 2.57% in year 2018 whereas in Barratt
Development ratio is 13.78% which indicates that Barratt Developments is more efficient to
provide net profit on total turnover. There is increasing trend in net profit margin ratio due to
increase in net profit over the three years.
b. Gross Profit Margin ratio:
Gross Profit Margin
The Go-Ahead Group Plc Barratt Developments Plc
2018 2017 2016 2018 2017 2016
7.64% 7.68% 7.50% 20.70% 20.00% 18.90%
It helps to measure company's effectiveness to generate income after cost of goods sold.
In Go-Ahead Group gross profit margin ratio is 7.64% where as in Barratt Developments it is
20.70% which indicates that Barratt is more efficient to provide income after cost of goods sold.
5
There is slightly decrease in gross profit of Go-Ahead in 2018. But in Barratt there is upward
trend in gross profit ratio.
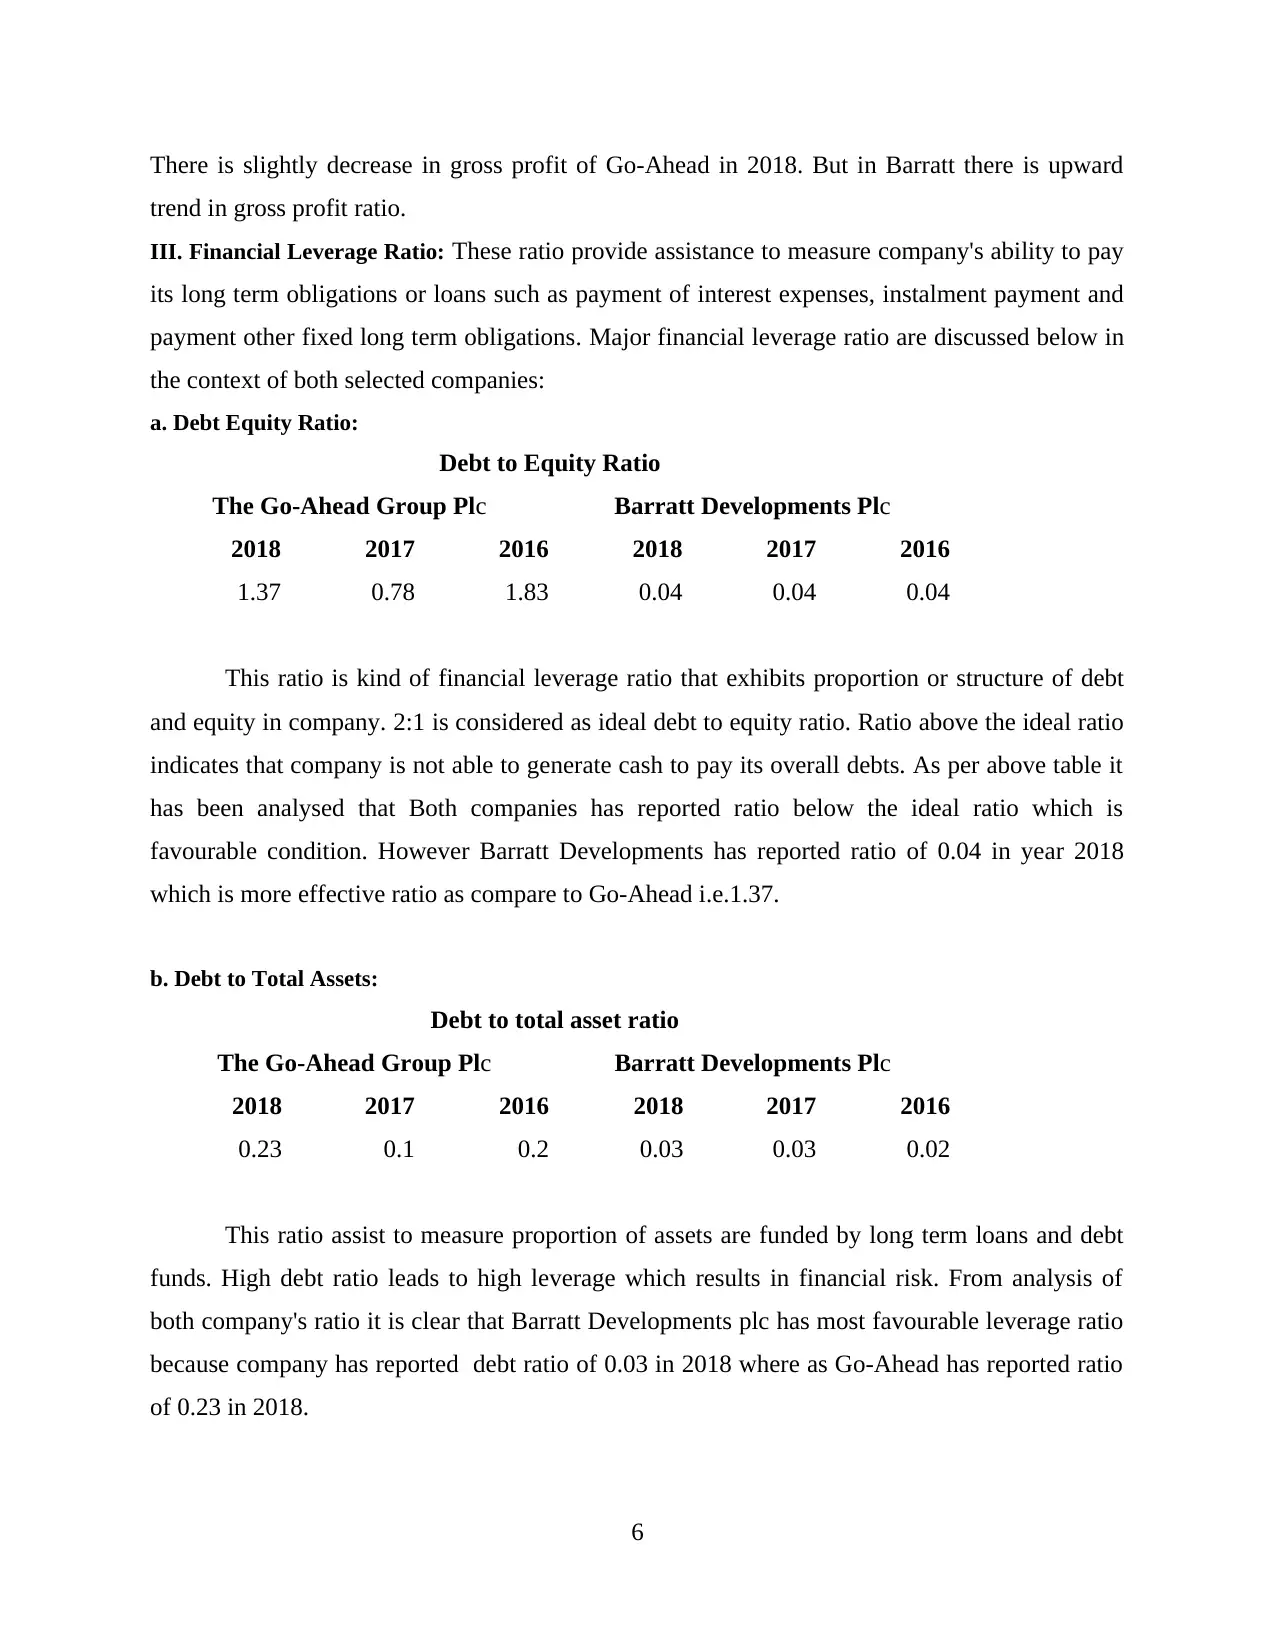
III. Financial Leverage Ratio: These ratio provide assistance to measure company's ability to pay
its long term obligations or loans such as payment of interest expenses, instalment payment and
payment other fixed long term obligations. Major financial leverage ratio are discussed below in
the context of both selected companies:
a. Debt Equity Ratio:
Debt to Equity Ratio
The Go-Ahead Group Plc Barratt Developments Plc
2018 2017 2016 2018 2017 2016
1.37 0.78 1.83 0.04 0.04 0.04
This ratio is kind of financial leverage ratio that exhibits proportion or structure of debt
and equity in company. 2:1 is considered as ideal debt to equity ratio. Ratio above the ideal ratio
indicates that company is not able to generate cash to pay its overall debts. As per above table it
has been analysed that Both companies has reported ratio below the ideal ratio which is
favourable condition. However Barratt Developments has reported ratio of 0.04 in year 2018
which is more effective ratio as compare to Go-Ahead i.e.1.37.
b. Debt to Total Assets:
Debt to total asset ratio
The Go-Ahead Group Plc Barratt Developments Plc
2018 2017 2016 2018 2017 2016
0.23 0.1 0.2 0.03 0.03 0.02
This ratio assist to measure proportion of assets are funded by long term loans and debt
funds. High debt ratio leads to high leverage which results in financial risk. From analysis of
both company's ratio it is clear that Barratt Developments plc has most favourable leverage ratio
because company has reported debt ratio of 0.03 in 2018 where as Go-Ahead has reported ratio
of 0.23 in 2018.
6
trend in gross profit ratio.
III. Financial Leverage Ratio: These ratio provide assistance to measure company's ability to pay
its long term obligations or loans such as payment of interest expenses, instalment payment and
payment other fixed long term obligations. Major financial leverage ratio are discussed below in
the context of both selected companies:
a. Debt Equity Ratio:
Debt to Equity Ratio
The Go-Ahead Group Plc Barratt Developments Plc
2018 2017 2016 2018 2017 2016
1.37 0.78 1.83 0.04 0.04 0.04
This ratio is kind of financial leverage ratio that exhibits proportion or structure of debt
and equity in company. 2:1 is considered as ideal debt to equity ratio. Ratio above the ideal ratio
indicates that company is not able to generate cash to pay its overall debts. As per above table it
has been analysed that Both companies has reported ratio below the ideal ratio which is
favourable condition. However Barratt Developments has reported ratio of 0.04 in year 2018
which is more effective ratio as compare to Go-Ahead i.e.1.37.
b. Debt to Total Assets:
Debt to total asset ratio
The Go-Ahead Group Plc Barratt Developments Plc
2018 2017 2016 2018 2017 2016
0.23 0.1 0.2 0.03 0.03 0.02
This ratio assist to measure proportion of assets are funded by long term loans and debt
funds. High debt ratio leads to high leverage which results in financial risk. From analysis of
both company's ratio it is clear that Barratt Developments plc has most favourable leverage ratio
because company has reported debt ratio of 0.03 in 2018 where as Go-Ahead has reported ratio
of 0.23 in 2018.
6
⊘ This is a preview!⊘
Do you want full access?
Subscribe today to unlock all pages.
Trusted by 1+ million students worldwide
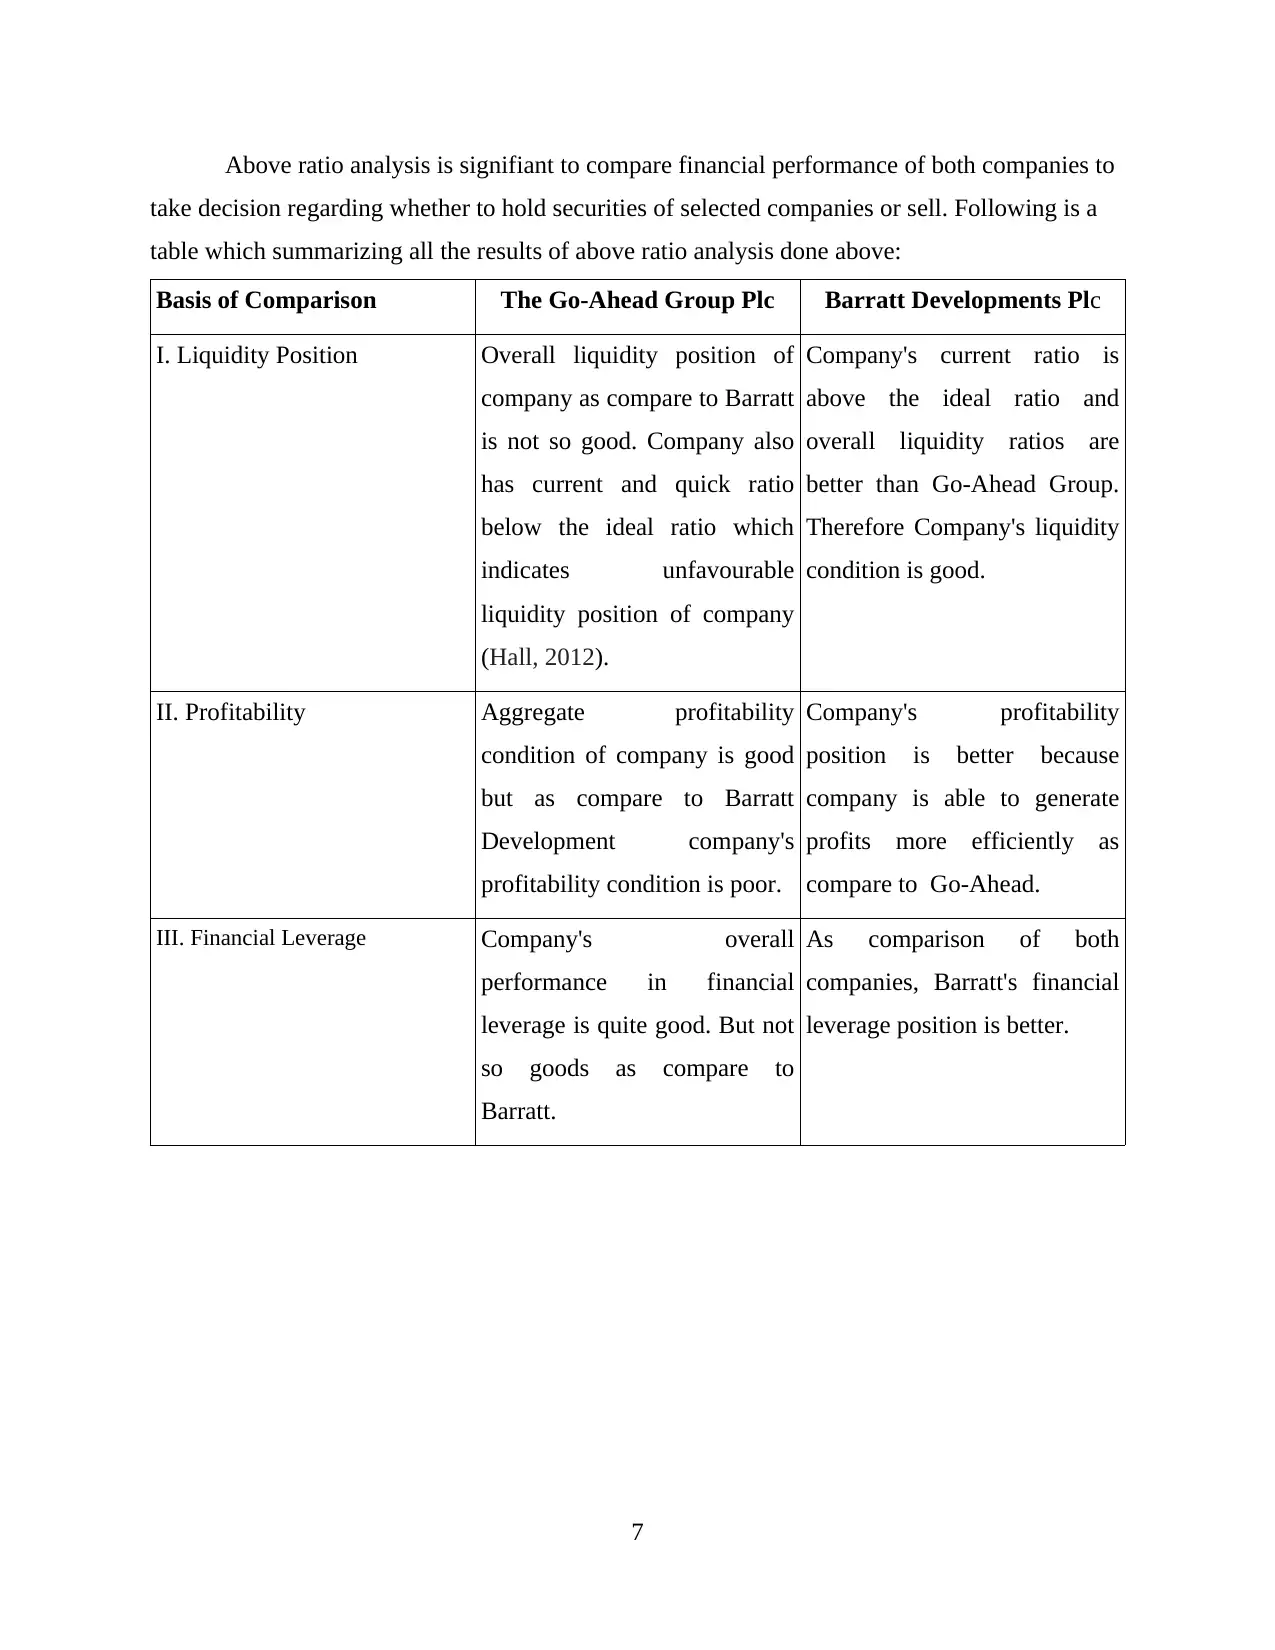
Above ratio analysis is signifiant to compare financial performance of both companies to
take decision regarding whether to hold securities of selected companies or sell. Following is a
table which summarizing all the results of above ratio analysis done above:
Basis of Comparison The Go-Ahead Group Plc Barratt Developments Plc
I. Liquidity Position Overall liquidity position of
company as compare to Barratt
is not so good. Company also
has current and quick ratio
below the ideal ratio which
indicates unfavourable
liquidity position of company
(Hall, 2012).
Company's current ratio is
above the ideal ratio and
overall liquidity ratios are
better than Go-Ahead Group.
Therefore Company's liquidity
condition is good.
II. Profitability Aggregate profitability
condition of company is good
but as compare to Barratt
Development company's
profitability condition is poor.
Company's profitability
position is better because
company is able to generate
profits more efficiently as
compare to Go-Ahead.
III. Financial Leverage Company's overall
performance in financial
leverage is quite good. But not
so goods as compare to
Barratt.
As comparison of both
companies, Barratt's financial
leverage position is better.
7
Paraphrase This Document
Need a fresh take? Get an instant paraphrase of this document with our AI Paraphraser
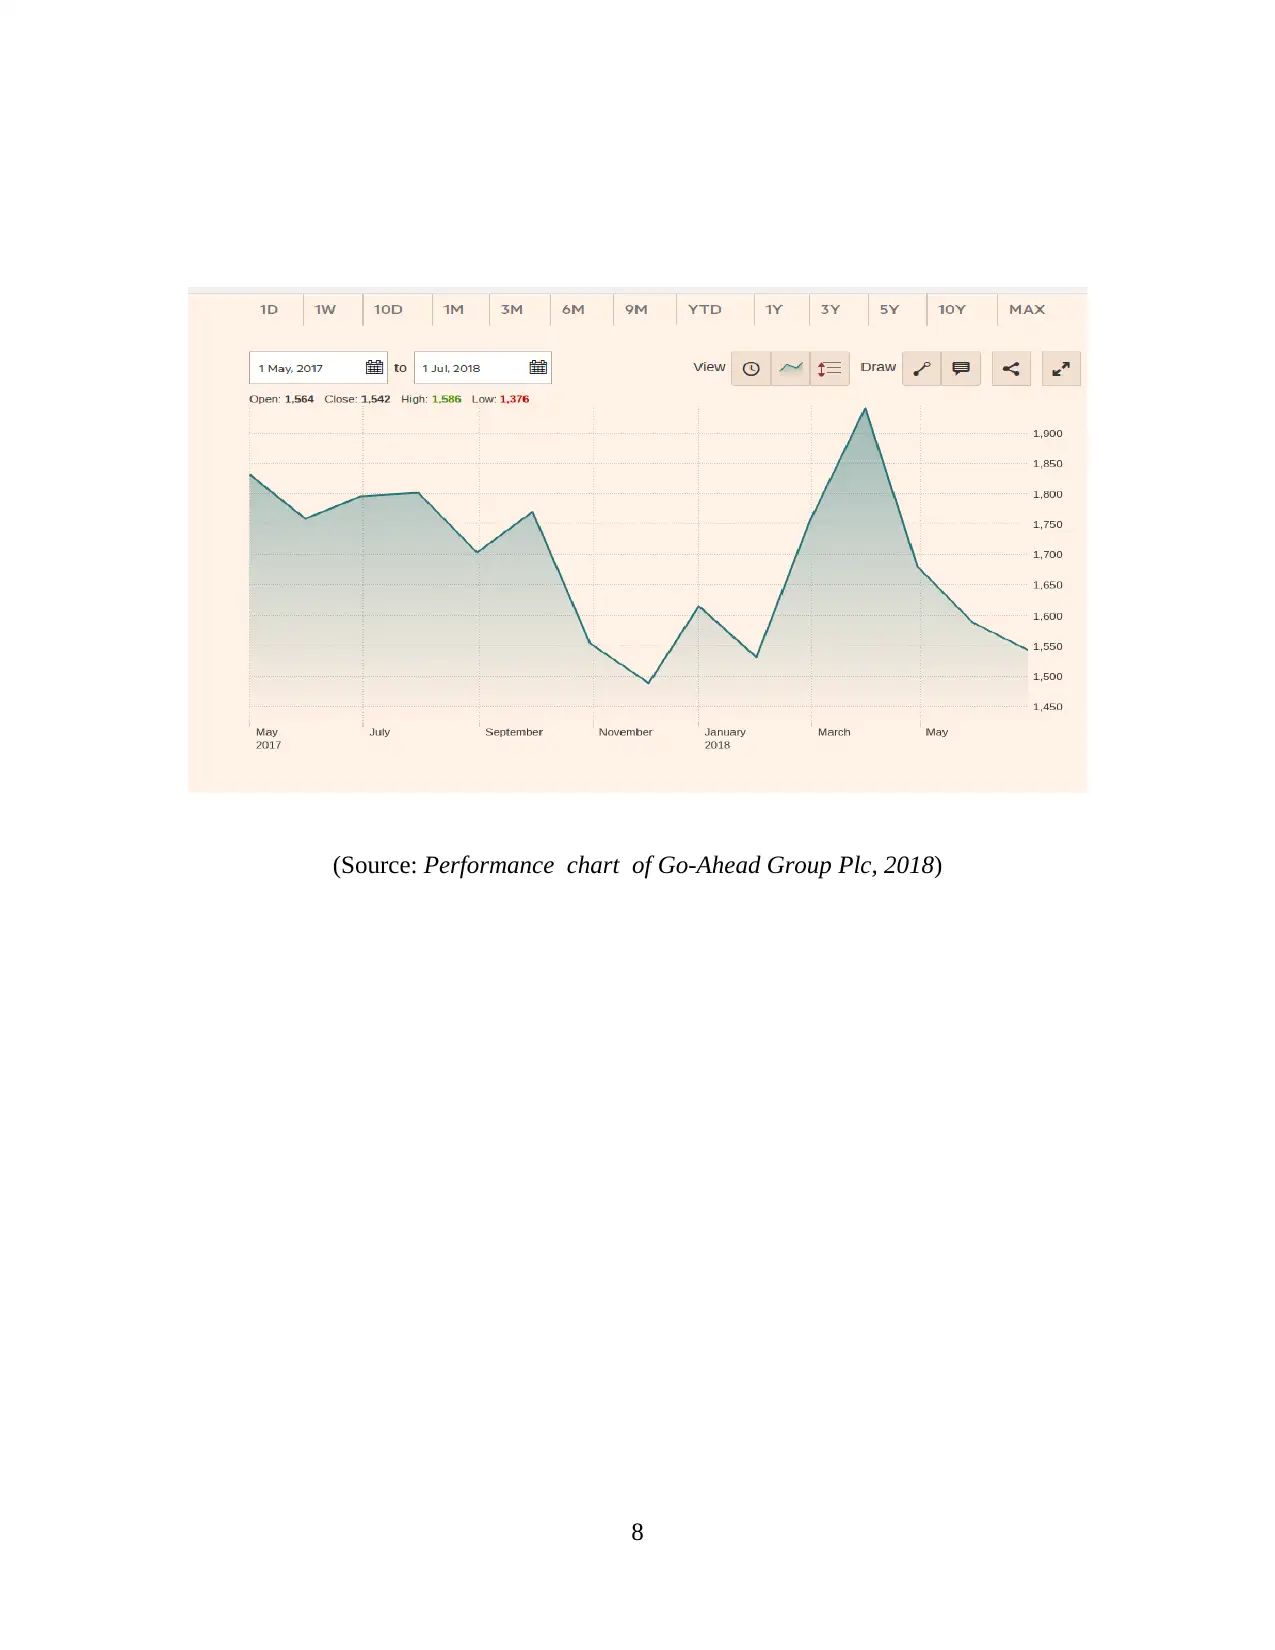
(Source: Performance chart of Go-Ahead Group Plc, 2018)
8
8
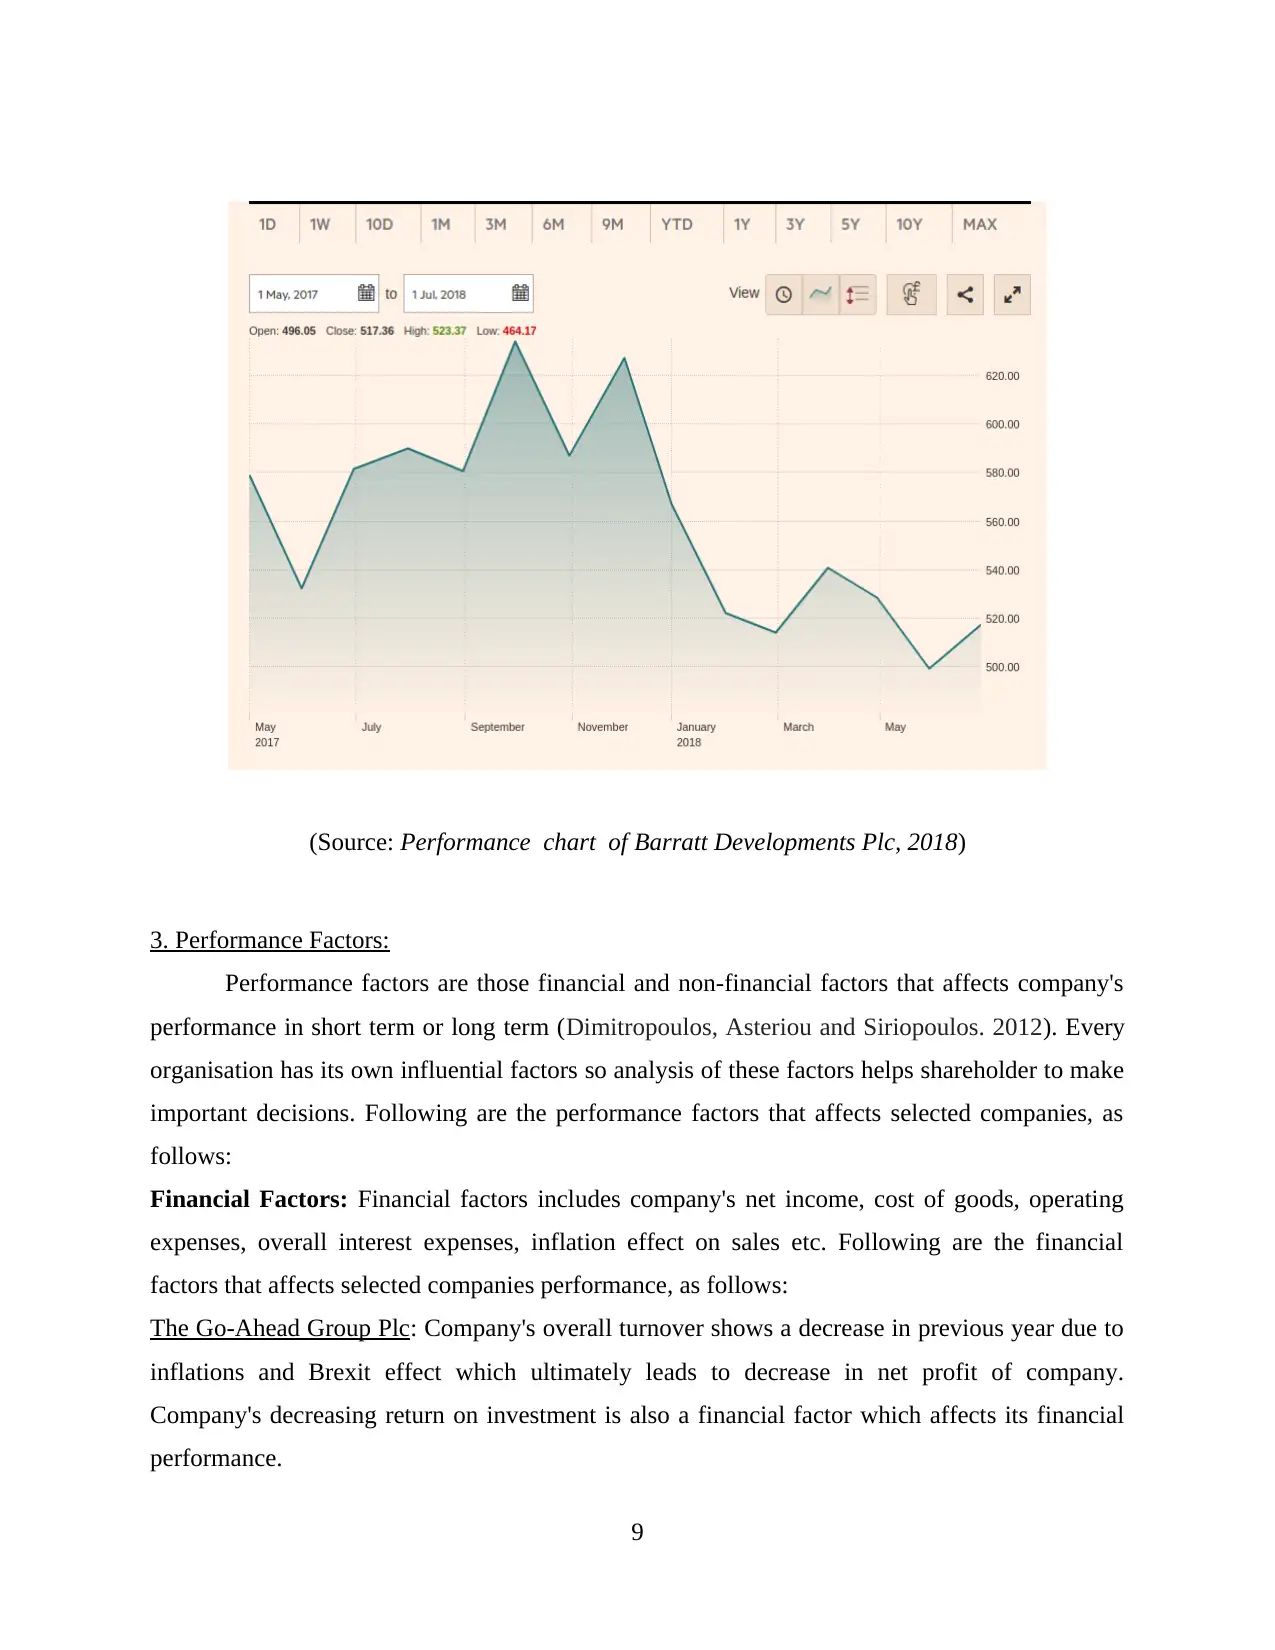
(Source: Performance chart of Barratt Developments Plc, 2018)
3. Performance Factors:
Performance factors are those financial and non-financial factors that affects company's
performance in short term or long term (Dimitropoulos, Asteriou and Siriopoulos. 2012). Every
organisation has its own influential factors so analysis of these factors helps shareholder to make
important decisions. Following are the performance factors that affects selected companies, as
follows:
Financial Factors: Financial factors includes company's net income, cost of goods, operating
expenses, overall interest expenses, inflation effect on sales etc. Following are the financial
factors that affects selected companies performance, as follows:
The Go-Ahead Group Plc: Company's overall turnover shows a decrease in previous year due to
inflations and Brexit effect which ultimately leads to decrease in net profit of company.
Company's decreasing return on investment is also a financial factor which affects its financial
performance.
9
⊘ This is a preview!⊘
Do you want full access?
Subscribe today to unlock all pages.
Trusted by 1+ million students worldwide
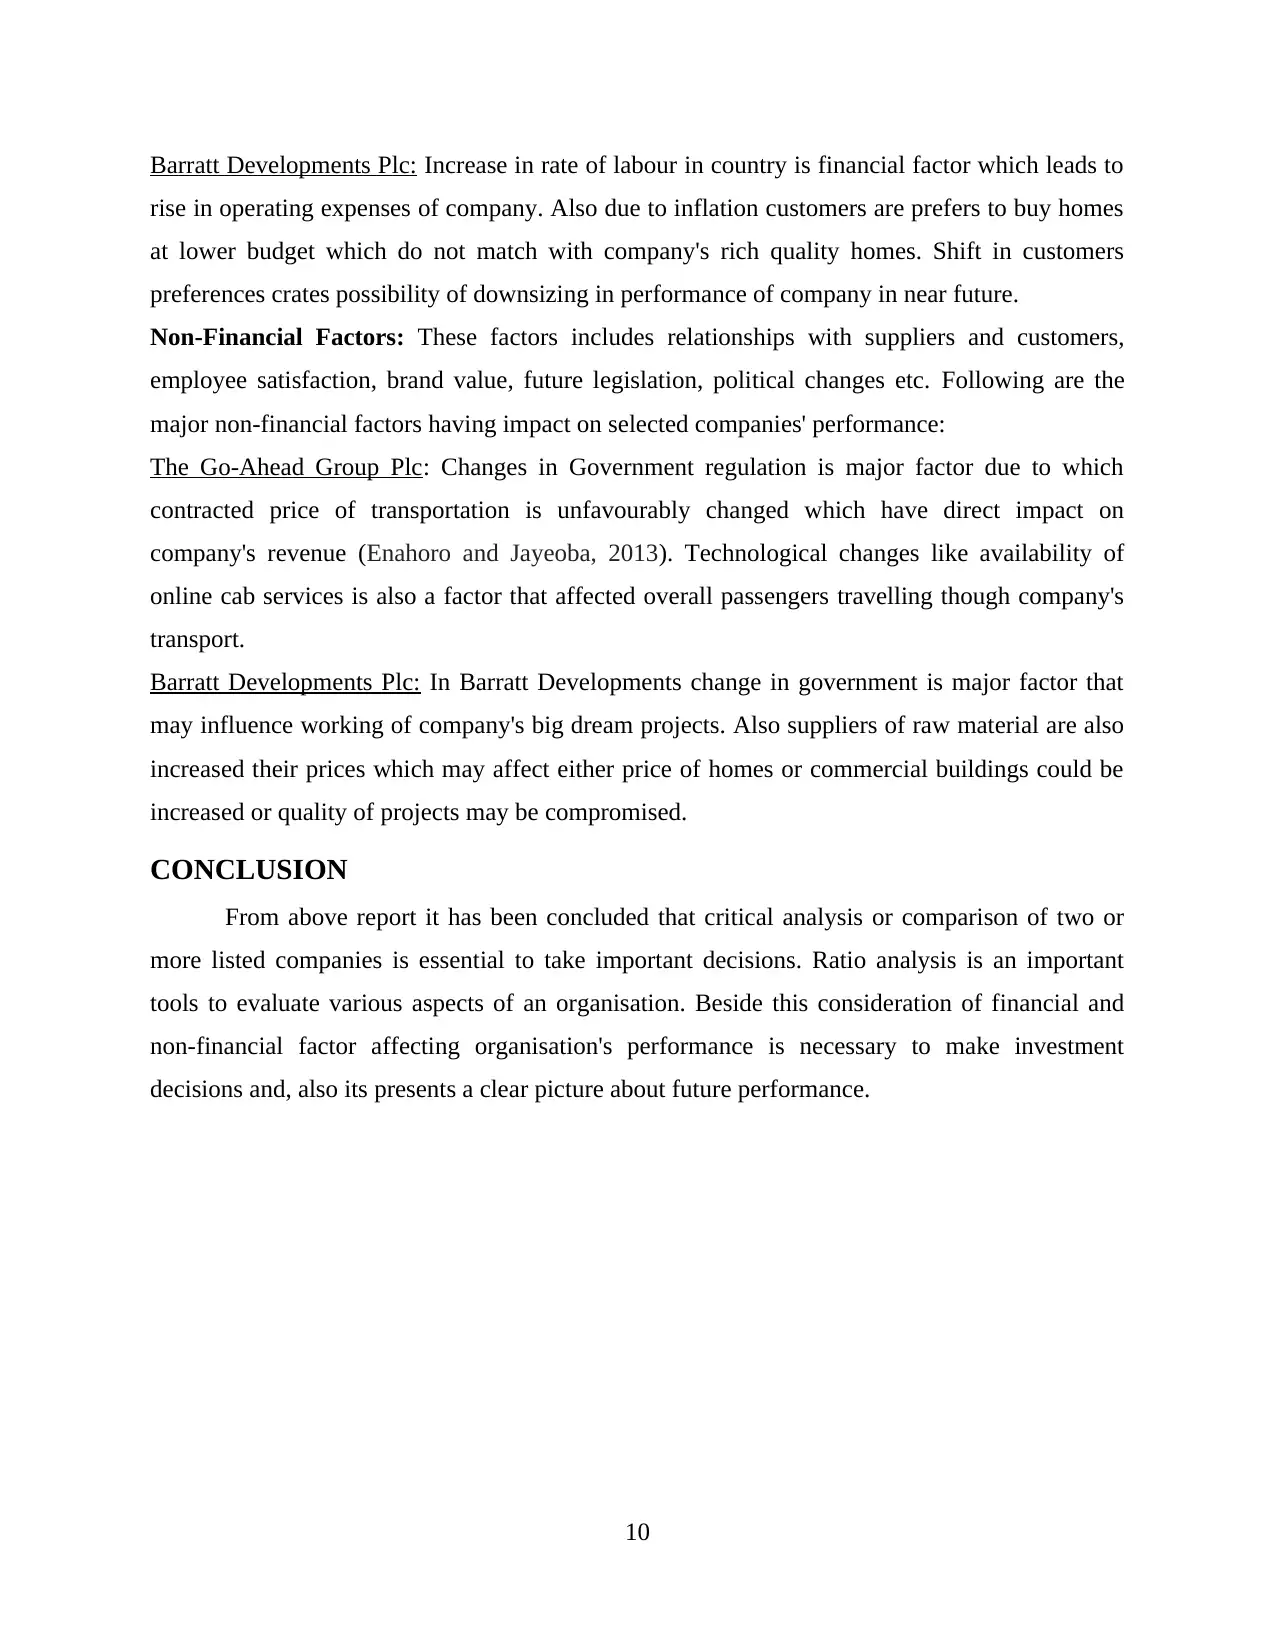
Barratt Developments Plc: Increase in rate of labour in country is financial factor which leads to
rise in operating expenses of company. Also due to inflation customers are prefers to buy homes
at lower budget which do not match with company's rich quality homes. Shift in customers
preferences crates possibility of downsizing in performance of company in near future.
Non-Financial Factors: These factors includes relationships with suppliers and customers,
employee satisfaction, brand value, future legislation, political changes etc. Following are the
major non-financial factors having impact on selected companies' performance:
The Go-Ahead Group Plc: Changes in Government regulation is major factor due to which
contracted price of transportation is unfavourably changed which have direct impact on
company's revenue (Enahoro and Jayeoba, 2013). Technological changes like availability of
online cab services is also a factor that affected overall passengers travelling though company's
transport.
Barratt Developments Plc: In Barratt Developments change in government is major factor that
may influence working of company's big dream projects. Also suppliers of raw material are also
increased their prices which may affect either price of homes or commercial buildings could be
increased or quality of projects may be compromised.
CONCLUSION
From above report it has been concluded that critical analysis or comparison of two or
more listed companies is essential to take important decisions. Ratio analysis is an important
tools to evaluate various aspects of an organisation. Beside this consideration of financial and
non-financial factor affecting organisation's performance is necessary to make investment
decisions and, also its presents a clear picture about future performance.
10
Paraphrase This Document
Need a fresh take? Get an instant paraphrase of this document with our AI Paraphraser
REFERENCES
Books and Journals:
Edwards, J. R., 2013. A History of Financial Accounting (RLE Accounting). Routledge.
Fourie, M. L., and et. al., 2015. Municipal finance and accounting. Van Schaik Publishers.
Hale, T. N., Hale, T. and Held, D. eds., 2012. Handbook of transnational governance. Polity.
Hall, J. A., 2012. Accounting information systems. Cengage Learning.
Dimitropoulos, P. E., Asteriou, D., & Siriopoulos, C. (2012). Euro adoption and the quality of
accounting information. Managerial Auditing Journal. 27(3). 299-328.
Enahoro, J. A., & Jayeoba, J. (2013). Value measurement and disclosures in fair value
accounting. Asian Economic and Financial Review. 3(9). 1170.
Online
Performance chart of Barratt Developments Plc, 2018. (Online). Available
through<https://markets.ft.com/data/equities/tearsheet/charts?s=BDEV:LSE>
Performance chart of Go-Ahead Group Plc, 2018. (Online). Available
through<https://markets.ft.com/data/equities/tearsheet/charts?s=GOG:LSE>
11
1 out of 11
Related Documents


Your All-in-One AI-Powered Toolkit for Academic Success.
+13062052269
info@desklib.com
Available 24*7 on WhatsApp / Email
![[object Object]](/_next/static/media/star-bottom.7253800d.svg)
Unlock your academic potential
Copyright © 2020–2026 A2Z Services. All Rights Reserved. Developed and managed by ZUCOL.