University of [University Name] EAT216 CAE Referred Coursework Report

Verified

Added on  2022/10/04

|7
|434
|18
Report
AI Summary
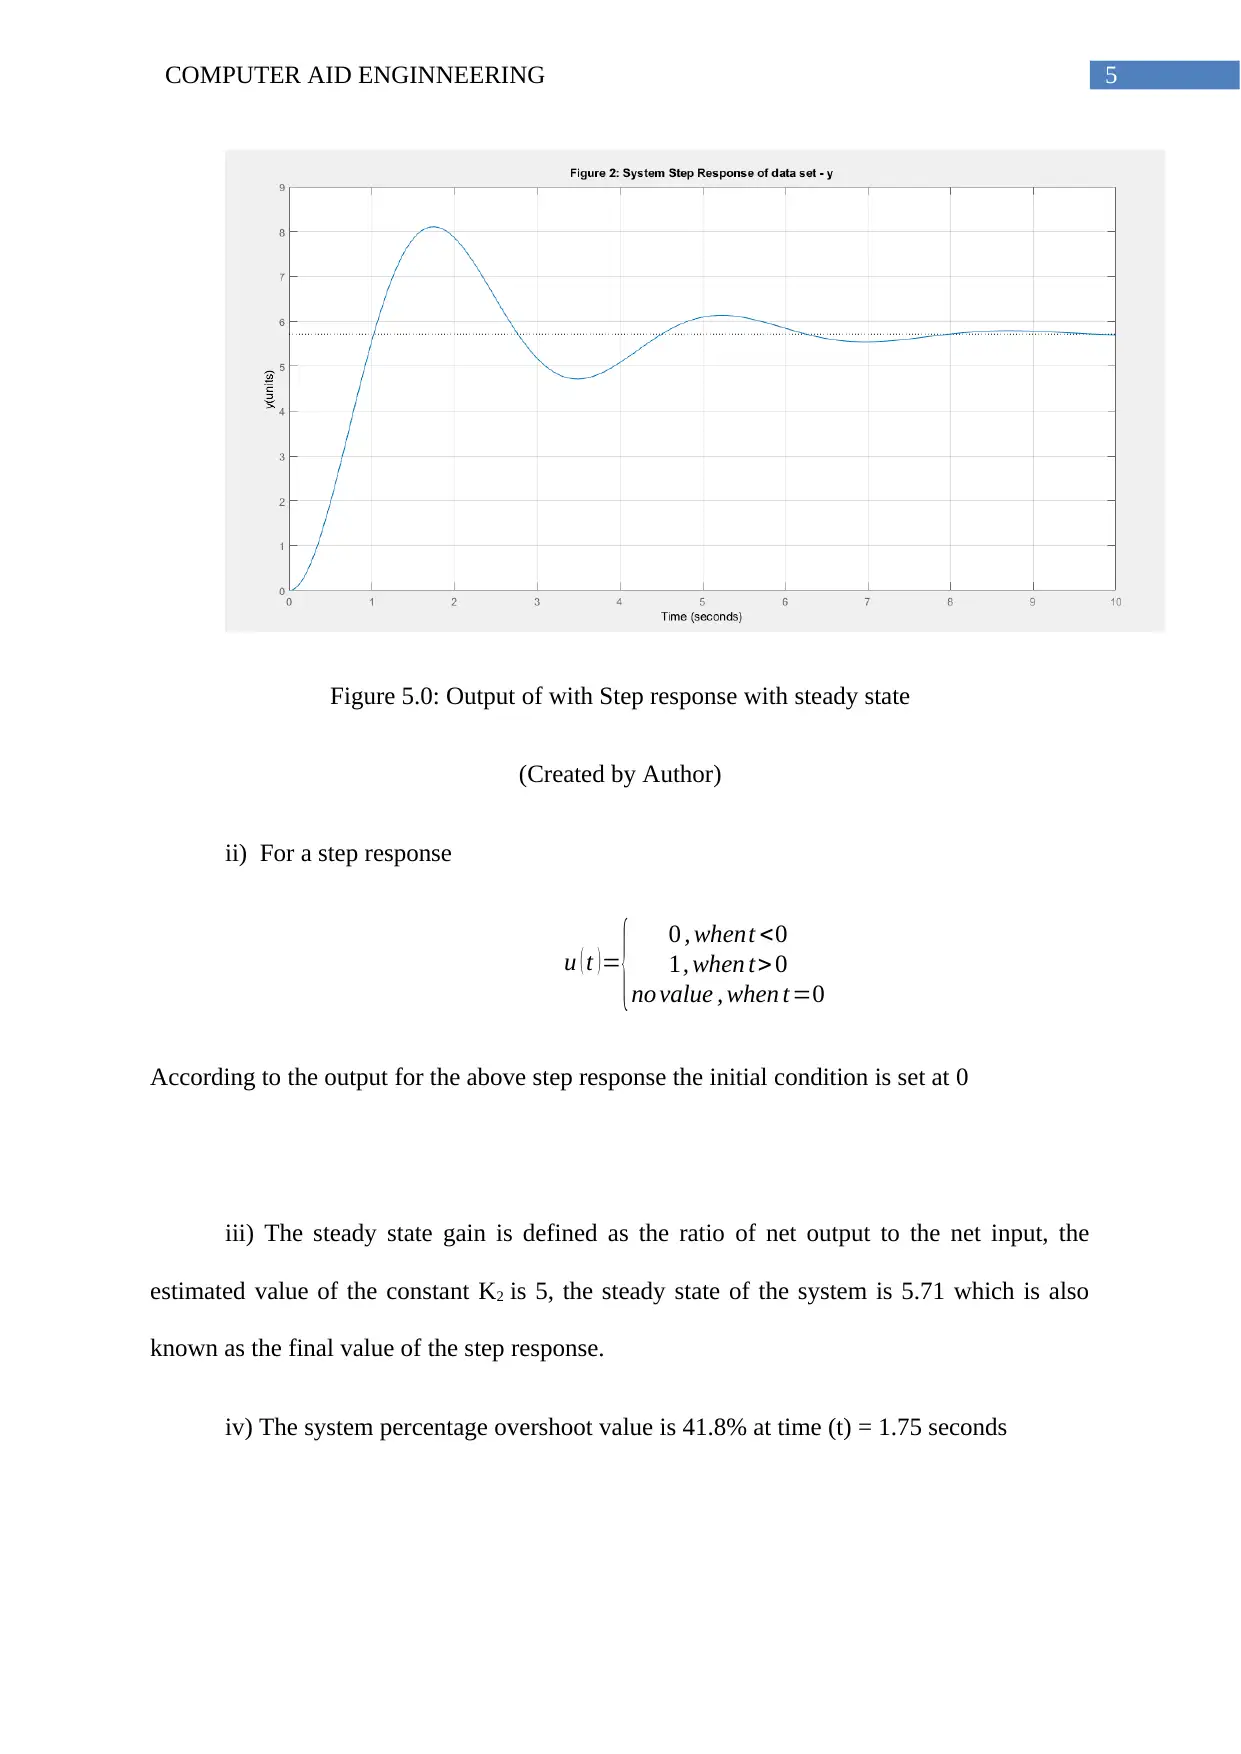
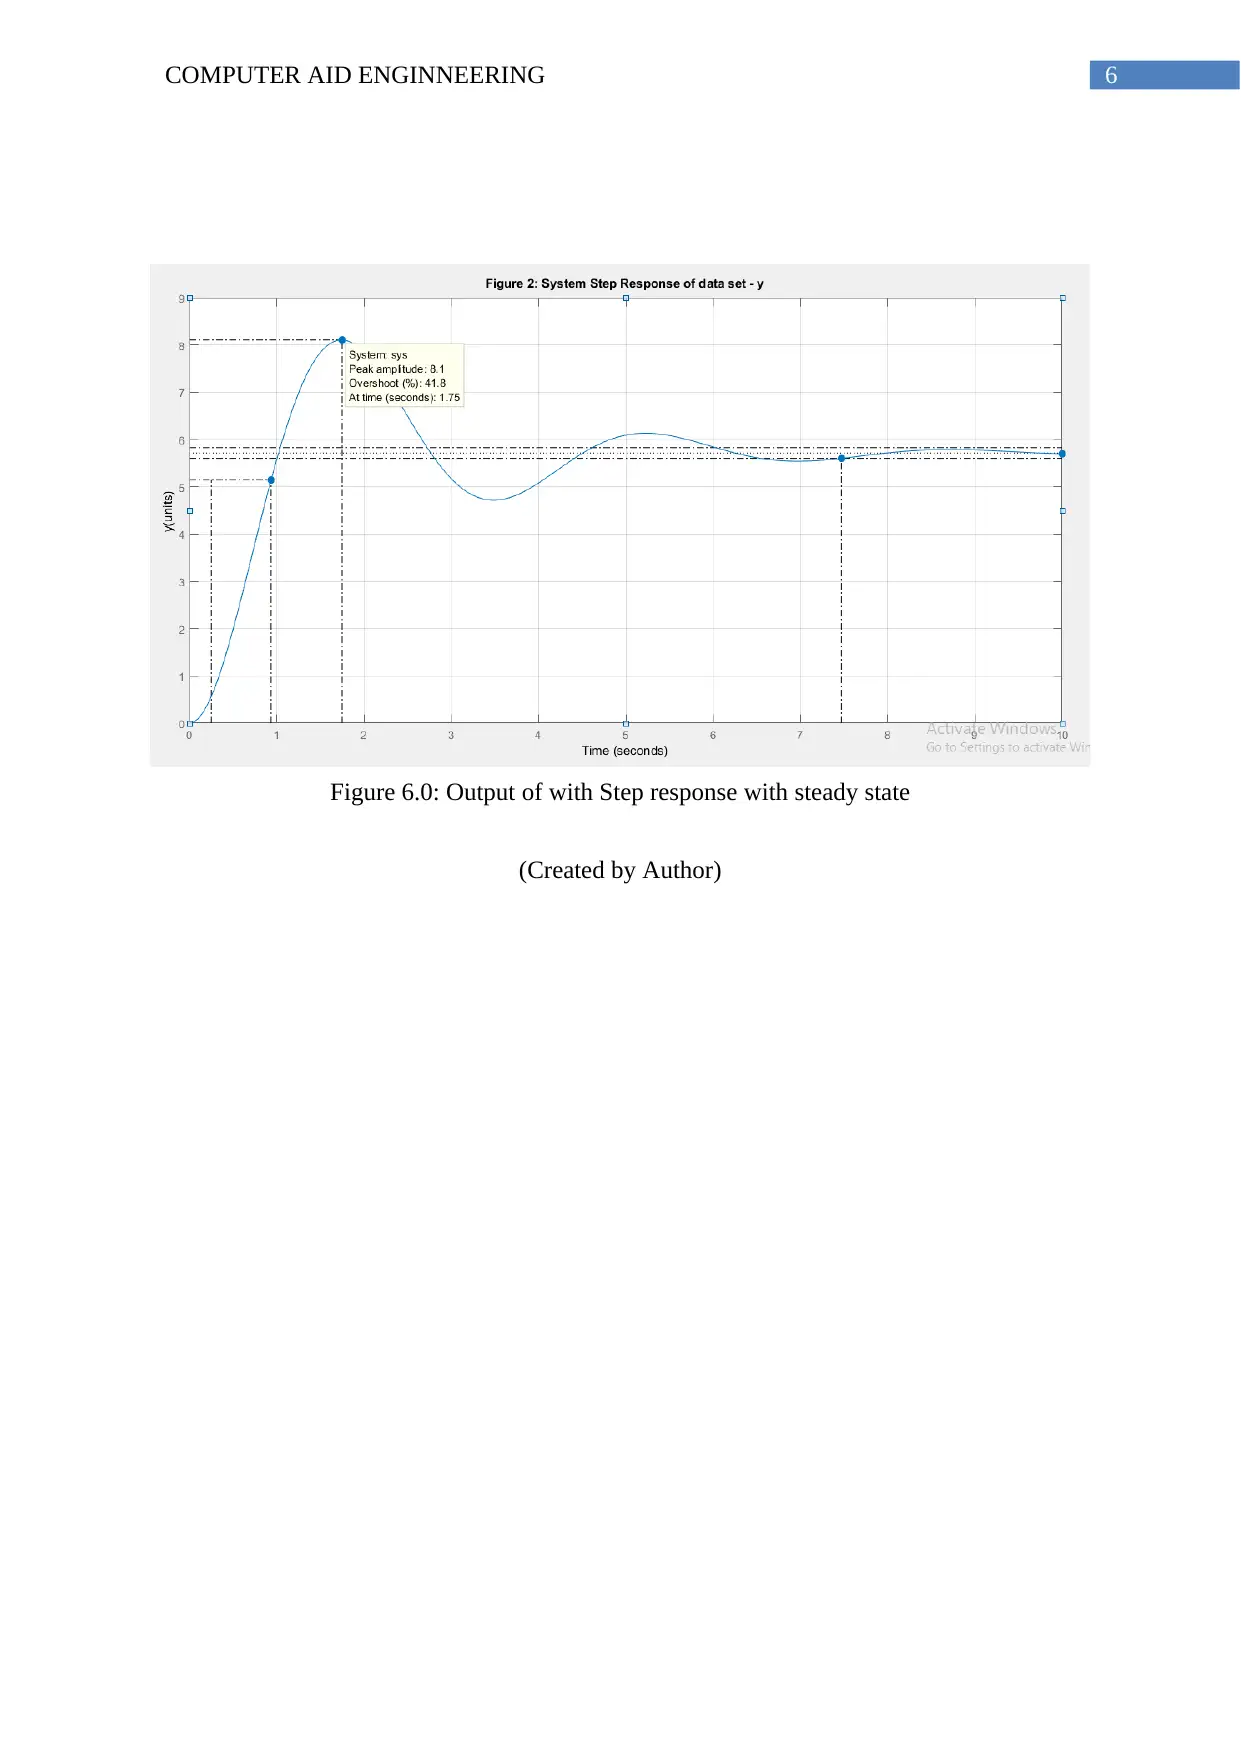
This report presents a detailed analysis of a Computer-Aided Engineering (CAE) assignment, focusing on step response analysis, Simulink modeling, and MATLAB implementation. The assignment brief requires the student to address three key tasks. The first task involves setting up a given step response in Simulink and identifying the necessary values for the step block. The second task requires the student to sketch a Simulink model schematic based on a provided differential equation, along with the step response output for the derived second-order derivative. The final task involves generating MATLAB code to replicate the Simulink model, analyzing the step response, determining the initial conditions, calculating the steady-state gain, and identifying the percentage overshoot value. The report includes figures and code to support the analysis, demonstrating the student's understanding of the concepts and their ability to apply them to solve engineering problems. The report is a comprehensive response to the assignment brief, providing a detailed overview of the CAE concepts and their practical application.
Document Page
Running head: COMPUTER AID ENGINNEERING
COMPUTER AID ENGINNEERING
Name of the Student
Name of the University
Author Note
tabler-icon-diamond-filled.svg

Paraphrase This Document

Need a fresh take? Get an instant paraphrase of this document with our AI Paraphraser
Document Page
1COMPUTER AID ENGINNEERING
1.0 Response to Question A
Figure 1.0: Step Response
(Created by Author)
Where the transfer function is the 4 s+2.42
5 s +3 , where 4 s + 2.42 is the numerator and the 5 s +
3 is the denominator.
The out of the given transfer function is given below as the step response
Figure 2.0: Output of Step Response
Document Page
2COMPUTER AID ENGINNEERING
(Created by Author)
2.0 Response to Question B
Figure 3.0: Block representation of the given derivative
(Created by Author)
The given second order derivation in d2 y ( t )
dt2 + K1
d y (t)
d t + K2 y ( t ) =u( t) …. (i)
Where, the value of K1 is assumed as 1 and the value of K2 is assumed as 5, the output
of the step response is accordance to the second order derivation is given below in figure 4.0
Document Page
3COMPUTER AID ENGINNEERING
Figure 4.0: Step response of equation no. (i)
(Created by Author)
tabler-icon-diamond-filled.svg

Paraphrase This Document

Need a fresh take? Get an instant paraphrase of this document with our AI Paraphraser
Document Page
4COMPUTER AID ENGINNEERING
3.0 Response to Question C
i) The MATLAB code of the above sequence in question B is given below:
CODE
clc;
clear all;
close all;
num=[9]; % Defines the numerator
den=[1 1 5]; % Defines the denominator
sys= tf(num,den) % defining the transfer function of the system
step(sys,0:0.05:10); % defining the range and step sequence of the plot
[r,p,c]=residue(num,den)
title('Figure 2: System Step Response of data set - y')
ylabel('y(units)')
grid on;
OUTPUT
Figure 5.0: Output of Step response
(Created by Author)
Document Page
5COMPUTER AID ENGINNEERING
Figure 5.0: Output of with Step response with steady state
(Created by Author)
ii) For a step response
u ( t ) = { 0 , whent <0
1, when t> 0
no value , when t=0
According to the output for the above step response the initial condition is set at 0
iii) The steady state gain is defined as the ratio of net output to the net input, the
estimated value of the constant K2 is 5, the steady state of the system is 5.71 which is also
known as the final value of the step response.
iv) The system percentage overshoot value is 41.8% at time (t) = 1.75 seconds
Document Page
6COMPUTER AID ENGINNEERING
Figure 6.0: Output of with Step response with steady state
(Created by Author)
chevron_up_icon
1 out of 7
circle_padding
hide_on_mobile
zoom_out_icon
[object Object]