Usability Engineering Report: Data Analysis of Audio Frequencies
VerifiedAdded on 2021/06/18
|11
|2041
|244
Report
AI Summary
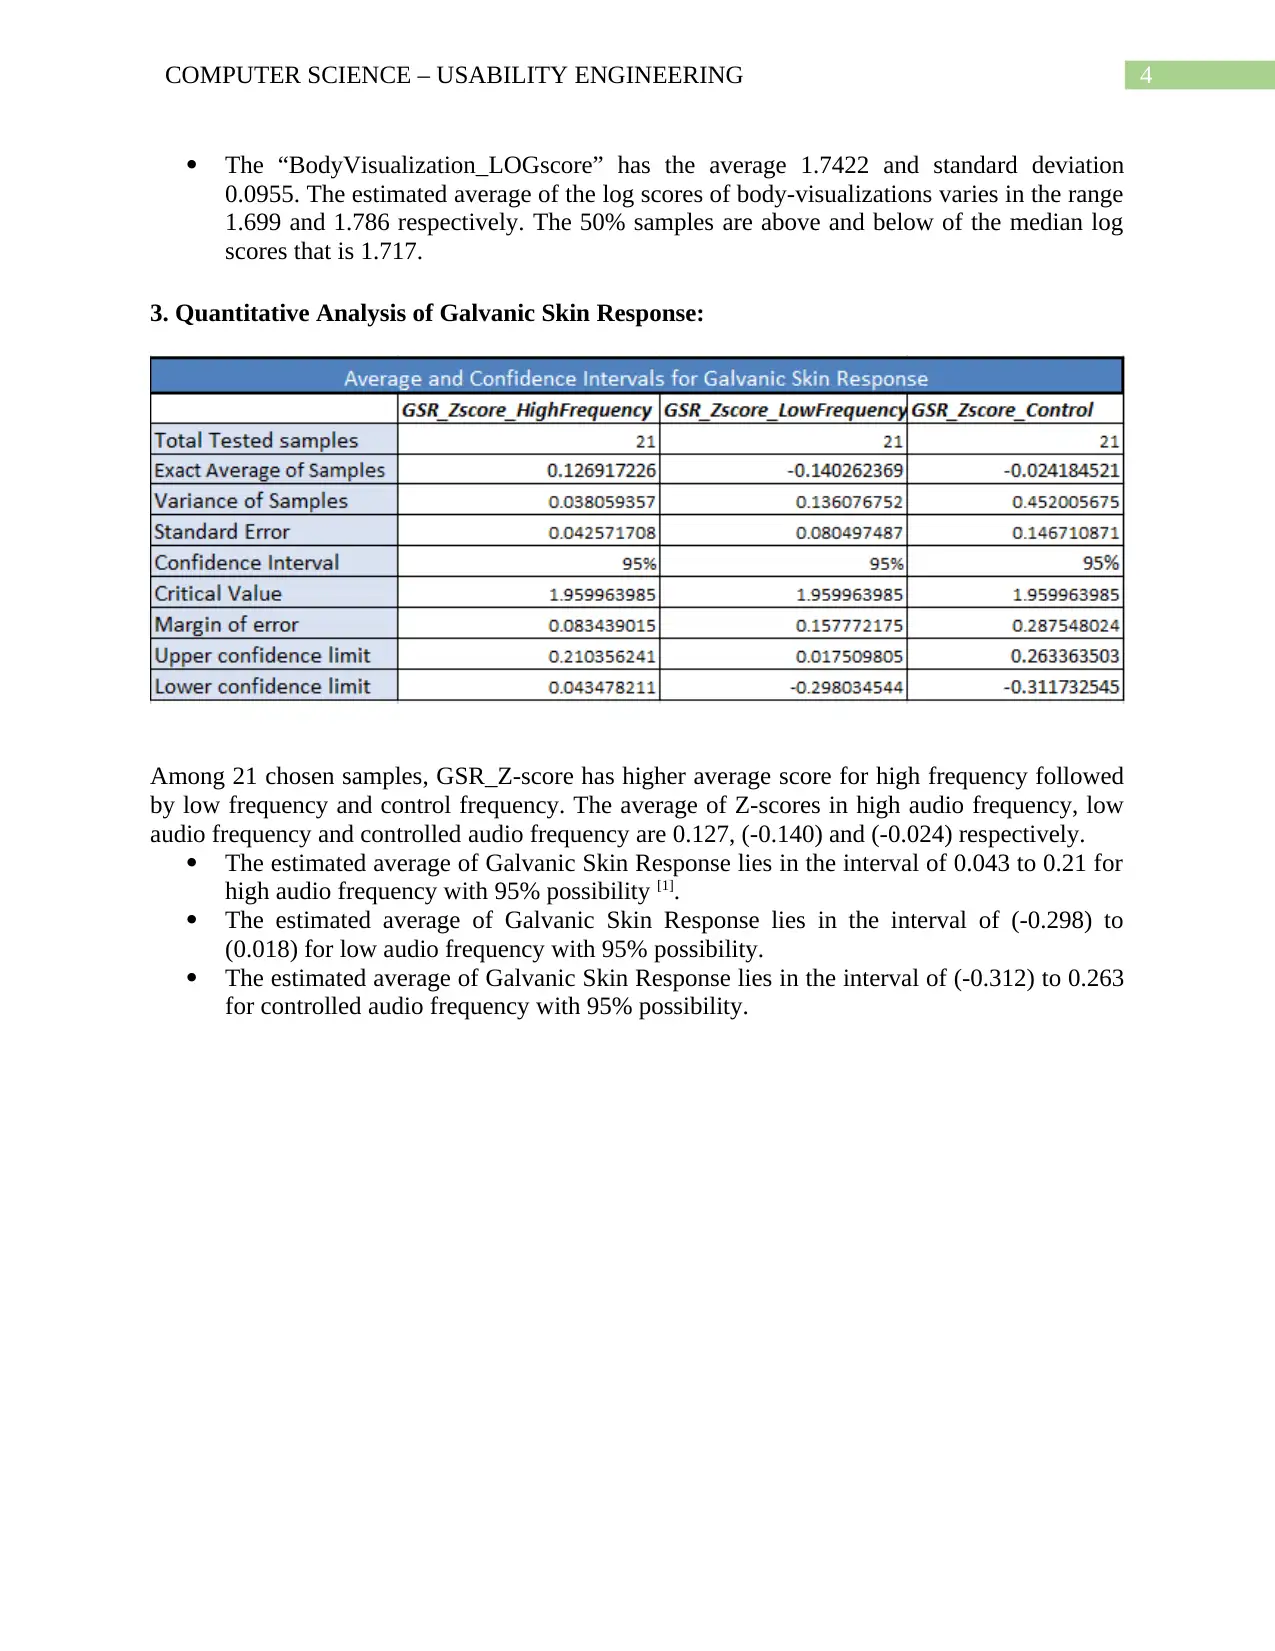
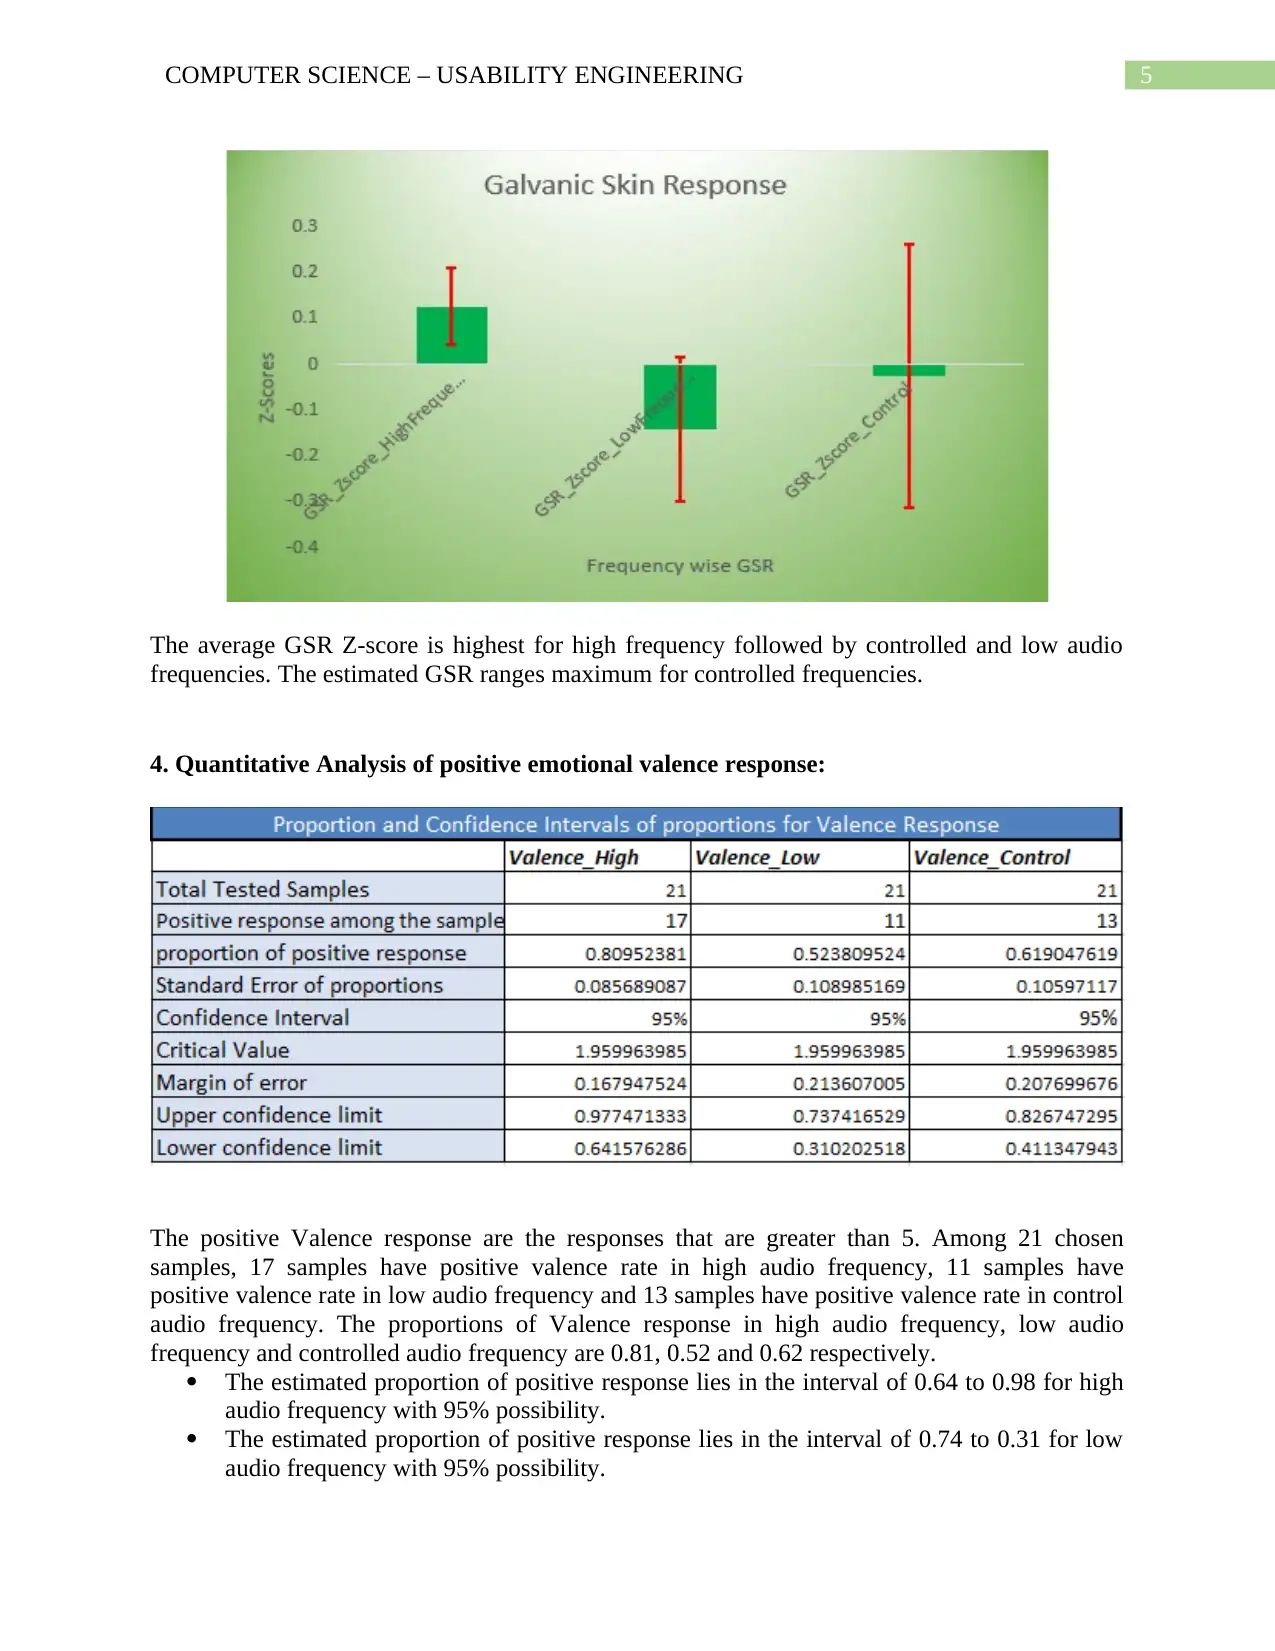
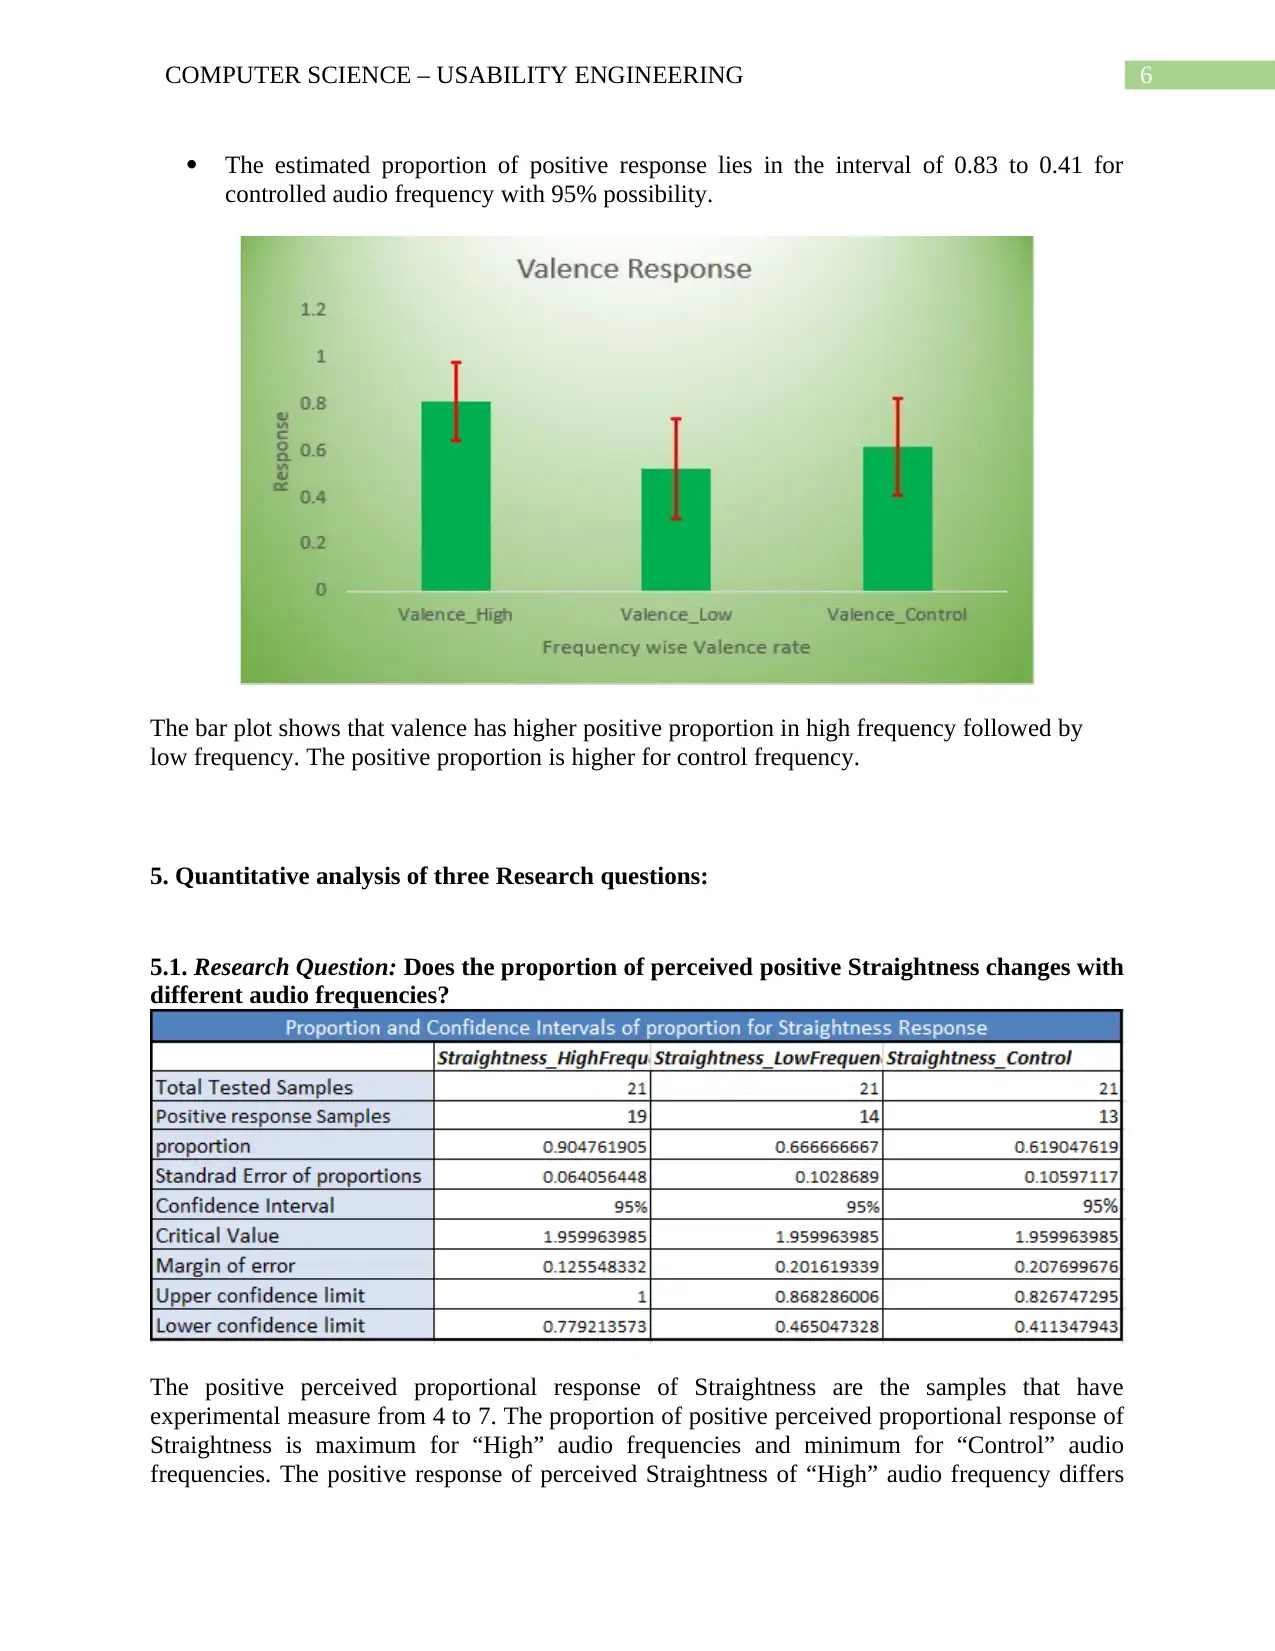
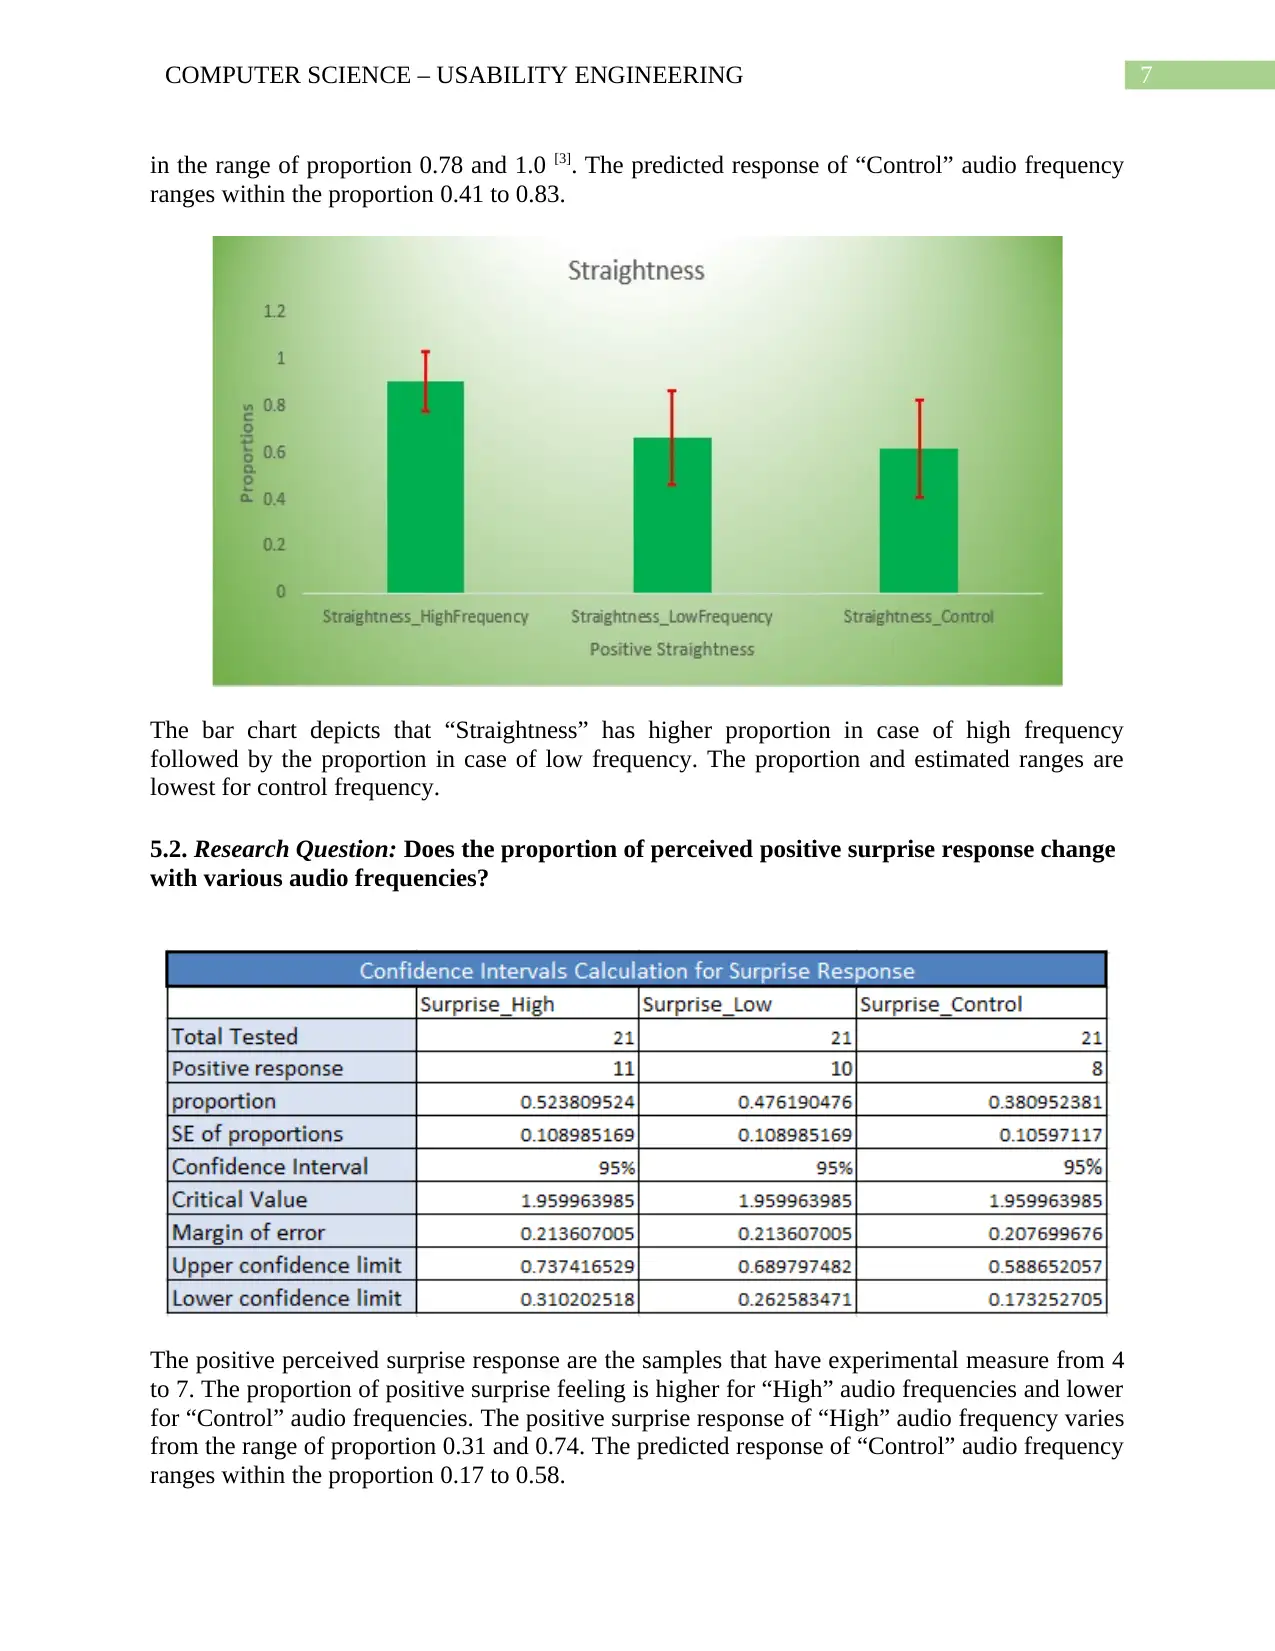
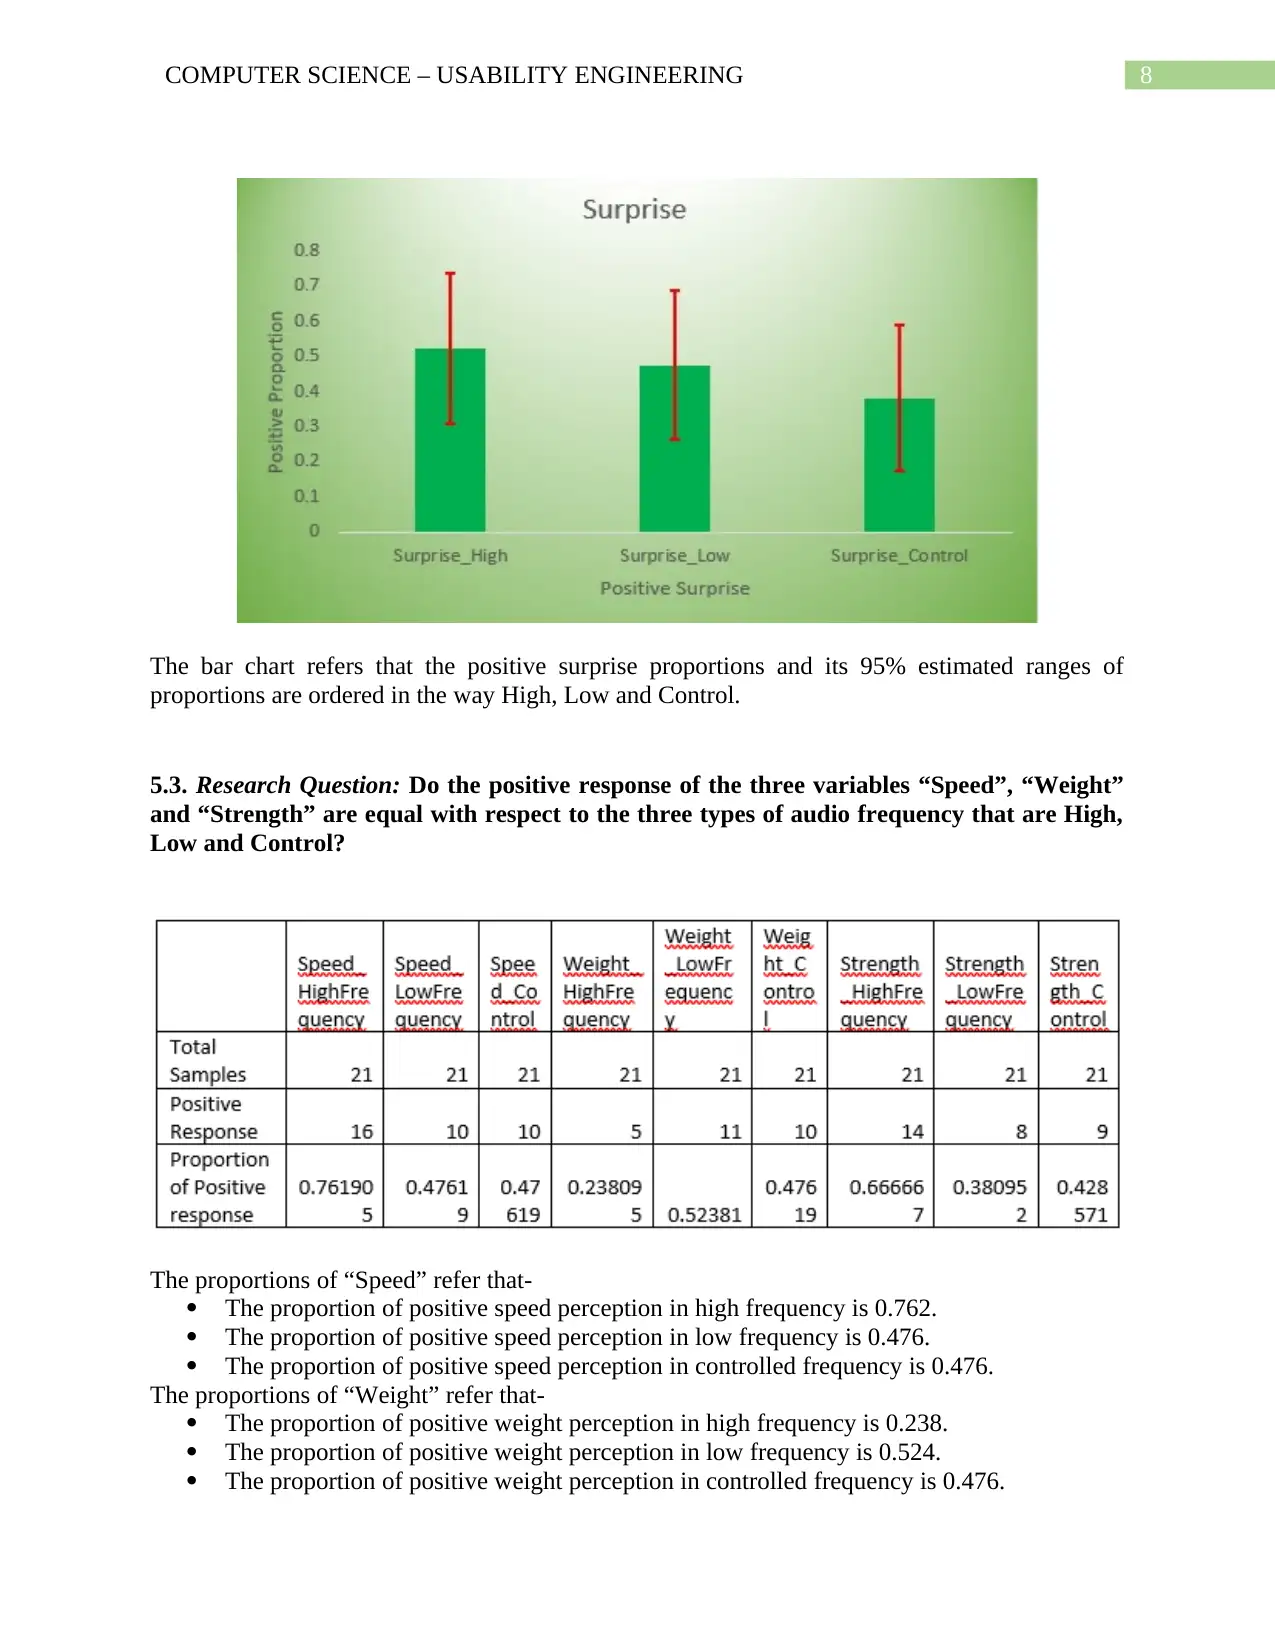
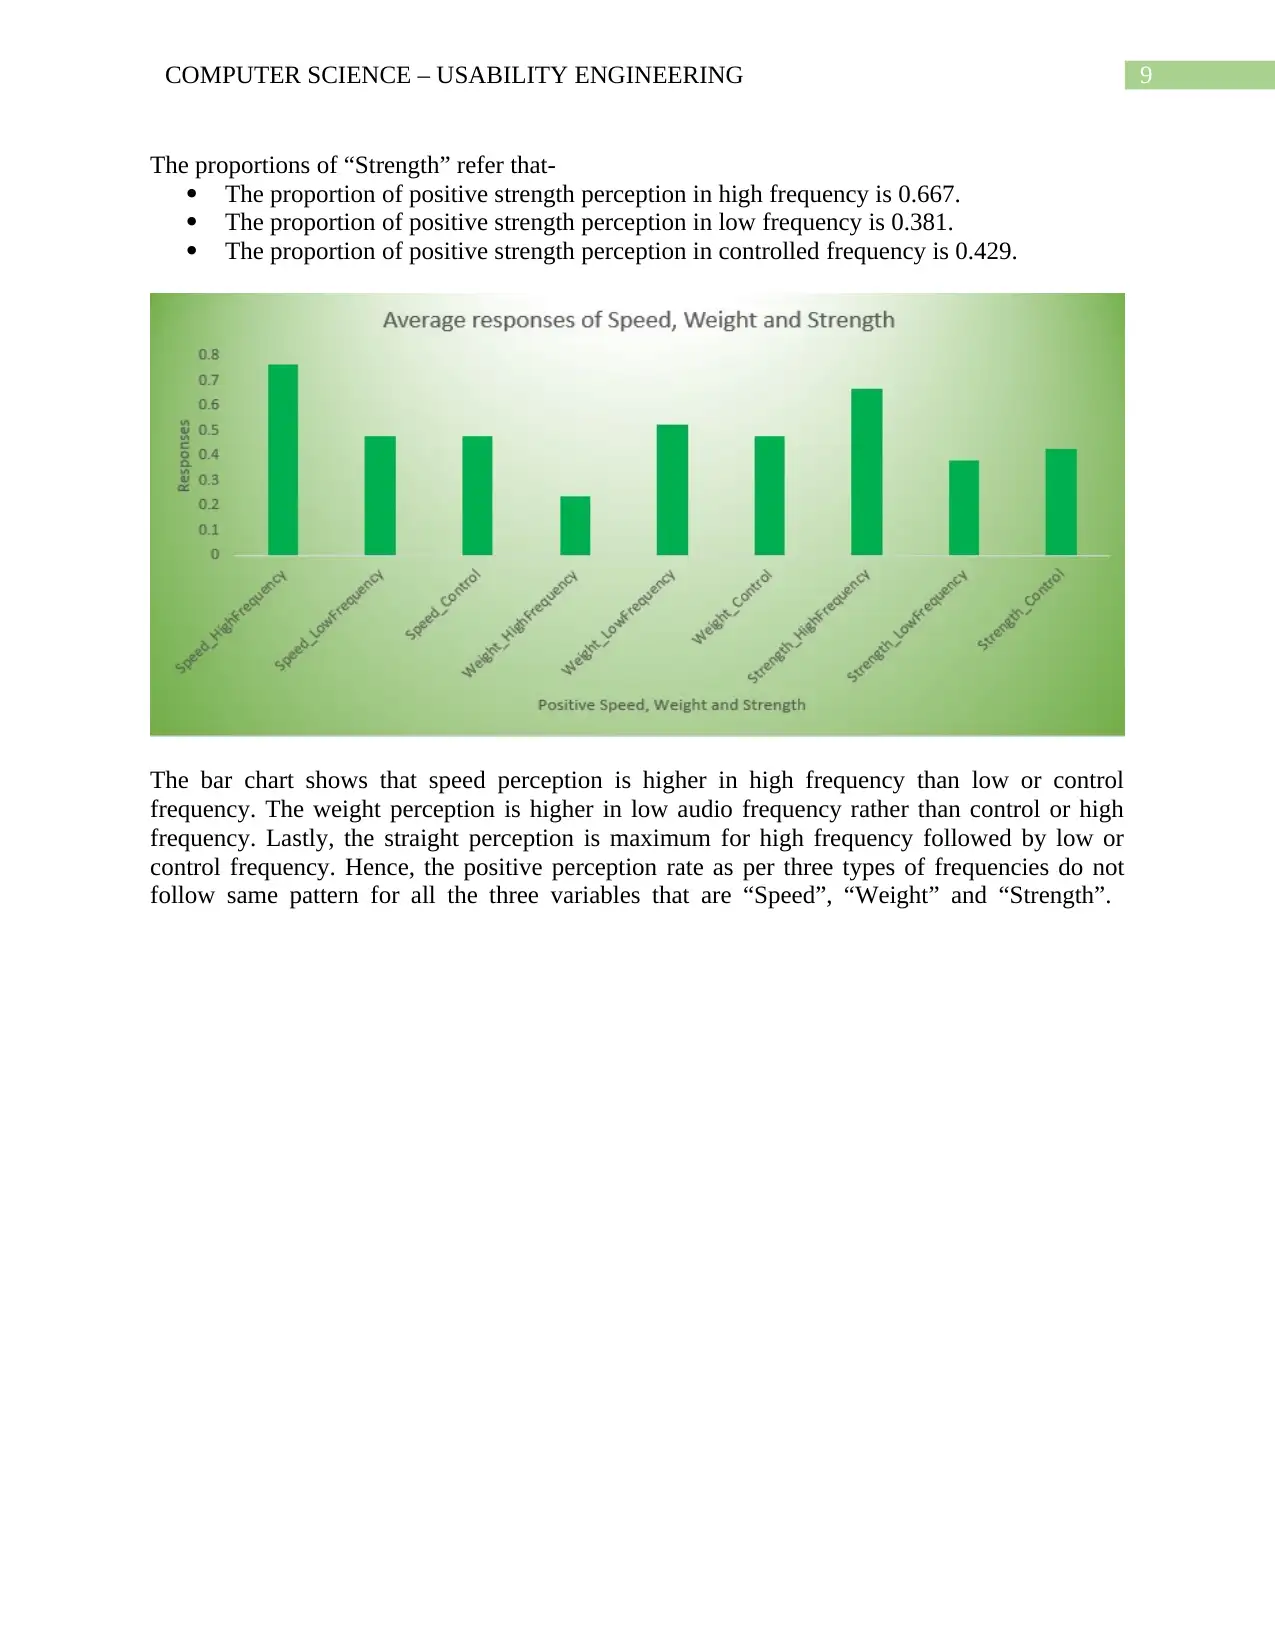
This report presents a usability engineering analysis of data collected from an experiment on footwear, examining the impact of different audio frequencies on user perception and physiological responses. The study focuses on variables like galvanic skin response (GSR), emotional valence, and perceived sensations such as speed, weight, and strength. The report details the data cleaning process, descriptive statistics, and quantitative analysis of GSR and emotional valence responses. Furthermore, it addresses three research questions regarding the proportion of perceived positive responses related to straightness and surprise across different audio frequencies, as well as the equality of positive responses for speed, weight, and strength. The analysis utilizes MS-Excel operations to interpret experimental data, highlighting variations in user reactions to high, low, and controlled audio feedback, and capturing perceptions of body weight, mood, and emotional changes across various experimental dimensions.
1 out of 11
Related Documents


Your All-in-One AI-Powered Toolkit for Academic Success.
+13062052269
info@desklib.com
Available 24*7 on WhatsApp / Email
![[object Object]](/_next/static/media/star-bottom.7253800d.svg)
Copyright © 2020–2026 A2Z Services. All Rights Reserved. Developed and managed by ZUCOL.