Data Analysis Report: Ingredient, Ship, Country, and Payment
VerifiedAdded on 2023/01/19
|17
|2278
|22
Report
AI Summary
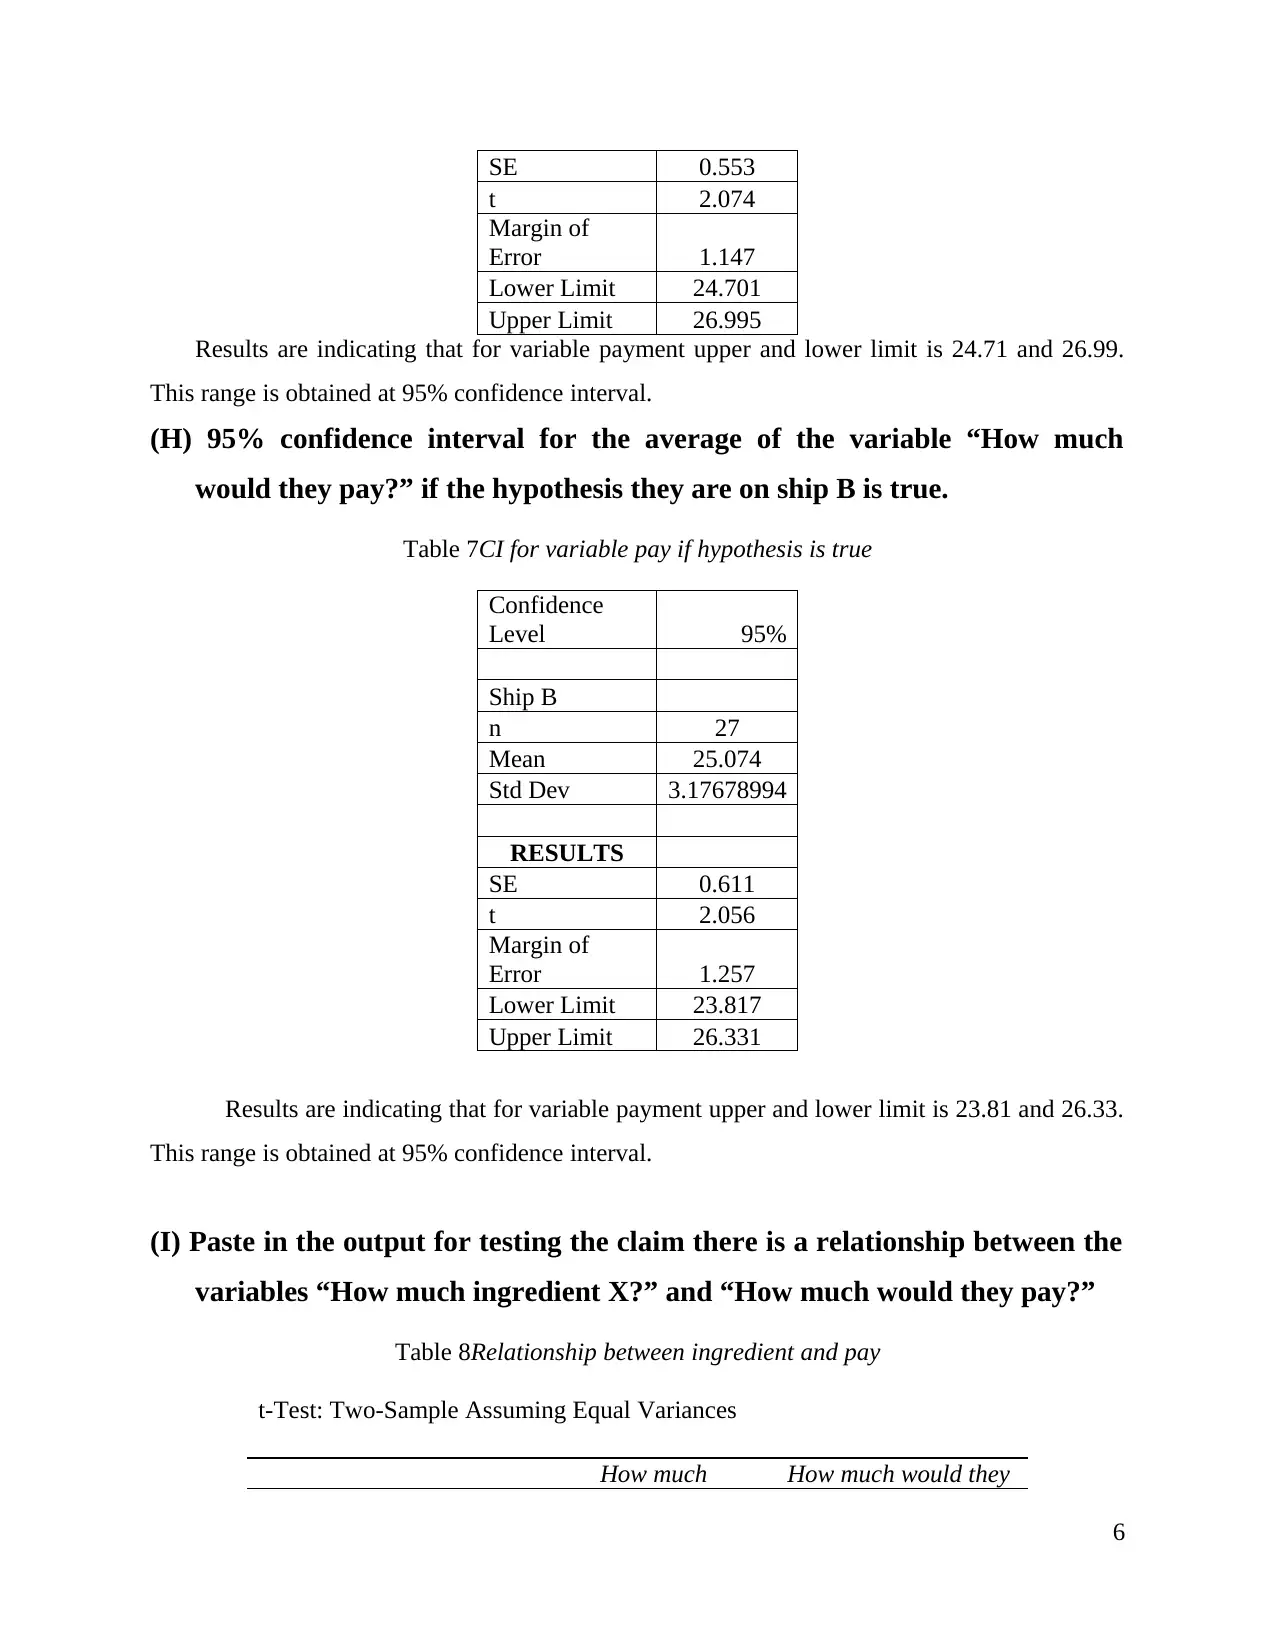
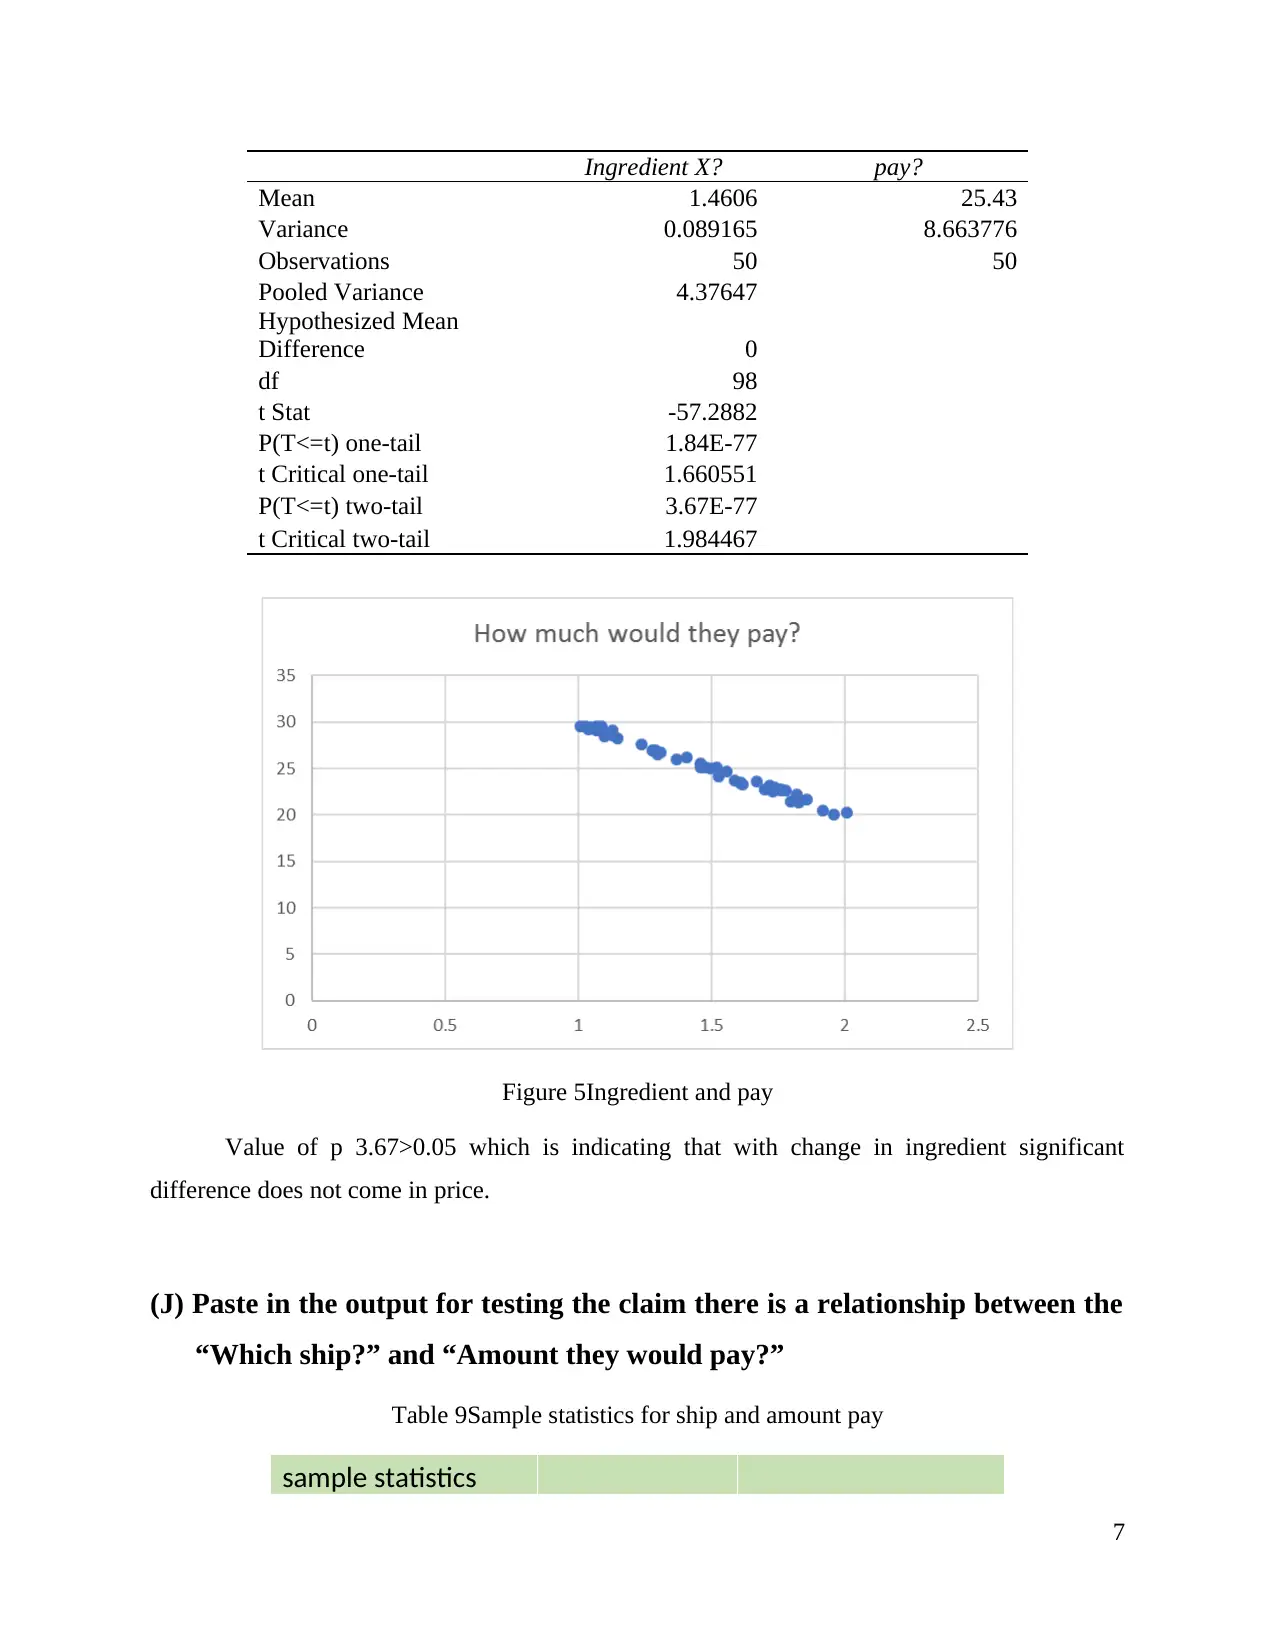
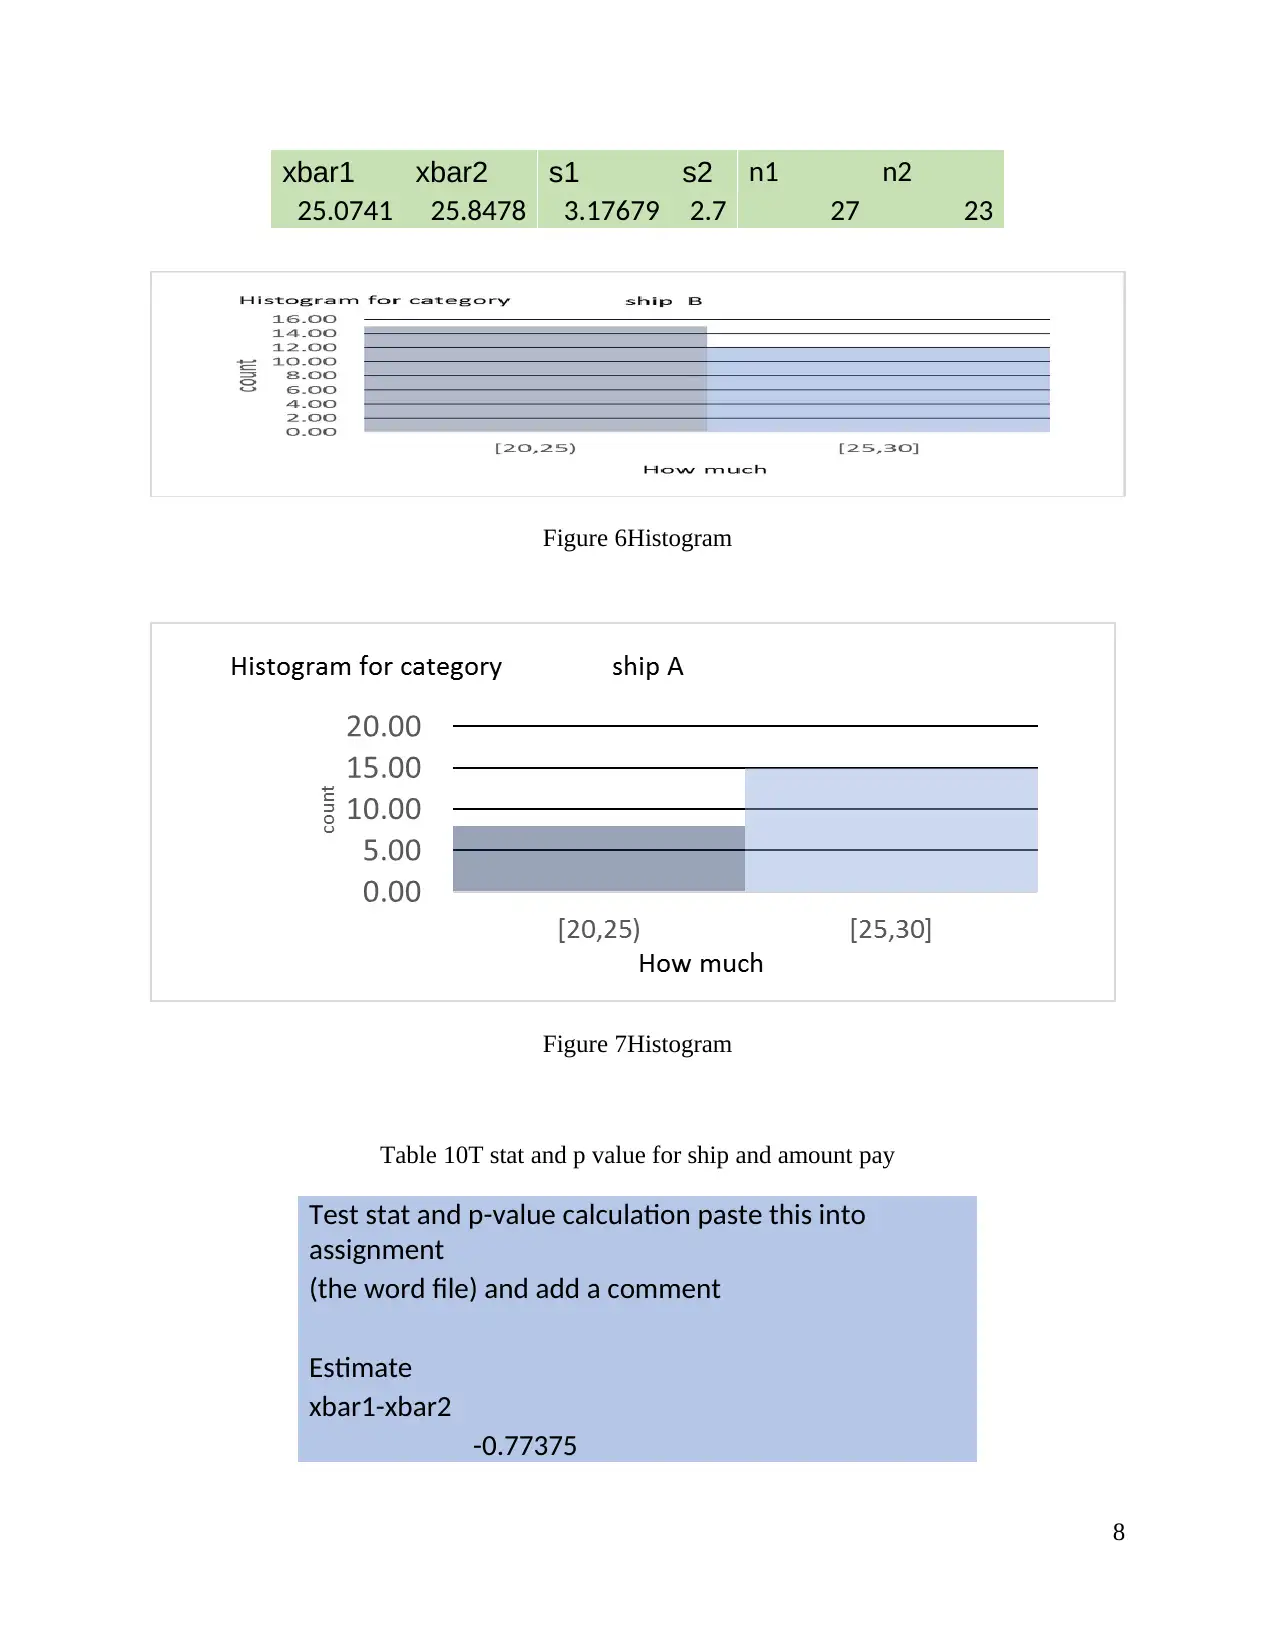
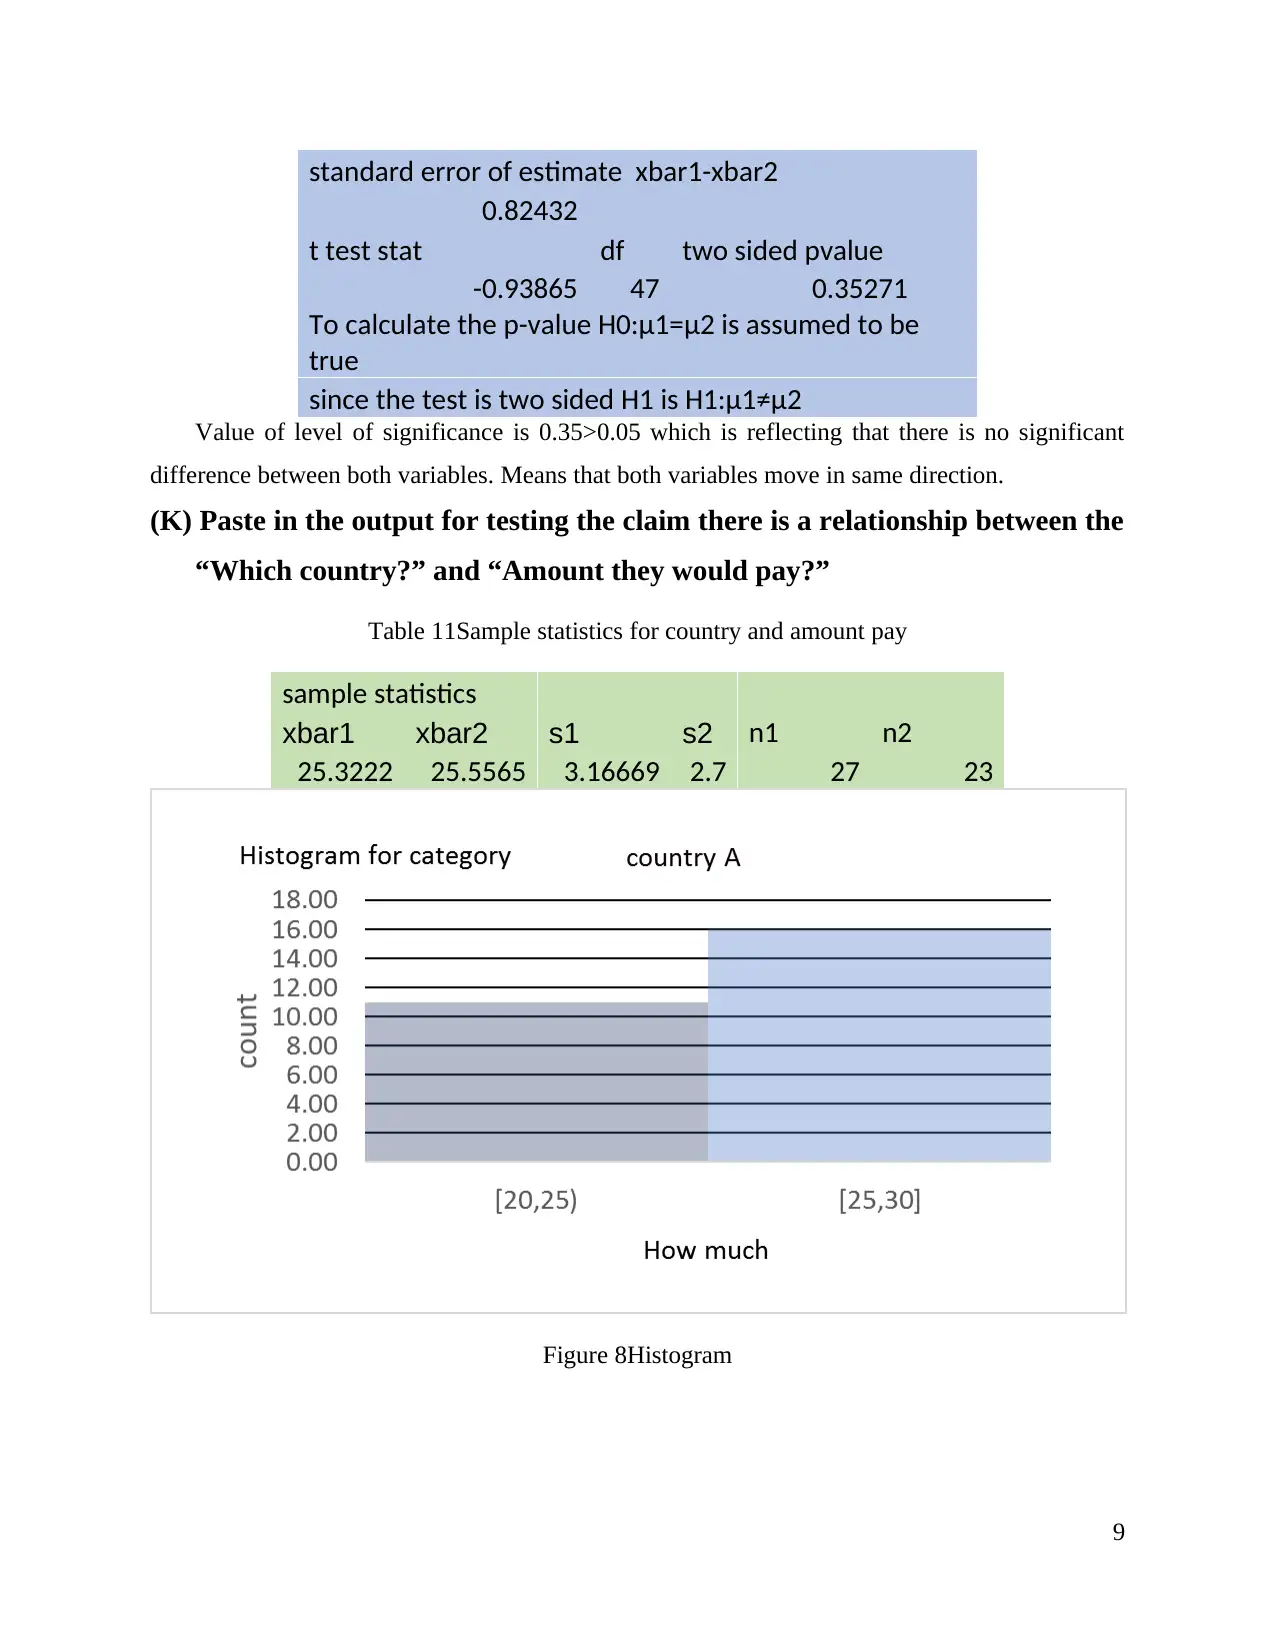
This report presents a comprehensive data analysis, exploring the relationships between various variables, including ingredient quantities, ship types, customer countries, and payment amounts. The analysis encompasses correlation analysis, hypothesis testing, and confidence interval calculations to determine the significance of these relationships. The report investigates the impact of ingredient levels on payment, compares payment differences across different ships and countries, and examines the correlation between country and ship preference. Statistical outputs, including t-tests and p-values, are provided to support the findings. Additionally, the report includes discussions on relevant topics, such as demography and cruise ship tourism, although their direct relevance to the core data analysis is questioned. The report concludes with comments on formatting and offers suggestions for improvement, particularly regarding table and graph labeling, systematic structuring, and removal of unnecessary descriptive statistics.
1 out of 17
Related Documents


Your All-in-One AI-Powered Toolkit for Academic Success.
+13062052269
info@desklib.com
Available 24*7 on WhatsApp / Email
![[object Object]](/_next/static/media/star-bottom.7253800d.svg)
Copyright © 2020–2026 A2Z Services. All Rights Reserved. Developed and managed by ZUCOL.