Concept of Supply And Demand Assignment
Added on 2022-09-17
14 Pages3277 Words36 Views
Running head: ECONOMICS
1
Economics
Name
Institution
Affiliation
Author’s note
1
Economics
Name
Institution
Affiliation
Author’s note
ECONOMICS
2
Question 1
Theoretical analysis on supply and demand
The concept of supply and demand within the field of economics is
concerned with the relationship between the quantities of a given
commodity that the producers are willing and able to sell at a given price
and the quantities that the buyers are able and willing to buy at a given
price in a given period of time. It is the principal mode for the
determination of price within the economic theory. The commodity price
determination is attained through the interaction of demand and supply
within the market. The ensuing price is defined as the price of equilibrium
and denotes an agreement between the consumers and producers of a
given good (Álvarez and Skudelny, 2017). As far as equilibrium is
concerned, the quantity of the good demanded by the consumers is
equivalent to the quantity of the good the suppliers are able and willing to
supply. It is important to note that the quantity of a given commodity as
demanded is dependent on the price of that particular commodity and
probably on several other factors (Luciani, 2014). Some of these other
factors might include other commodities’ prices, the preferences as well
as incomes of consumers and effects associated with seasons. The
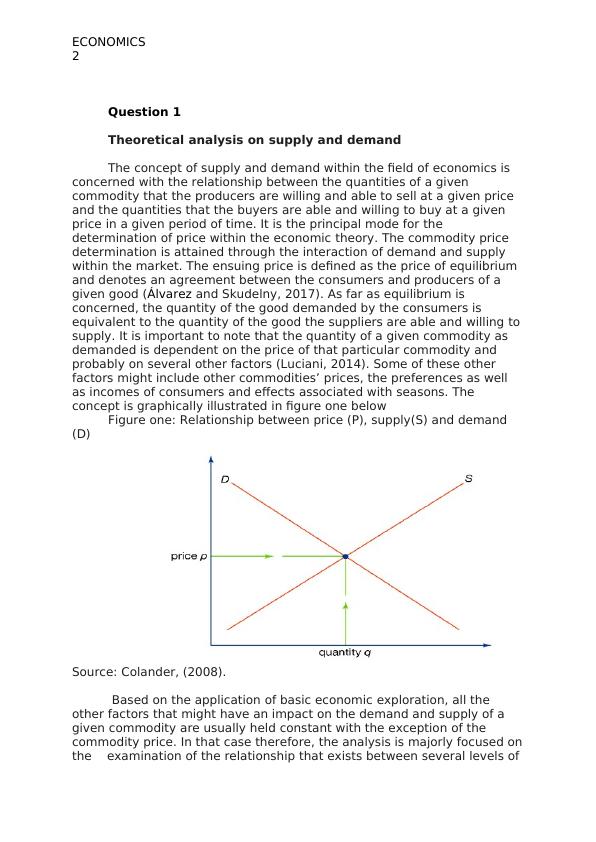
concept is graphically illustrated in figure one below
Figure one: Relationship between price (P), supply(S) and demand
(D)
Source: Colander, (2008).
Based on the application of basic economic exploration, all the
other factors that might have an impact on the demand and supply of a
given commodity are usually held constant with the exception of the
commodity price. In that case therefore, the analysis is majorly focused on
the examination of the relationship that exists between several levels of
2
Question 1
Theoretical analysis on supply and demand
The concept of supply and demand within the field of economics is
concerned with the relationship between the quantities of a given
commodity that the producers are willing and able to sell at a given price
and the quantities that the buyers are able and willing to buy at a given
price in a given period of time. It is the principal mode for the
determination of price within the economic theory. The commodity price
determination is attained through the interaction of demand and supply
within the market. The ensuing price is defined as the price of equilibrium
and denotes an agreement between the consumers and producers of a
given good (Álvarez and Skudelny, 2017). As far as equilibrium is
concerned, the quantity of the good demanded by the consumers is
equivalent to the quantity of the good the suppliers are able and willing to
supply. It is important to note that the quantity of a given commodity as
demanded is dependent on the price of that particular commodity and
probably on several other factors (Luciani, 2014). Some of these other
factors might include other commodities’ prices, the preferences as well
as incomes of consumers and effects associated with seasons. The
concept is graphically illustrated in figure one below
Figure one: Relationship between price (P), supply(S) and demand
(D)
Source: Colander, (2008).
Based on the application of basic economic exploration, all the
other factors that might have an impact on the demand and supply of a
given commodity are usually held constant with the exception of the
commodity price. In that case therefore, the analysis is majorly focused on
the examination of the relationship that exists between several levels of
ECONOMICS
3
price and the maximum quantity that consumers would potentially be able
and willing to purchase at each of such. The price and quantity
combinations are developed into a curve and this curve is usually known
as the demand curve (Doz etal.2012). For this curve, the price is depicted
on the vertical axis while demand is usually depicted on the horizontal
axis of the curve. The demand curve is usually downward slopping and
thereby indicating the consumers’ willingness to buy or purchase more of
the same commodity at reduced price levels (Hambur etal.2015). Any
changes within the non-price factors would instigate a shift within the
demand curve. On the other hand, any changes within the commodity
price can be located along a fixed demand curve. Figure one illustrates an
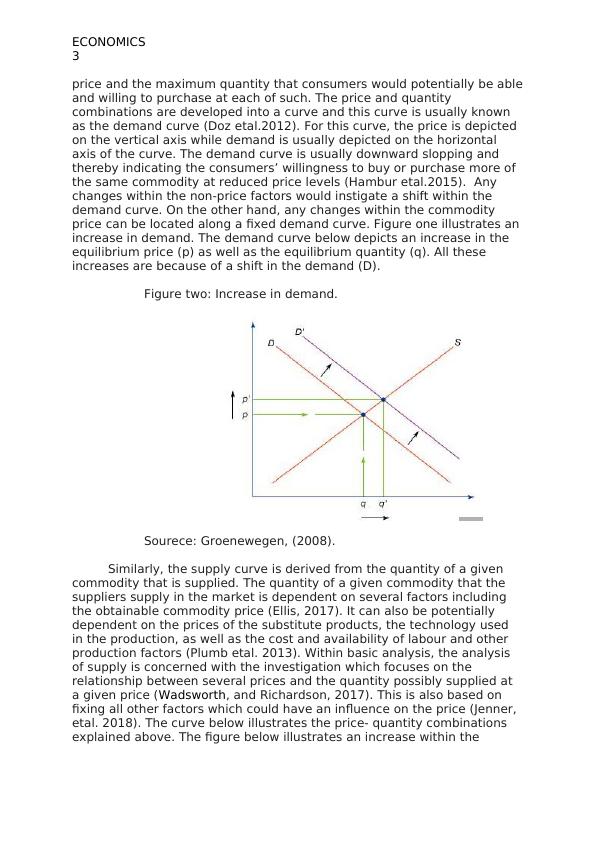
increase in demand. The demand curve below depicts an increase in the
equilibrium price (p) as well as the equilibrium quantity (q). All these
increases are because of a shift in the demand (D).
Figure two: Increase in demand.
Sourece: Groenewegen, (2008).
Similarly, the supply curve is derived from the quantity of a given
commodity that is supplied. The quantity of a given commodity that the
suppliers supply in the market is dependent on several factors including
the obtainable commodity price (Ellis, 2017). It can also be potentially
dependent on the prices of the substitute products, the technology used
in the production, as well as the cost and availability of labour and other
production factors (Plumb etal. 2013). Within basic analysis, the analysis
of supply is concerned with the investigation which focuses on the
relationship between several prices and the quantity possibly supplied at
a given price (Wadsworth, and Richardson, 2017). This is also based on
fixing all other factors which could have an influence on the price (Jenner,
etal. 2018). The curve below illustrates the price- quantity combinations
explained above. The figure below illustrates an increase within the
3
price and the maximum quantity that consumers would potentially be able
and willing to purchase at each of such. The price and quantity
combinations are developed into a curve and this curve is usually known
as the demand curve (Doz etal.2012). For this curve, the price is depicted
on the vertical axis while demand is usually depicted on the horizontal
axis of the curve. The demand curve is usually downward slopping and
thereby indicating the consumers’ willingness to buy or purchase more of
the same commodity at reduced price levels (Hambur etal.2015). Any
changes within the non-price factors would instigate a shift within the
demand curve. On the other hand, any changes within the commodity
price can be located along a fixed demand curve. Figure one illustrates an
increase in demand. The demand curve below depicts an increase in the
equilibrium price (p) as well as the equilibrium quantity (q). All these
increases are because of a shift in the demand (D).
Figure two: Increase in demand.
Sourece: Groenewegen, (2008).
Similarly, the supply curve is derived from the quantity of a given
commodity that is supplied. The quantity of a given commodity that the
suppliers supply in the market is dependent on several factors including
the obtainable commodity price (Ellis, 2017). It can also be potentially
dependent on the prices of the substitute products, the technology used
in the production, as well as the cost and availability of labour and other
production factors (Plumb etal. 2013). Within basic analysis, the analysis
of supply is concerned with the investigation which focuses on the
relationship between several prices and the quantity possibly supplied at
a given price (Wadsworth, and Richardson, 2017). This is also based on
fixing all other factors which could have an influence on the price (Jenner,
etal. 2018). The curve below illustrates the price- quantity combinations
explained above. The figure below illustrates an increase within the
ECONOMICS
4
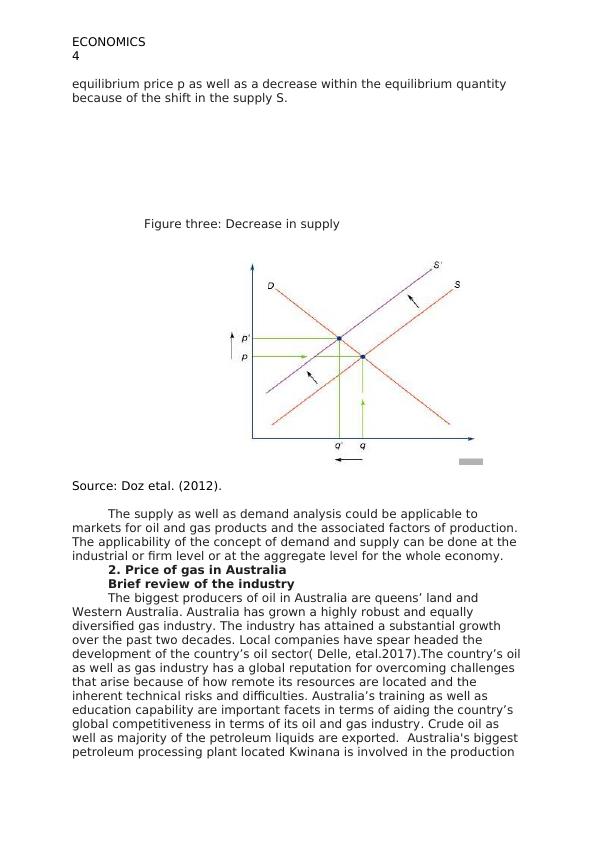
equilibrium price p as well as a decrease within the equilibrium quantity
because of the shift in the supply S.
Figure three: Decrease in supply
Source: Doz etal. (2012).
The supply as well as demand analysis could be applicable to
markets for oil and gas products and the associated factors of production.
The applicability of the concept of demand and supply can be done at the
industrial or firm level or at the aggregate level for the whole economy.
2. Price of gas in Australia
Brief review of the industry
The biggest producers of oil in Australia are queens’ land and
Western Australia. Australia has grown a highly robust and equally
diversified gas industry. The industry has attained a substantial growth
over the past two decades. Local companies have spear headed the
development of the country’s oil sector( Delle, etal.2017).The country’s oil
as well as gas industry has a global reputation for overcoming challenges
that arise because of how remote its resources are located and the
inherent technical risks and difficulties. Australia’s training as well as
education capability are important facets in terms of aiding the country’s
global competitiveness in terms of its oil and gas industry. Crude oil as
well as majority of the petroleum liquids are exported. Australia's biggest
petroleum processing plant located Kwinana is involved in the production
4
equilibrium price p as well as a decrease within the equilibrium quantity
because of the shift in the supply S.
Figure three: Decrease in supply
Source: Doz etal. (2012).
The supply as well as demand analysis could be applicable to
markets for oil and gas products and the associated factors of production.
The applicability of the concept of demand and supply can be done at the
industrial or firm level or at the aggregate level for the whole economy.
2. Price of gas in Australia
Brief review of the industry
The biggest producers of oil in Australia are queens’ land and
Western Australia. Australia has grown a highly robust and equally
diversified gas industry. The industry has attained a substantial growth
over the past two decades. Local companies have spear headed the
development of the country’s oil sector( Delle, etal.2017).The country’s oil
as well as gas industry has a global reputation for overcoming challenges
that arise because of how remote its resources are located and the
inherent technical risks and difficulties. Australia’s training as well as
education capability are important facets in terms of aiding the country’s
global competitiveness in terms of its oil and gas industry. Crude oil as
well as majority of the petroleum liquids are exported. Australia's biggest
petroleum processing plant located Kwinana is involved in the production
End of preview
Want to access all the pages? Upload your documents or become a member.
Related Documents
Microeconomicslg...
|6
|956
|351
Economics for Business - PDFlg...
|12
|3003
|233
Demand and Supply of French and Australian Wineslg...
|10
|1692
|385
Applying Demand and Supplylg...
|18
|3594
|26
Report on Economic Policy and Health Issueslg...
|11
|3330
|44
Economic For Business: Supply & Demand Diagramslg...
|12
|3082
|416