Shift-Share Analysis: Goomalling LGA, Western Australia (2006-2011)
VerifiedAdded on 2020/06/06
|13
|2913
|106
Report
AI Summary
This report conducts a shift-share analysis of the Goomalling Local Government Area (LGA) in Western Australia, focusing on employment trends between 2006 and 2011. The analysis breaks down regional job growth into national growth, industrial mix, and regional competitive effects, identifying factors behind employment changes. The report uses data on various industries, including agriculture, mining, manufacturing, and services, to calculate national and structural components, and differential components. It reveals a negative regional employment growth of -0.7%, while the national component shows positive results, indicating that national industries performed better than regional ones. The structural component reflects a negative impact on employment levels, and the differential component shows positive results, suggesting growth in the state and local government employment. The analysis highlights the importance of industrial mix and competitive advantages in determining regional economic performance, providing insights into the local labor market dynamics and suggesting areas for economic development.
Conduct a shift-share analysis of an
Australian non-metropolitan Local
Government Area (LGA) or Stat
Australian non-metropolitan Local
Government Area (LGA) or Stat
Paraphrase This Document
Need a fresh take? Get an instant paraphrase of this document with our AI Paraphraser
TABLE OF CONTENTS
INTRODUCTION ........................................................................................................................3
MAIN BODY ..............................................................................................................................3
CONCLUSION............................................................................................................................11
REFERENCES............................................................................................................................12

INTRODUCTION
Shift share analysis may be served as a standard regional analysis method that helps in determining and evaluating regional job
growth in line with the national trends. Through doing shift share analysis reasons take place behind increasing or decreasing
employment level in regional industry is assessed. For the purpose of shift share analysis, regional job growth is distinguished into
three components such as industrial mix, national growth and regional competitive effects. The present report is based on Goomalling,
non-metropolitan local government area of Western Australia, Wheatbelt region. In this, report will provide deeper insight about the
changes take place in employment level, pertaining to the different industries from the period of 2006-2011.
MAIN BODY
Western Australia :
In consideration with analysing the employment rate in Western Australia which determines the adequate changes into
operations as to have the appropriate measurement over the proposed data set. There has been implication of Shift share techniques to
analyse the employment growth rate in the local government area as Goomalling. It is the most helpful technique which will be
beneficial in analysing the regional economies and labour market as to have appropriate analysis on the influence of national and state
industry, factors and trends Yang, Tang, Chen & Jiang, (2017). Similarly, in relation with demonstrating the growth in the regional
employment there is need to consider the national or state growth with the growth due to local industries as well as other factors.
Moreover, to analyse the data base as per implementing the techniques there has been observation over several techniques such as:
National Component:
⊘ This is a preview!⊘
Do you want full access?
Subscribe today to unlock all pages.
Trusted by 1+ million students worldwide

To ascertain the requirements as well as determining the employment growth rate, First step is to consider the national growth
rate which will be helpful in measuring and analysing the rate of growth in the employment level over whole nation Pomarède &
et.al., (2018).
Structural component:
To demonstrate the employment rate in the economy there is need to have adequate analysis through various components
which will be with the consideration of national, state and local level of employment level in the areas ( What is shift share and how
does it work?, 2017). Thus, after analysing the national employment rate there will be analysis based on Structural components that
will be helpful as to have appropriate analysis. Similarly, this observation will be helpful in demonstrating the employment growth at
the regional level.
2006 2011
Changes in
employment
% change in
employment
Agriculture, Forestry and Fishing 14,312 12,024 -2,288 -15.99%
Mining 1,192 2,374 1,182 99.16%
Manufacturing 3,496 3,675 179 5.12%
Electricity, Gas, Water and Waste Services 554 720 166 29.96%
Construction 3,898 4,649 751 19.27%
Wholesale Trade 2,029 1,923 -106 -5.22%
Retail Trade 5,527 5,578 51 0.92%
Accommodation and Food Services 2,733 2,997 264 9.66%
Transport, Postal and Warehousing 2,387 2,750 363 15.21%
Paraphrase This Document
Need a fresh take? Get an instant paraphrase of this document with our AI Paraphraser
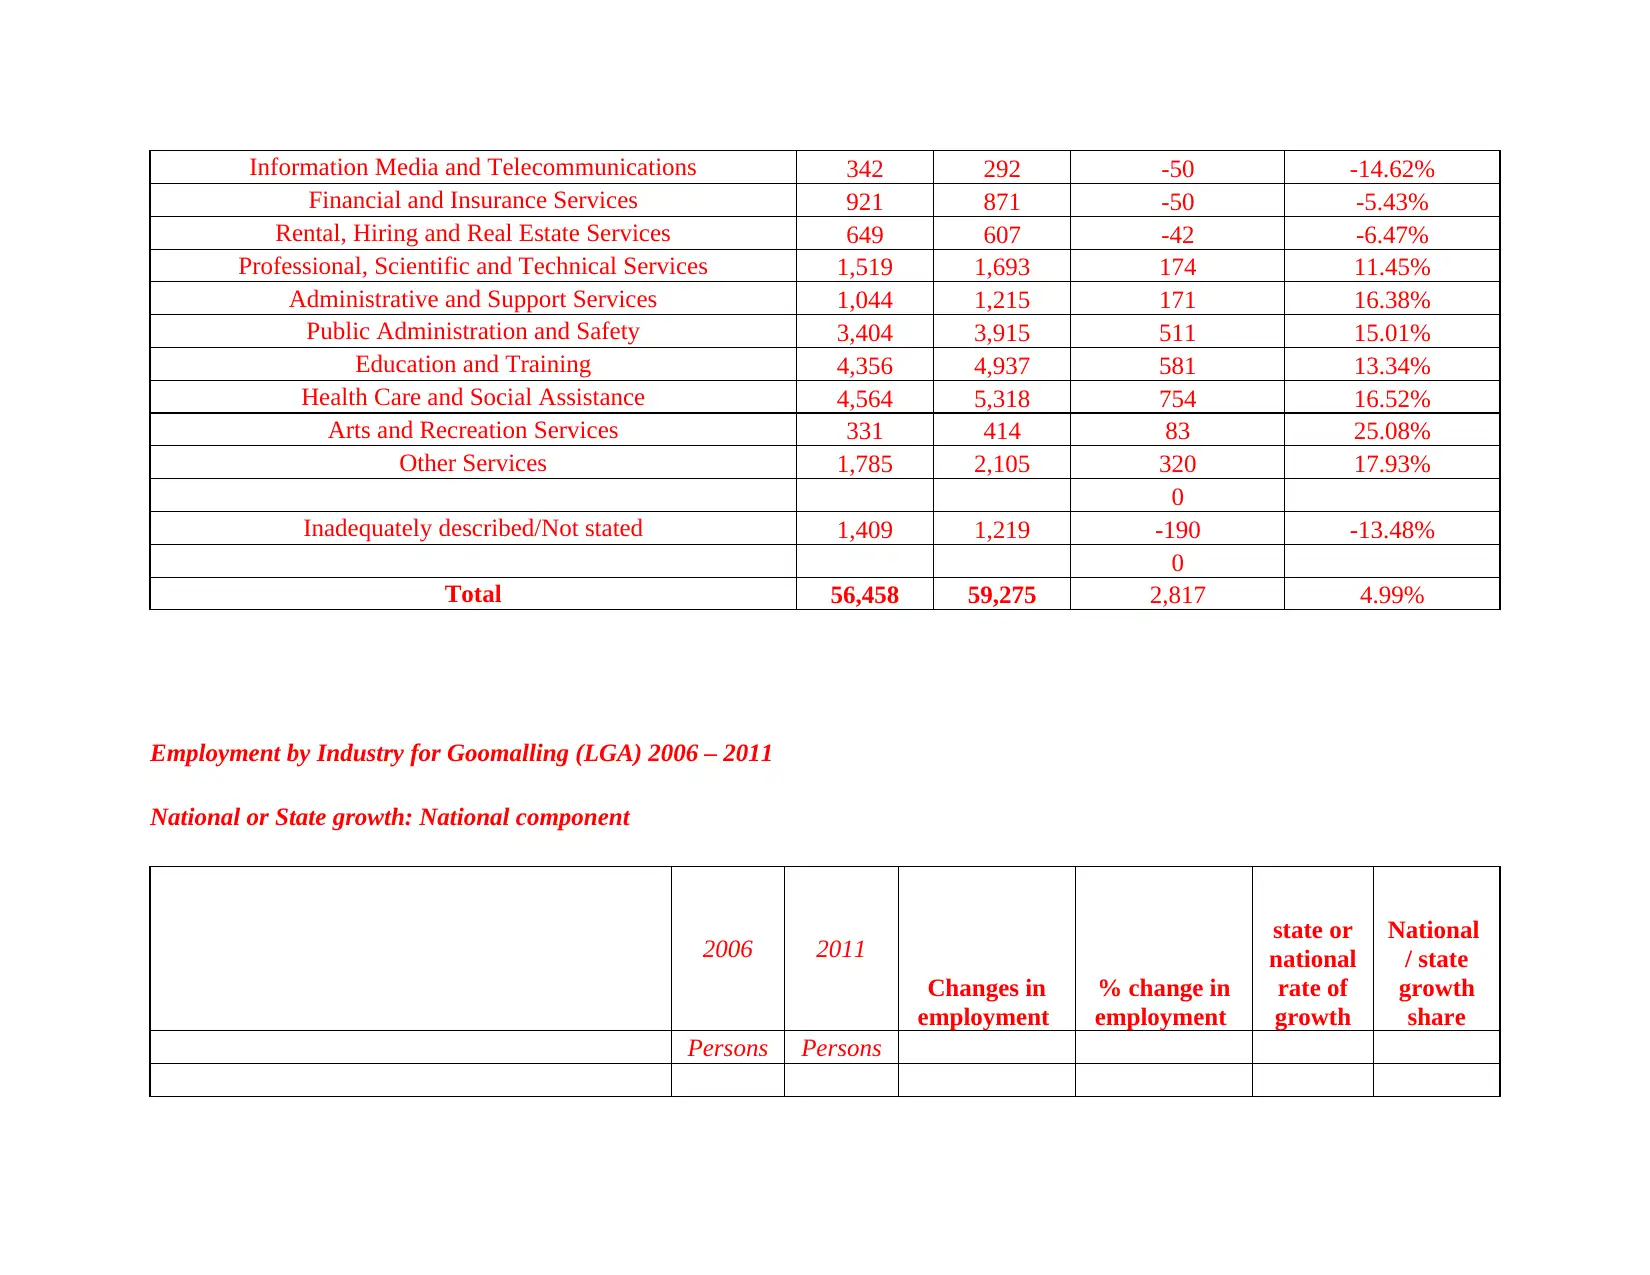
Information Media and Telecommunications 342 292 -50 -14.62%
Financial and Insurance Services 921 871 -50 -5.43%
Rental, Hiring and Real Estate Services 649 607 -42 -6.47%
Professional, Scientific and Technical Services 1,519 1,693 174 11.45%
Administrative and Support Services 1,044 1,215 171 16.38%
Public Administration and Safety 3,404 3,915 511 15.01%
Education and Training 4,356 4,937 581 13.34%
Health Care and Social Assistance 4,564 5,318 754 16.52%
Arts and Recreation Services 331 414 83 25.08%
Other Services 1,785 2,105 320 17.93%
0
Inadequately described/Not stated 1,409 1,219 -190 -13.48%
0
Total 56,458 59,275 2,817 4.99%
Employment by Industry for Goomalling (LGA) 2006 – 2011
National or State growth: National component
2006 2011
Changes in
employment
% change in
employment
state or
national
rate of
growth
National
/ state
growth
share
Persons Persons

Agriculture, Forestry and Fishing 182 149 -33 -18.1% 4.99% 9.08
Mining 9 9 0 0.0% 4.99% 0.45
Manufacturing 12 13 1 8.3% 4.99% 0.60
Electricity, Gas, Water and Waste Services 0 3 3 0.0% 4.99% 0.00
Construction 12 23 11 91.7% 4.99% 0.60
Wholesale Trade 8 5 -3 -37.5% 4.99% 0.40
Retail Trade 34 43 9 26.5% 4.99% 1.70
Accommodation and Food Services 11 12 1 9.1% 4.99% 0.55
Transport, Postal and Warehousing 16 18 2 12.5% 4.99% 0.80
Information Media and Telecommunications 0 0 0 #DIV/0! 4.99% 0.00
Financial and Insurance Services 9 10 1 11.1% 4.99% 0.45
Rental, Hiring and Real Estate Services 3 0 -3 -100.0% 4.99% 0.15
Professional, Scientific and Technical Services 12 8 -4 -33.3% 4.99% 0.60
Administrative and Support Services 0 4 4 #DIV/0! 4.99% 0.00
Public Administration and Safety 38 47 9 23.7% 4.99% 1.90
Education and Training 28 28 0 0.0% 4.99% 1.40
Health Care and Social Assistance 40 40 0 0.0% 4.99% 2.00
Arts and Recreation Services 5 0 -5 -100.0% 4.99% 0.25
Other Services 19 22 3 15.8% 4.99% 0.95
0
Inadequately described/Not stated 6 10 4 66.7% 4.99% 0.30
0
Total 449 446 -3 -0.7% 22.15
Structural Component (Industrial Mix Share)
⊘ This is a preview!⊘
Do you want full access?
Subscribe today to unlock all pages.
Trusted by 1+ million students worldwide
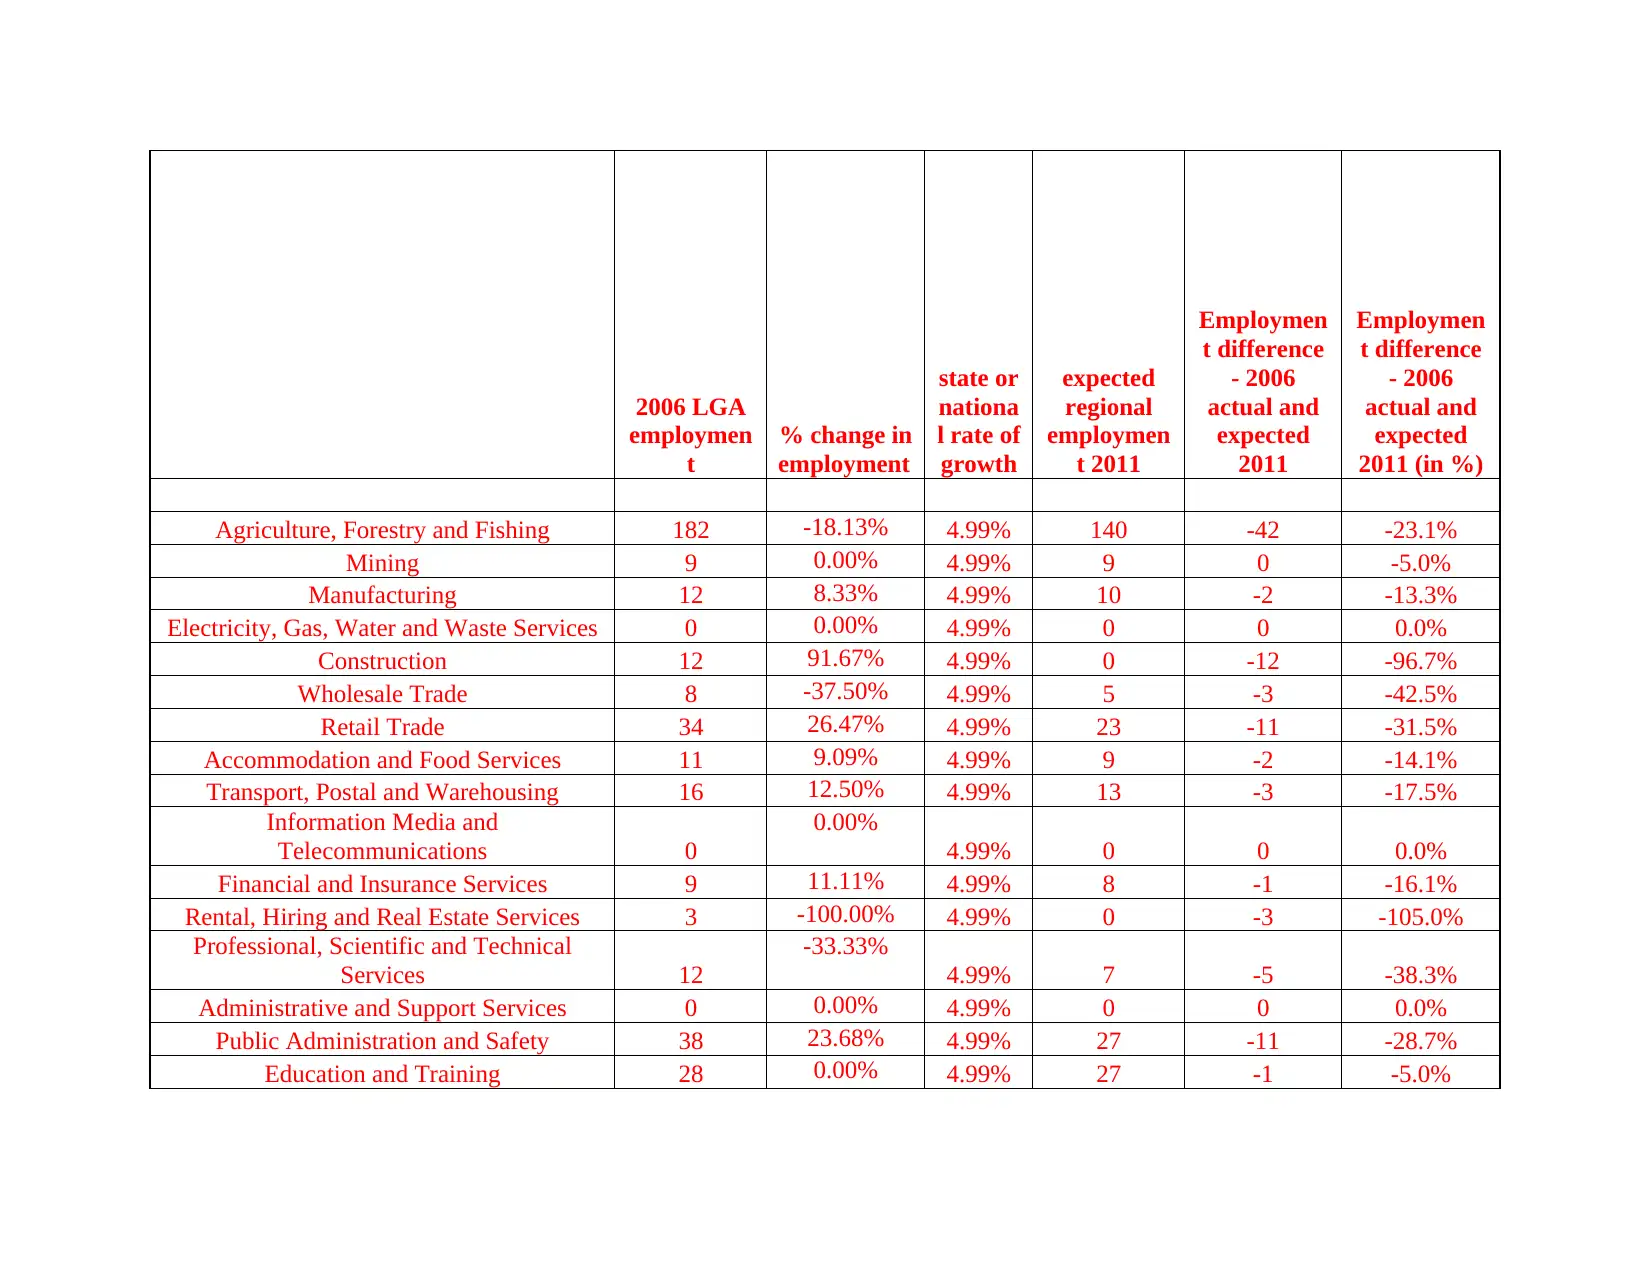
2006 LGA
employmen
t
% change in
employment
state or
nationa
l rate of
growth
expected
regional
employmen
t 2011
Employmen
t difference
- 2006
actual and
expected
2011
Employmen
t difference
- 2006
actual and
expected
2011 (in %)
Agriculture, Forestry and Fishing 182 -18.13% 4.99% 140 -42 -23.1%
Mining 9 0.00% 4.99% 9 0 -5.0%
Manufacturing 12 8.33% 4.99% 10 -2 -13.3%
Electricity, Gas, Water and Waste Services 0 0.00% 4.99% 0 0 0.0%
Construction 12 91.67% 4.99% 0 -12 -96.7%
Wholesale Trade 8 -37.50% 4.99% 5 -3 -42.5%
Retail Trade 34 26.47% 4.99% 23 -11 -31.5%
Accommodation and Food Services 11 9.09% 4.99% 9 -2 -14.1%
Transport, Postal and Warehousing 16 12.50% 4.99% 13 -3 -17.5%
Information Media and
Telecommunications 0
0.00%
4.99% 0 0 0.0%
Financial and Insurance Services 9 11.11% 4.99% 8 -1 -16.1%
Rental, Hiring and Real Estate Services 3 -100.00% 4.99% 0 -3 -105.0%
Professional, Scientific and Technical
Services 12
-33.33%
4.99% 7 -5 -38.3%
Administrative and Support Services 0 0.00% 4.99% 0 0 0.0%
Public Administration and Safety 38 23.68% 4.99% 27 -11 -28.7%
Education and Training 28 0.00% 4.99% 27 -1 -5.0%
employmen
t
% change in
employment
state or
nationa
l rate of
growth
expected
regional
employmen
t 2011
Employmen
t difference
- 2006
actual and
expected
2011
Employmen
t difference
- 2006
actual and
expected
2011 (in %)
Agriculture, Forestry and Fishing 182 -18.13% 4.99% 140 -42 -23.1%
Mining 9 0.00% 4.99% 9 0 -5.0%
Manufacturing 12 8.33% 4.99% 10 -2 -13.3%
Electricity, Gas, Water and Waste Services 0 0.00% 4.99% 0 0 0.0%
Construction 12 91.67% 4.99% 0 -12 -96.7%
Wholesale Trade 8 -37.50% 4.99% 5 -3 -42.5%
Retail Trade 34 26.47% 4.99% 23 -11 -31.5%
Accommodation and Food Services 11 9.09% 4.99% 9 -2 -14.1%
Transport, Postal and Warehousing 16 12.50% 4.99% 13 -3 -17.5%
Information Media and
Telecommunications 0
0.00%
4.99% 0 0 0.0%
Financial and Insurance Services 9 11.11% 4.99% 8 -1 -16.1%
Rental, Hiring and Real Estate Services 3 -100.00% 4.99% 0 -3 -105.0%
Professional, Scientific and Technical
Services 12
-33.33%
4.99% 7 -5 -38.3%
Administrative and Support Services 0 0.00% 4.99% 0 0 0.0%
Public Administration and Safety 38 23.68% 4.99% 27 -11 -28.7%
Education and Training 28 0.00% 4.99% 27 -1 -5.0%
Paraphrase This Document
Need a fresh take? Get an instant paraphrase of this document with our AI Paraphraser
Health Care and Social Assistance 40 0.00% 4.99% 38 -2 -5.0%
Arts and Recreation Services 5 -100.00% 4.99% 0 -5 -105.0%
Other Services 19 15.79% 4.99% 15 -4 -20.8%
0 0.00% 0 0
Inadequately described/Not stated 6 66.67% 4.99% 2 -4 -71.7%
0 0.00%
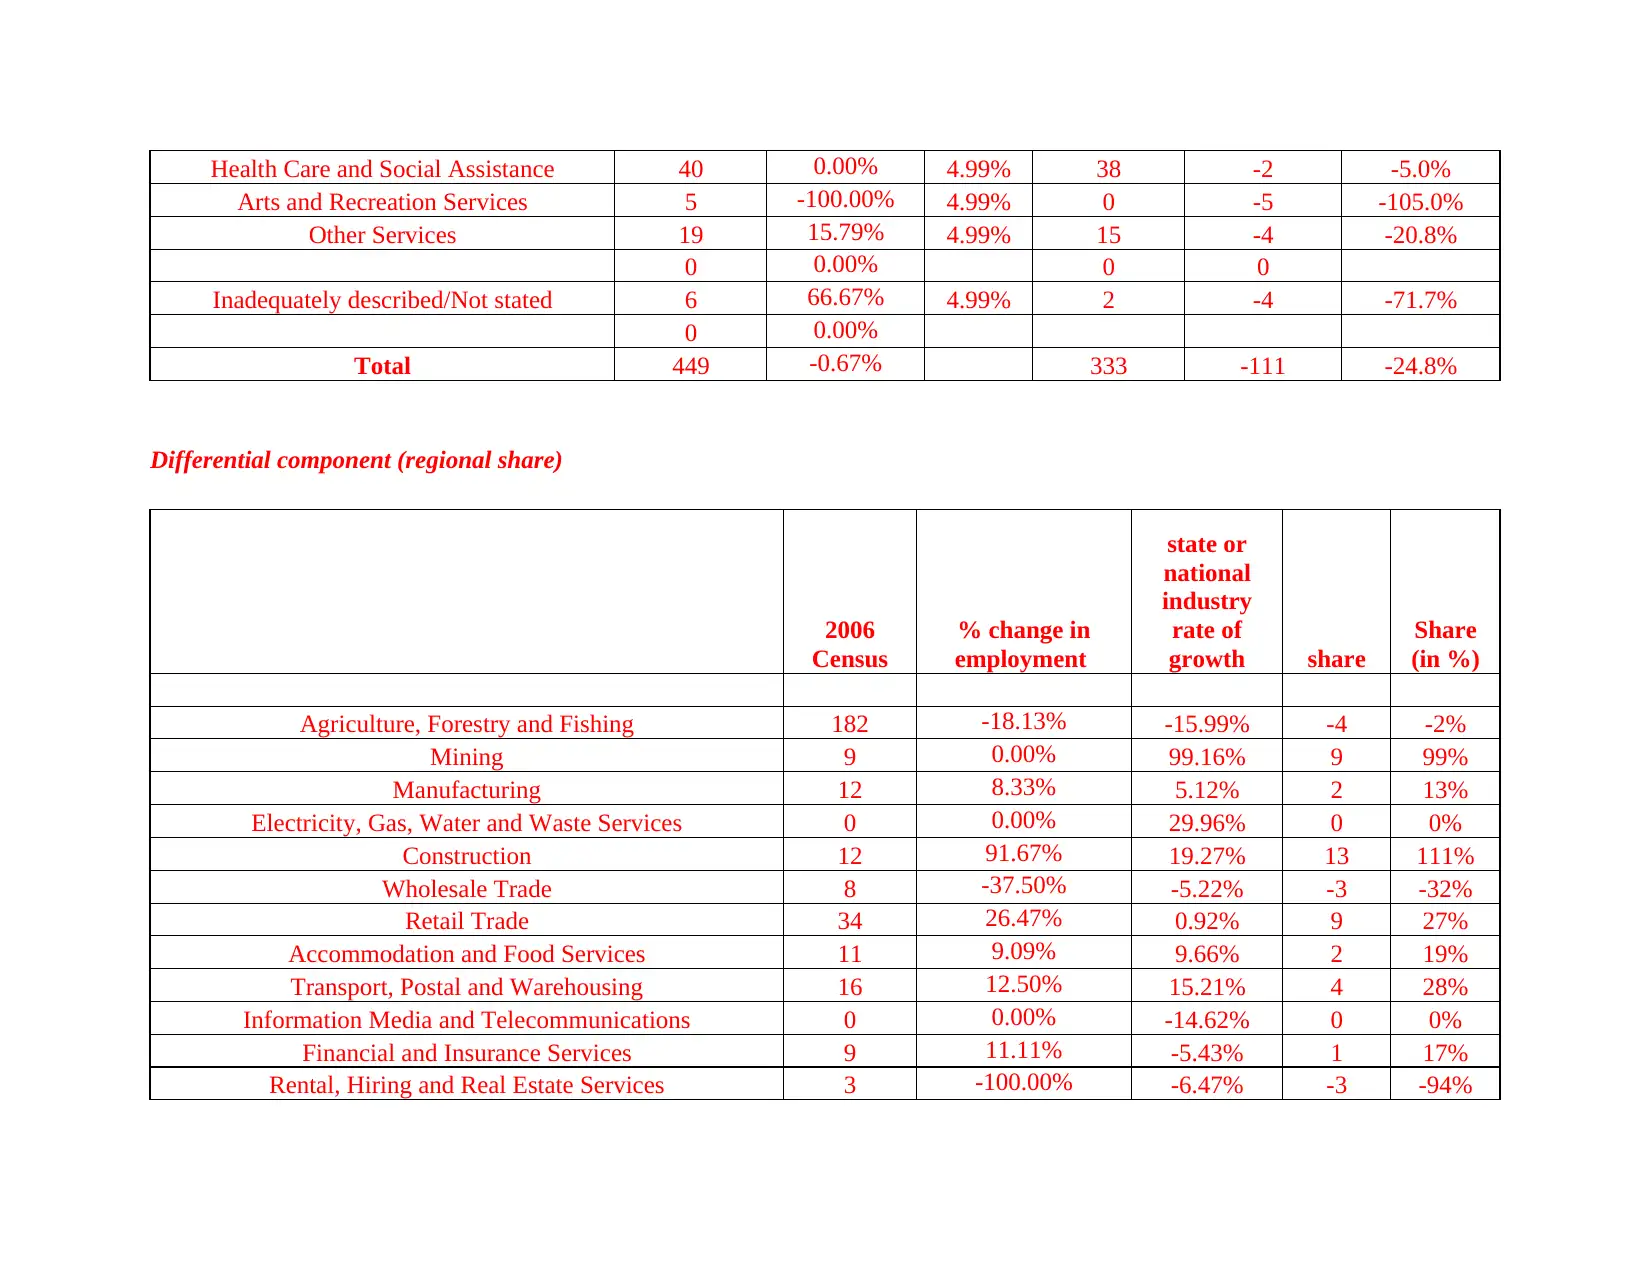
Total 449 -0.67% 333 -111 -24.8%
Differential component (regional share)
2006
Census
% change in
employment
state or
national
industry
rate of
growth share
Share
(in %)
Agriculture, Forestry and Fishing 182 -18.13% -15.99% -4 -2%
Mining 9 0.00% 99.16% 9 99%
Manufacturing 12 8.33% 5.12% 2 13%
Electricity, Gas, Water and Waste Services 0 0.00% 29.96% 0 0%
Construction 12 91.67% 19.27% 13 111%
Wholesale Trade 8 -37.50% -5.22% -3 -32%
Retail Trade 34 26.47% 0.92% 9 27%
Accommodation and Food Services 11 9.09% 9.66% 2 19%
Transport, Postal and Warehousing 16 12.50% 15.21% 4 28%
Information Media and Telecommunications 0 0.00% -14.62% 0 0%
Financial and Insurance Services 9 11.11% -5.43% 1 17%
Rental, Hiring and Real Estate Services 3 -100.00% -6.47% -3 -94%
Arts and Recreation Services 5 -100.00% 4.99% 0 -5 -105.0%
Other Services 19 15.79% 4.99% 15 -4 -20.8%
0 0.00% 0 0
Inadequately described/Not stated 6 66.67% 4.99% 2 -4 -71.7%
0 0.00%
Total 449 -0.67% 333 -111 -24.8%
Differential component (regional share)
2006
Census
% change in
employment
state or
national
industry
rate of
growth share
Share
(in %)
Agriculture, Forestry and Fishing 182 -18.13% -15.99% -4 -2%
Mining 9 0.00% 99.16% 9 99%
Manufacturing 12 8.33% 5.12% 2 13%
Electricity, Gas, Water and Waste Services 0 0.00% 29.96% 0 0%
Construction 12 91.67% 19.27% 13 111%
Wholesale Trade 8 -37.50% -5.22% -3 -32%
Retail Trade 34 26.47% 0.92% 9 27%
Accommodation and Food Services 11 9.09% 9.66% 2 19%
Transport, Postal and Warehousing 16 12.50% 15.21% 4 28%
Information Media and Telecommunications 0 0.00% -14.62% 0 0%
Financial and Insurance Services 9 11.11% -5.43% 1 17%
Rental, Hiring and Real Estate Services 3 -100.00% -6.47% -3 -94%

Professional, Scientific and Technical Services 12 -33.33% 11.45% -3 -22%
Administrative and Support Services 0 0.00% 16.38% 0 0%
Public Administration and Safety 38 23.68% 15.01% 15 39%
Education and Training 28 0.00% 13.34% 4 13%
Health Care and Social Assistance 40 0.00% 16.52% 7 17%
Arts and Recreation Services 5 0.00% 25.08% 1 25%
Other Services 19 15.79% 17.93% 6 34%
0.00% 0
Inadequately described/Not stated 6 66.67% -13.48% 5 80%
Total 449 -0.67% 4.99% 67 15%
Regional employment growth National state component Structural component Differential component
-3 22.15 -111 67
-0.7% 4.99% -24.8% 15%
Interpretation: In relation with analysing the employment rate in the country, state and regional level. There has been analysis
were made as to ascertain the adequate requirements industries and the numbers of jobs in the particular area. Thus, after analysing the
data set and the outcomes derived here which demonstrates that there are favourable industrial mixes on which the labour market is
dominating the industries mainly in the state area. Thus, the results present the appropriate analysis over the growth of industries as
well as numbers of jobs during the period Saito & et.al., (2018). Similarity, as per analysed here the regional employment growth is in
negative output such as -3 which determines that there the regional level of employment rate is not than adequate or on unfavourable
state as per requirements. Therefore, it has reflected the negative outcomes of -0.70%. There has been negative fall share prices of the
regional employment growth.
⊘ This is a preview!⊘
Do you want full access?
Subscribe today to unlock all pages.
Trusted by 1+ million students worldwide

In relation with the national state component of analysis it can be said that there are various analysis which will be helpful to
them as to have adequate analysis over the growth of employment and share value at national state level. In relation with analysis ng
the outcomes which determines here that there are positive results which will be helpful for making the appropriate observation as the
growth in the job opportunities and industries are on the favourable state Bonet-Morón, (2017). There has been rise in the employment
growth for 22.15 such as 4.99%. Thus, it can be said that the national level of industries are doing well in compared with the regional
industries. There are positive growth has been seen during the period.
In context with analysing the structural component there has been negative outcomes which were derived. Therefore, as per
analysing the structural component which reflects the negative outcome of -111 that reflects that there are negative fall in the
employment level as well as jobs in the nation Cordina-Duverger & et.al., (2018). The level of employment opportunities in the
structural component is not satisfactory as it has reflected the negative share of -24.8%. Thus, to improve the employments
opportunities in the workplace there is need to have satisfactory development of the small scale entities.
The differential component has been analysed here as to have appropriate reasoning behind the outcomes. Thus, it can be said
that there are positive result which is 67 of the analysed data set Igarashi & et.al., (2017). Thus, it reflects here that 15% of the growth
has been made in the employment level of the state and local governmental area. However, these are the outcomes of the analysis of
the job opportunities of all the sectors in the various categorised areas which states that there is need to have development in the
regional level of employment opportunities which will be effective and helpful to the professionals to have the appropriate jobs, the
government need to plan the strategies which will encourage small or regional level of industries in making the appropriate efforts as
to have the appropriate growth.
It will be recommendation to the regional, state and national level of government to have the appropriate increment in the
funds for the industries as to have appropriate growth. Moreover, there is need to implement several change in governmental plans and
policies which will be helpful in improving the employment growth and share rate in the environment Abreu & et.al., (2017). To
Paraphrase This Document
Need a fresh take? Get an instant paraphrase of this document with our AI Paraphraser

balance the labour market in Australia there is need to consider about the numbers of individual seeking jobs in the particular field and
to develop the appropriate numbers of firms to meet their expectations.
CONCLUSION
On the basis of above analysis it can be said that there have been use of Shit- share techniques to analyse the employment
growth rate in all the area which were categories by the researcher for better observations. Moreover, the study is base on collecting
the data and analysing the growth rate as well as making the satisfactory analysis over such outcomes. Thus, in relation with analysing
such outcomes, the demonstration has been derived that the government need to make appropriate planning to improve the regional
level of industries as well as improve the job opportunities.
REFERENCES
Books and Journals
Abreu, J. & et.al., (2017). Survey of Catch-up TV and other time-shift services: a comprehensive analysis and taxonomy of linear and
nonlinear television. Telecommunication Systems. 64(1). 57-74.
Bonet-Morón, J. A. (2017). El crecimiento regional en Colombia, 1980-1996: una aproximación con el método Shift-Share. Capítulos
de libro.
Cordina-Duverger, E. & et.al., (2018). Night shift work and breast cancer: a pooled analysis of population-based case–control studies
with complete work history.
Igarashi, H. & et.al., (2017). Possible link between interannual variation of neon flying squid (Ommastrephes bartramii) abundance in
the North Pacific and the climate phase shift in 1998/1999. Progress in oceanography. 150. 20-34.
Pomarède, P. & et.al., (2018). Damage Evaluation in Woven Glass Reinforced Polyamide 6.6/6 Composites Using Ultrasound Phase-
Shift Analysis and X-ray Tomography. Journal of Nondestructive Evaluation. 37(1). 12.
Saito, T. & et.al., (2018). Three-dimensional analysis of hemimetameric segmental shift in congenital scoliosis. Journal of Pediatric
Orthopaedics. 38(4). 217-222.
Yang, H., Tang, W. K., Chen, G., & Jiang, G. P. (2017). Multi-carrier chaos shift keying: System design and performance analysis.
IEEE Transactions on Circuits and Systems I: Regular Papers. 64(8). 2182-2194.
Online
⊘ This is a preview!⊘
Do you want full access?
Subscribe today to unlock all pages.
Trusted by 1+ million students worldwide
1 out of 13
Related Documents


Your All-in-One AI-Powered Toolkit for Academic Success.
+13062052269
info@desklib.com
Available 24*7 on WhatsApp / Email
![[object Object]](/_next/static/media/star-bottom.7253800d.svg)
Unlock your academic potential
Copyright © 2020–2025 A2Z Services. All Rights Reserved. Developed and managed by ZUCOL.