Conjoint Analysis: A Case Study of Sony
Added on 2022-11-14
14 Pages3991 Words176 Views
Running head: CONJOINT ANALYSIS: A CASE STUDY OF SONY 1
Conjoint Analysis: A Case Study of Sony
Name
Institution
Professor
Date
Conjoint Analysis: A Case Study of Sony
Name
Institution
Professor
Date
CONJOINT ANALYSIS: A CASE STUDY OF SONY 2
Conjoint Analysis: A Case Study of Sony
Introduction
Conjoint analysis is a statistical technique employed to investigate the choice preferences
of goods by consumers. The method employs quantitative measures and is used to measure the
market value of attributes of products under the study and make valid predictions of the sales
trends of the product (Shepherd, and Zacharakis 2018). For this research paper, conjoint analysis
has been employed to investigate the preferences of plasma televisions. The journal seeks to
explore the chances for Sony Technology Company introducing their brand of televisions to
compete with the likes of LG and Samsung who are already in the market. The study evaluates
three attributes that are believed to influence the consumers’ purchasing power; they include
brand either Samsung or Sony, screen size, refresh rate, display and the price of the television.
The brand has two measures either Samsung or Sony, screen size has two measures 75 inch and
65 inches, refresh rate is given as 120, resolution is given at 4000, and the price is represented as
either 4000 and 6000 dollars (Ben-Akiva, 2019). The primary objective of the research paper is
to evaluate the best products for Sony to invest in the market with a minimum risk contingency.
The journal seeks to present products that will be profitable and able to compete with the already
existing competitors of Samsung and LG in the Australian television market.
Regression analysis
In the determination of the part worth or the contribution of each attribute towards the
decision of buying a television regression analysis is used as shown in table 1.1 below. The
dependent variable for the regression model is the preference of television choice, which is
measured as a Likert of values 1 – 7 where one represents less preferable, and seven most
CONJOINT ANALYSIS: A CASE STUDY OF SONY 3
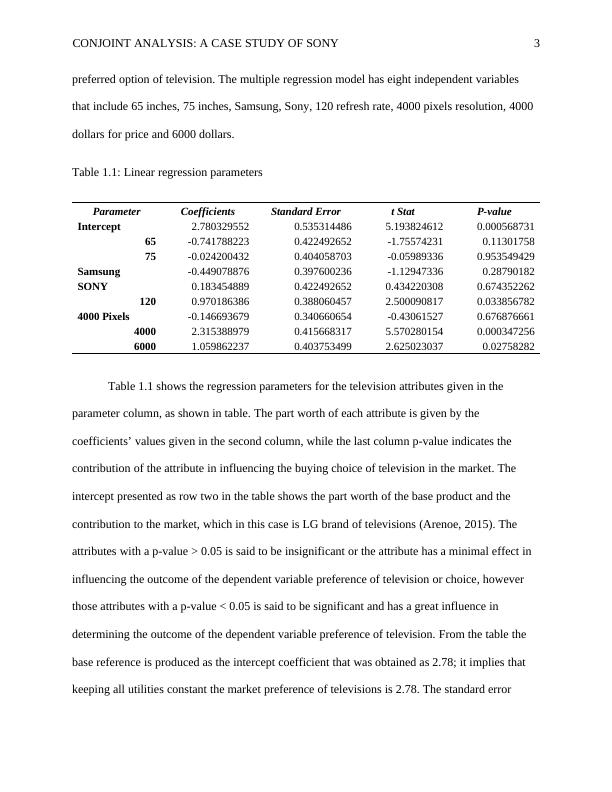
preferred option of television. The multiple regression model has eight independent variables
that include 65 inches, 75 inches, Samsung, Sony, 120 refresh rate, 4000 pixels resolution, 4000
dollars for price and 6000 dollars.
Table 1.1: Linear regression parameters
Parameter Coefficients Standard Error t Stat P-value
Intercept 2.780329552 0.535314486 5.193824612 0.000568731
65 -0.741788223 0.422492652 -1.75574231 0.11301758
75 -0.024200432 0.404058703 -0.05989336 0.953549429
Samsung -0.449078876 0.397600236 -1.12947336 0.28790182
SONY 0.183454889 0.422492652 0.434220308 0.674352262
120 0.970186386 0.388060457 2.500090817 0.033856782
4000 Pixels -0.146693679 0.340660654 -0.43061527 0.676876661
4000 2.315388979 0.415668317 5.570280154 0.000347256
6000 1.059862237 0.403753499 2.625023037 0.02758282
Table 1.1 shows the regression parameters for the television attributes given in the
parameter column, as shown in table. The part worth of each attribute is given by the
coefficients’ values given in the second column, while the last column p-value indicates the
contribution of the attribute in influencing the buying choice of television in the market. The
intercept presented as row two in the table shows the part worth of the base product and the
contribution to the market, which in this case is LG brand of televisions (Arenoe, 2015). The
attributes with a p-value > 0.05 is said to be insignificant or the attribute has a minimal effect in
influencing the outcome of the dependent variable preference of television or choice, however
those attributes with a p-value < 0.05 is said to be significant and has a great influence in
determining the outcome of the dependent variable preference of television. From the table the
base reference is produced as the intercept coefficient that was obtained as 2.78; it implies that
keeping all utilities constant the market preference of televisions is 2.78. The standard error
End of preview
Want to access all the pages? Upload your documents or become a member.
Related Documents
Marketing Analytics 1.lg...
|8
|1701
|1
Marketing Analytics: Conjoint Analysis for Curved TVslg...
|9
|2192
|98
Adopting Conjoint Analysis for Product Profile Identificationlg...
|12
|2490
|36