Contemporary Corporate Reporting Analysis of Lucky Lanka Milk
VerifiedAdded on 2023/06/03
|21
|3976
|365
Report
AI Summary
This report offers a comprehensive analysis of corporate reporting, focusing on Lucky Lanka Milk Processing Company. It begins by defining corporate reporting and its significance, alongside an overview of accounting standards. The core of the report evaluates Lucky Lanka's financial statements from 2013 to 2017, utilizing financial ratios such as gross profit, efficiency, liquidity, gearing, and investor ratios. A comparative analysis is performed against Lanka Milk Food Company. The report also assesses non-financial information, including corporate governance and social responsibility. The analysis reveals trends in the company's performance, highlighting areas of strength and weakness. This report is a valuable resource for students seeking to understand corporate financial reporting and analysis.
Running head: CONTEMPORARY CORPORATE REPORTING 1
Contemporary Corporate Reporting
Your Name
Name of Institution
Contemporary Corporate Reporting
Your Name
Name of Institution
Paraphrase This Document
Need a fresh take? Get an instant paraphrase of this document with our AI Paraphraser
CONTEMPORARY CORPORATE REPORTING 2
Contemporary Corporate Reporting.
Part A
Corporate Reporting
Corporate reporting meaning differs according or depending to the intended audience of
the financial statements, (Lee & Maxfield, 2015). Corporate reporting can be defined as the
disclosure and presentation features of reporting which are different from accounting and its
measurements. Corporate reporting includes narrative reporting, financial reporting, corporate
governance reporting, integrated reporting, executive remuneration reporting and corporate
responsibility reporting. Corporate reporting comprises of voluntary disclosures which help to
add value to financial statements and make it useful to stakeholders of the company and other
external users of financial statements like the investors. Corporate reporting provides
stakeholders with insights into the activities of a company and therefore ends up to affect the
share price, (Corporate reporting,2014). Companies implement audit committees which help
them in ensuring corporate reporting and this act requires companies to be accountable and
transparent. The corporation act 2001 requires companies to safeguard integrity by corporate
reporting.
Importance of Corporate Reporting
Corporate reporting is used by companies because it is relevant in that it helps in
prioritizing social, economic and environmental issues which are useful for strategic planning
purposes. It is relevant in that it helps companies to illustrate and identify highly material issues
which help in the long-term success of companies, (Everingham, Kana & Wadee, 2012).
Corporate reporting enables companies to build good connection with their stakeholders and
CONTEMPORARY CORPORATE REPORTING 3
investors. Companies produce corporate reports so as to give enough information to specific
users of financial statements. Corporate reporting also enables companies to provide information
about how they raise funds and how those funds are utilized in the course of business. Corporate
reporting also helps companies to access debt, equity and other trade finances. Companies
produce corporate reports in order to avail their information concerning the financial position
and financial performance and this makes it useful to a wide range of financial statement users in
evaluating the stewardship of management and be able to make useful economic decisions.
Accounting Standards
Accounting standards can be described as authoritative standards that are used in
financial reporting, (Sapovadia, 2008). Accounting standards are the basic source of the
generally accepted accounting principles, (GAAP). These standards provide specifications of
how transactions and other accounting events should be measured, recognized, presented and
disclosed in companies’ financial statements, (Rayman 2013). Accounting standards are policies
that are imperative to all the accounting activities and they help business to run their activities
smoothly. All companies are required to adhere to the accounting standards set by FASB and
IASB, failure to comply with this standards will lead companies spending on legal action
initiated against it by their governments.
Importance of Accounting Standards in Reporting
Accounting standards enable companies to provide external users such as lenders and
investor, with information which is useful in decision making, (Sugara & Boland, 2011).
Accounting standards help companies to assess their business performance and be able to
compare it with the performance of competitors through the use of financial statements.
⊘ This is a preview!⊘
Do you want full access?
Subscribe today to unlock all pages.
Trusted by 1+ million students worldwide
CONTEMPORARY CORPORATE REPORTING 4
Accounting standards enable companies to be transparent and by so doing they are able to
perform efficiently in the industry of operation, ( Al Frijat, 2016).
Accounting standards help in protecting the investors interests this is because if
companies adhere to the accounting standards they are able to provide the investors with genuine
and accurate reports which in return increases the investors’ confidence while making economic
decisions because they will have insights of how their money will be spend. Accounting
standards also help to prevent fraud both to the owners of businesses and customers. Accounting
standards also promote accountability and in the end making businesses to be efficient in
business transactions. Companies that adhere well to accounting standards are able to produce
financial statements that enable them to access investor capital. Accounting standards also help
in facilitation of reasonable assessment of business presentation and ensures good record keeping
by companies.
Part B
Introduction to Lucky Lanka Milk Processing Company.
Lucky Lanka milk processing company is situated in Sri Lanka and is majorly focused in
the field of milk processing in its aim to build a healthy nation. The company has a lot of
opportunities to supply its products over Sri Lanka. Its highly skilled and experienced staff uses
vast technology and fresh milk in production. Despite the fact that the company has this unique
features it has managed to acquire only 18% market share. The company currently manufactures
yoghurt and pasteurized milk. The products are of different flavors in yoghurt for example
vanilla, chocolate among others.
Paraphrase This Document
Need a fresh take? Get an instant paraphrase of this document with our AI Paraphraser
CONTEMPORARY CORPORATE REPORTING 5
Lucky Lanka operates in a very promising business environment because the country has
enhanced political stability which encourages local manufacturers to continue with productivity.
Due to this factors, the company has potential of investing in different places and succeed. The
economic condition shows that there is a possibility of future economic growth as there is also
enough supply of labor, (Proctor, 2007). The company is also affected by inflation, interest rates
and disposable income.
The target market expectations are very high due to increased consumer knowledge in
consumption of nutritious food. The company majorly deals with the production of nutritious
foods and this is an advantage to them due to fulfilling the social needs of customers. Lucky
Lanka faces stiff competition from top competitors such as New dale, Highland, Lanka milk food
and Kethmale. The customers have high bargaining power because they are aware of other
quality milk products. Threats of few quality milk products in the market and there are no
barriers of new entrance of milk products in the market. Milk products are purchased from a few
selected suppliers which raise the bargaining power of suppliers.
Evaluation of Financial Statements for The Recent Five Years.
The financial statements of the company for the last five years (2017 -2013) have been
prepared using the same accounting standards and same methods of computations which comply
with LKAS 34 interim financial reporting. There have not been any material events which have
been taking place after the balance sheet date which require some adjustments and disclosures in
the financial statements. There have been some little changes in the current classification of
items and where appropriate changes were done for example in the year 2016 and 2017. The
balance sheets produced by the company represent the true economic position of the company.
CONTEMPORARY CORPORATE REPORTING 6
Property plant and equipment is measured using the revaluation method. The company
reviews the residual values, methods of assets depreciation in each year of reporting. The
company derecognizes assets and financial liabilities. The company applies the carrying value
while measuring the associates and subsidiaries. The company tests the impairment of goodwill
in every financial year. The company prepares financial statements in accordance with Sri Lanka
accounting standards. Depreciation is calculated using straight-line method. Revenues, expenses
and assets are recognized using the net amount of tax. Property plant and equipment are
measured using the fair value. Revenue is measured using the fair value. The company engages
valuation specialists in determining the fair value of assets. Assets are valued over their useful
lives.
Evaluation of Non -Financial Information
Non-financial information deals with social and environmental aspects, (Maj 2018).
Lucky Lanka milk processing company reports on non-financial information. It reports on
corporate governance whereby it describes its decision making systems and how the stakeholders
directly or indirectly control the company activities. The board of directors are committed to
provide and ensuring business integrity and professionalism in all the activities of the business.
The board of directors is comprised of six members whereby two are executive members and
four are the non-executive members. The board members list the rules that are laid down by
Colombo stock exchange and submit the annual dependence declarations. The board members
work on an informed basis, due diligence, good faith and in the best interest of the company.
The company reports on the remuneration of the executive members and it has executive
committee which recommends the remuneration that is payable to the executive members. The
committee sets guidelines for the remuneration of other senior management of the company. The
⊘ This is a preview!⊘
Do you want full access?
Subscribe today to unlock all pages.
Trusted by 1+ million students worldwide
CONTEMPORARY CORPORATE REPORTING 7
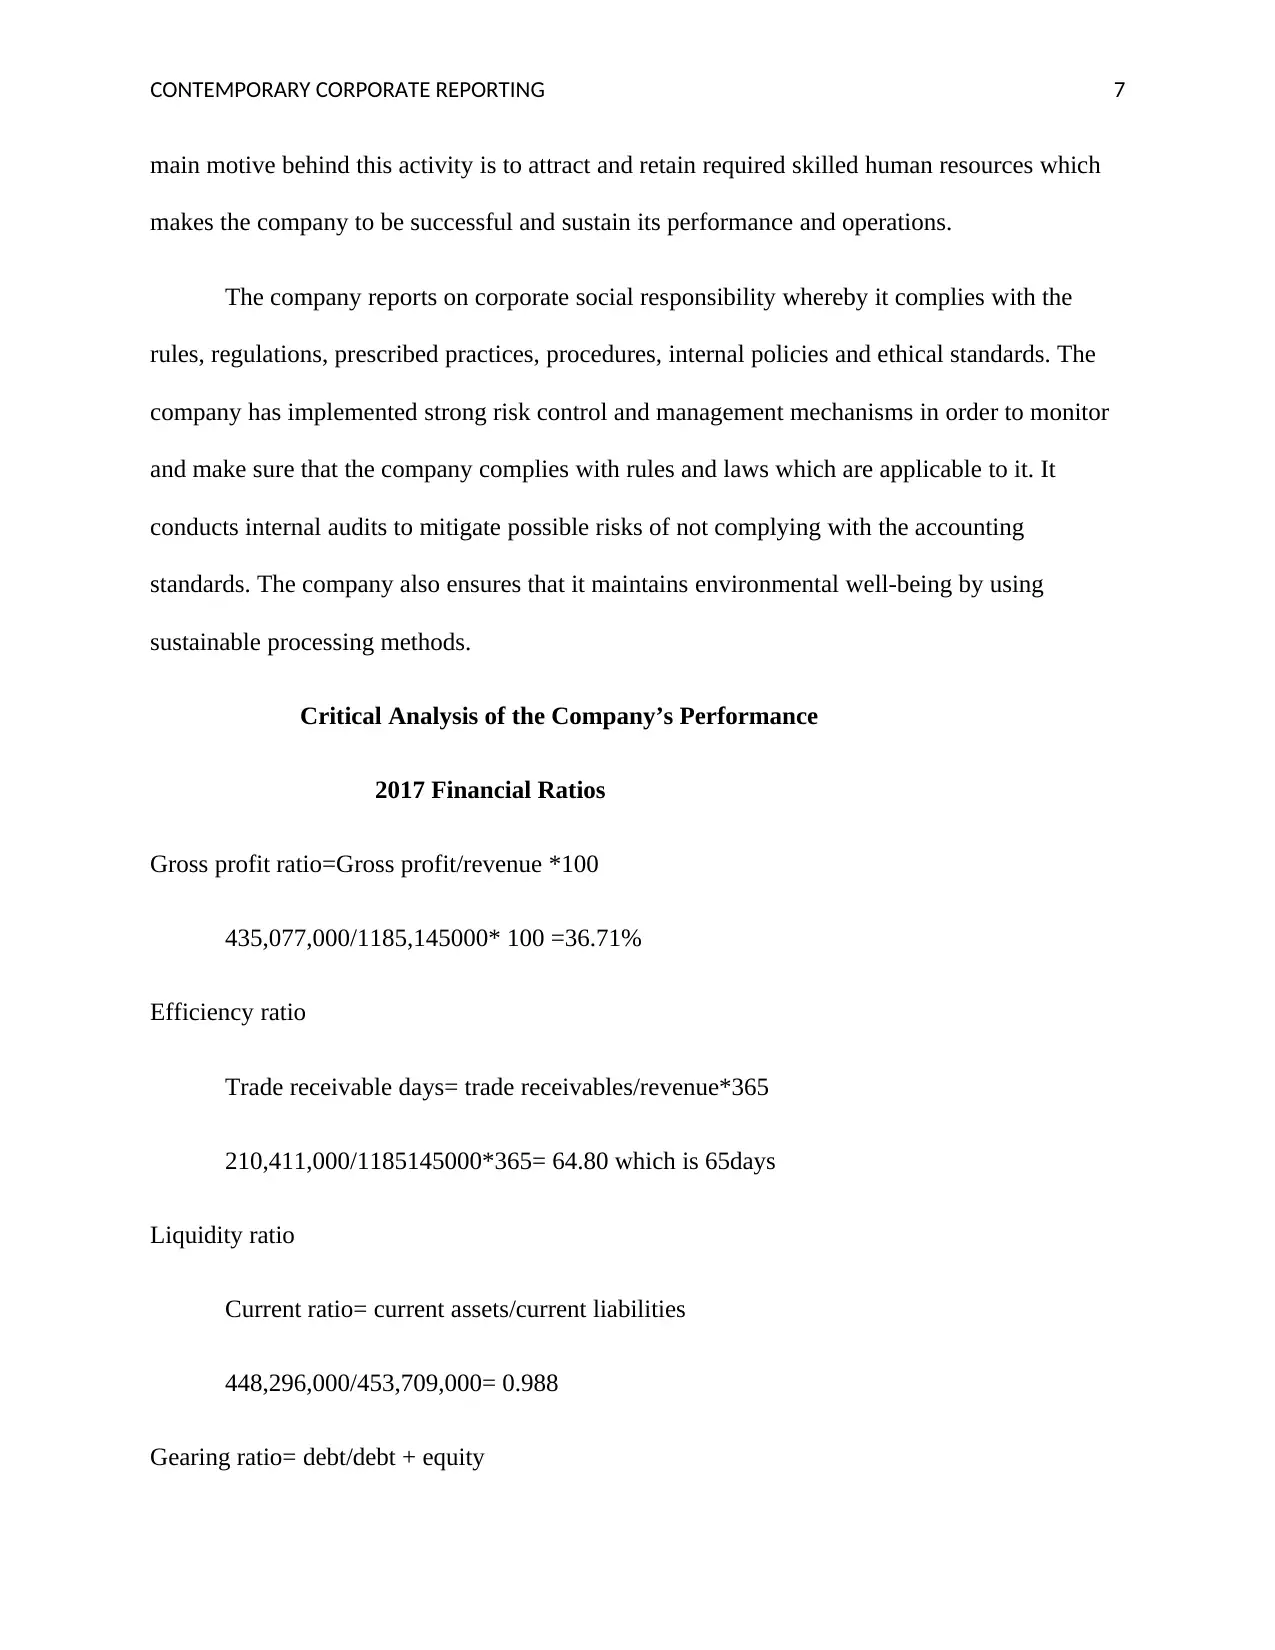
main motive behind this activity is to attract and retain required skilled human resources which
makes the company to be successful and sustain its performance and operations.
The company reports on corporate social responsibility whereby it complies with the
rules, regulations, prescribed practices, procedures, internal policies and ethical standards. The
company has implemented strong risk control and management mechanisms in order to monitor
and make sure that the company complies with rules and laws which are applicable to it. It
conducts internal audits to mitigate possible risks of not complying with the accounting
standards. The company also ensures that it maintains environmental well-being by using
sustainable processing methods.
Critical Analysis of the Company’s Performance
2017 Financial Ratios
Gross profit ratio=Gross profit/revenue *100
435,077,000/1185,145000* 100 =36.71%
Efficiency ratio
Trade receivable days= trade receivables/revenue*365
210,411,000/1185145000*365= 64.80 which is 65days
Liquidity ratio
Current ratio= current assets/current liabilities
448,296,000/453,709,000= 0.988
Gearing ratio= debt/debt + equity
Paraphrase This Document
Need a fresh take? Get an instant paraphrase of this document with our AI Paraphraser
CONTEMPORARY CORPORATE REPORTING 8
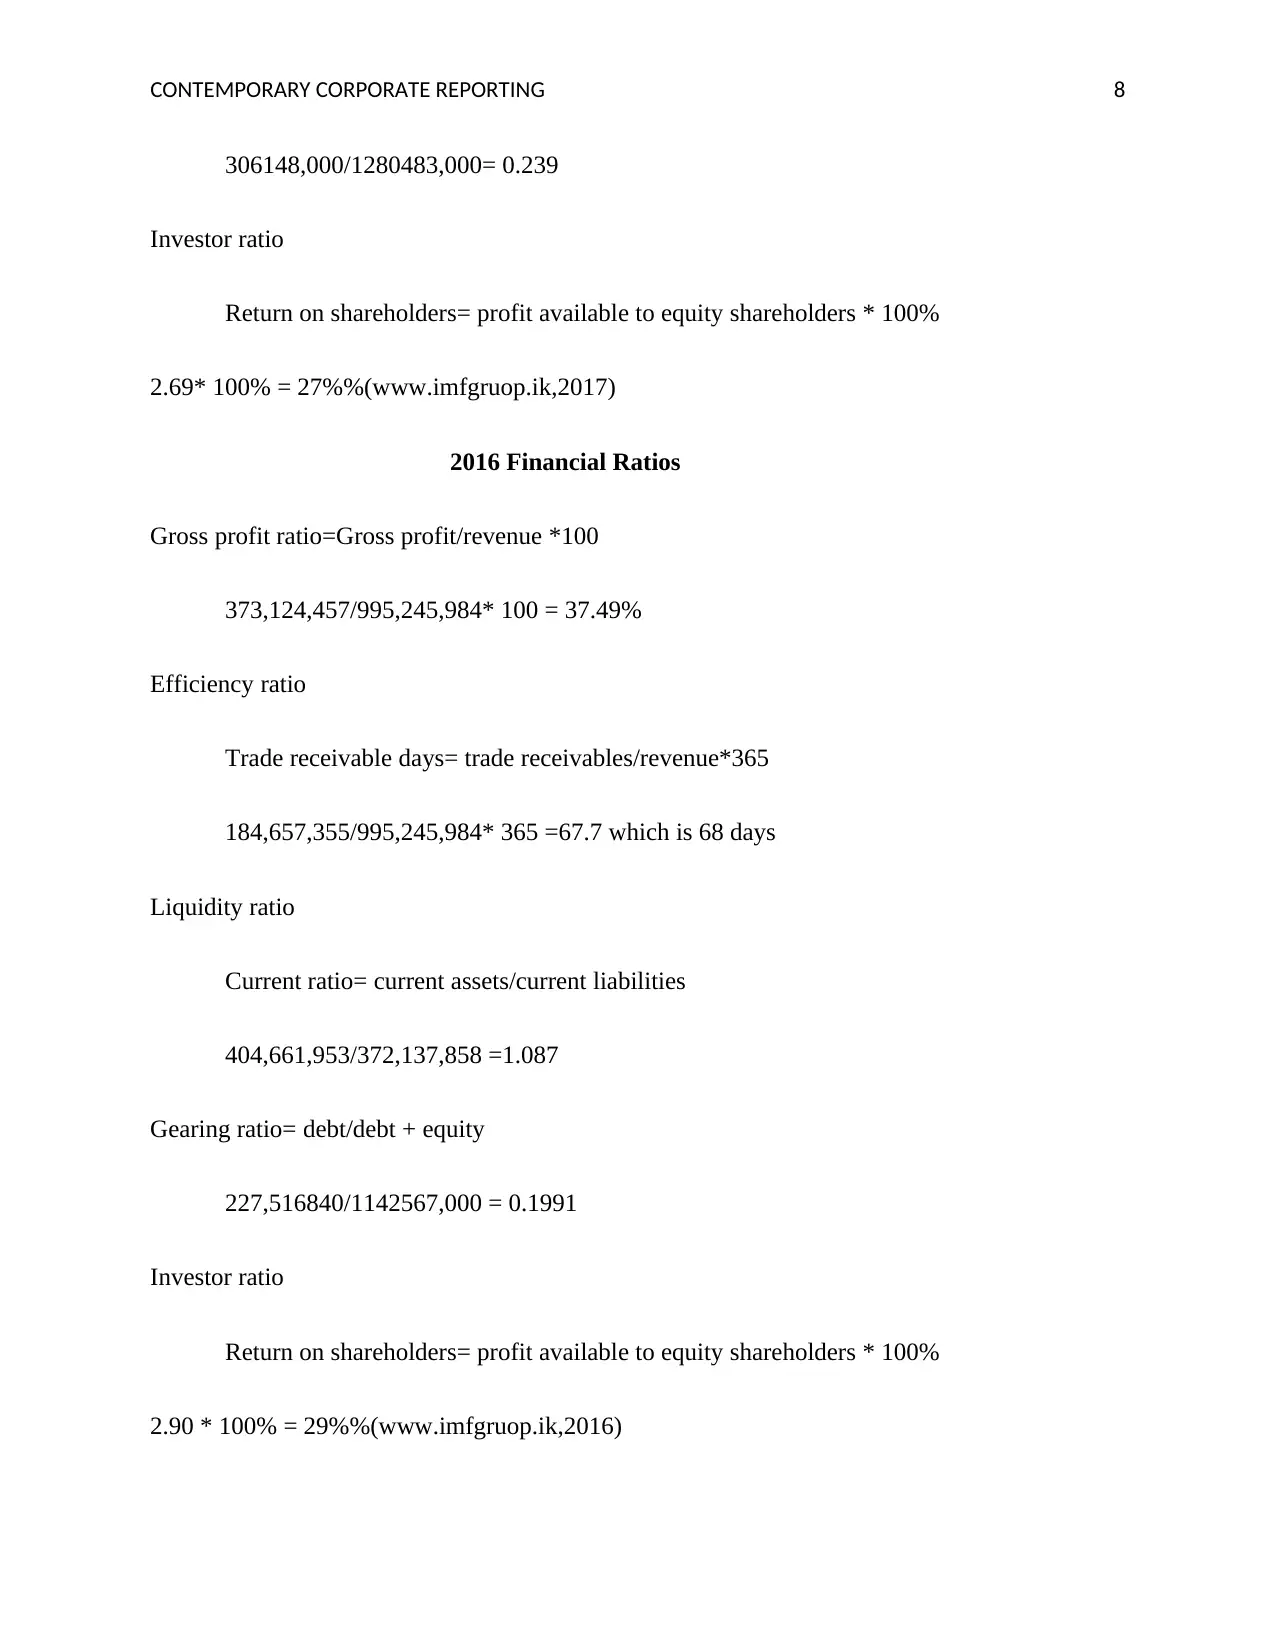
306148,000/1280483,000= 0.239
Investor ratio
Return on shareholders= profit available to equity shareholders * 100%
2.69* 100% = 27%%(www.imfgruop.ik,2017)
2016 Financial Ratios
Gross profit ratio=Gross profit/revenue *100
373,124,457/995,245,984* 100 = 37.49%
Efficiency ratio
Trade receivable days= trade receivables/revenue*365
184,657,355/995,245,984* 365 =67.7 which is 68 days
Liquidity ratio
Current ratio= current assets/current liabilities
404,661,953/372,137,858 =1.087
Gearing ratio= debt/debt + equity
227,516840/1142567,000 = 0.1991
Investor ratio
Return on shareholders= profit available to equity shareholders * 100%
2.90 * 100% = 29%%(www.imfgruop.ik,2016)
CONTEMPORARY CORPORATE REPORTING 9
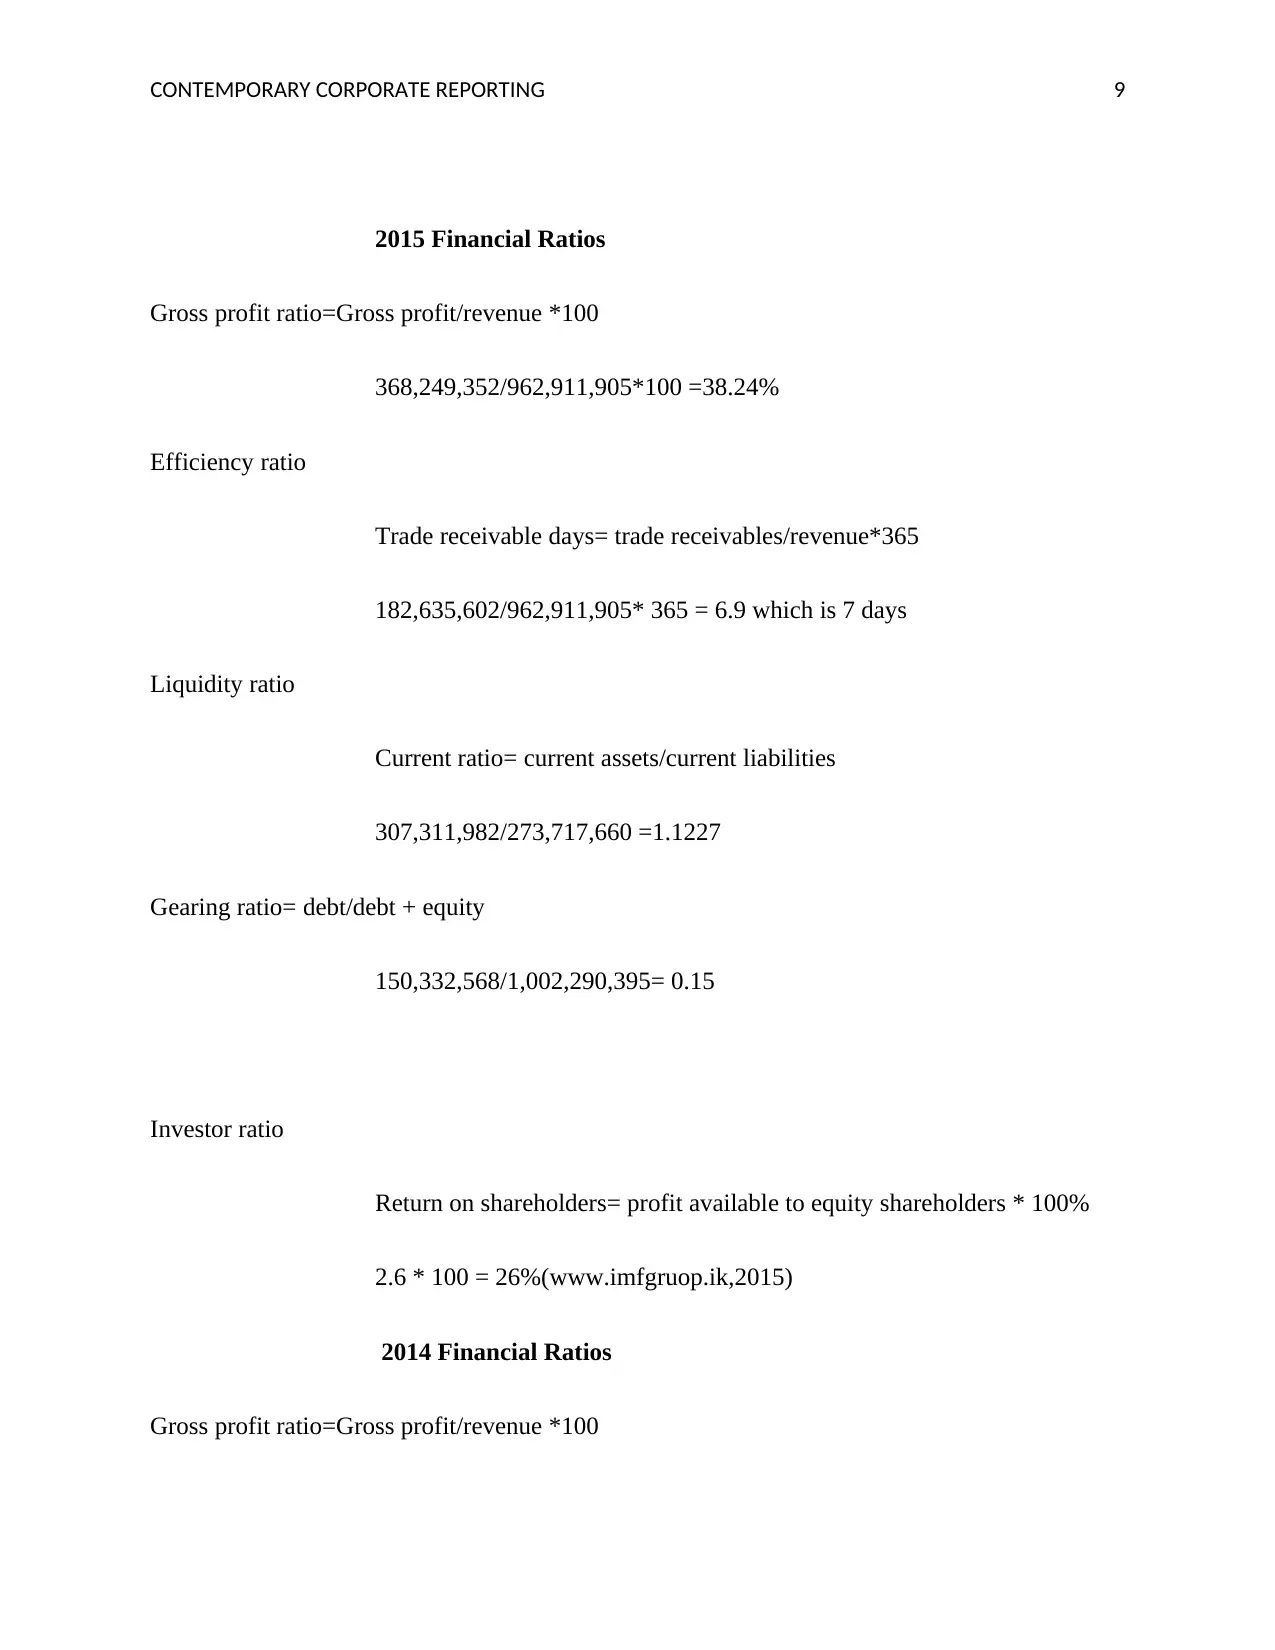
2015 Financial Ratios
Gross profit ratio=Gross profit/revenue *100
368,249,352/962,911,905*100 =38.24%
Efficiency ratio
Trade receivable days= trade receivables/revenue*365
182,635,602/962,911,905* 365 = 6.9 which is 7 days
Liquidity ratio
Current ratio= current assets/current liabilities
307,311,982/273,717,660 =1.1227
Gearing ratio= debt/debt + equity
150,332,568/1,002,290,395= 0.15
Investor ratio
Return on shareholders= profit available to equity shareholders * 100%
2.6 * 100 = 26%(www.imfgruop.ik,2015)
2014 Financial Ratios
Gross profit ratio=Gross profit/revenue *100
⊘ This is a preview!⊘
Do you want full access?
Subscribe today to unlock all pages.
Trusted by 1+ million students worldwide
CONTEMPORARY CORPORATE REPORTING 10
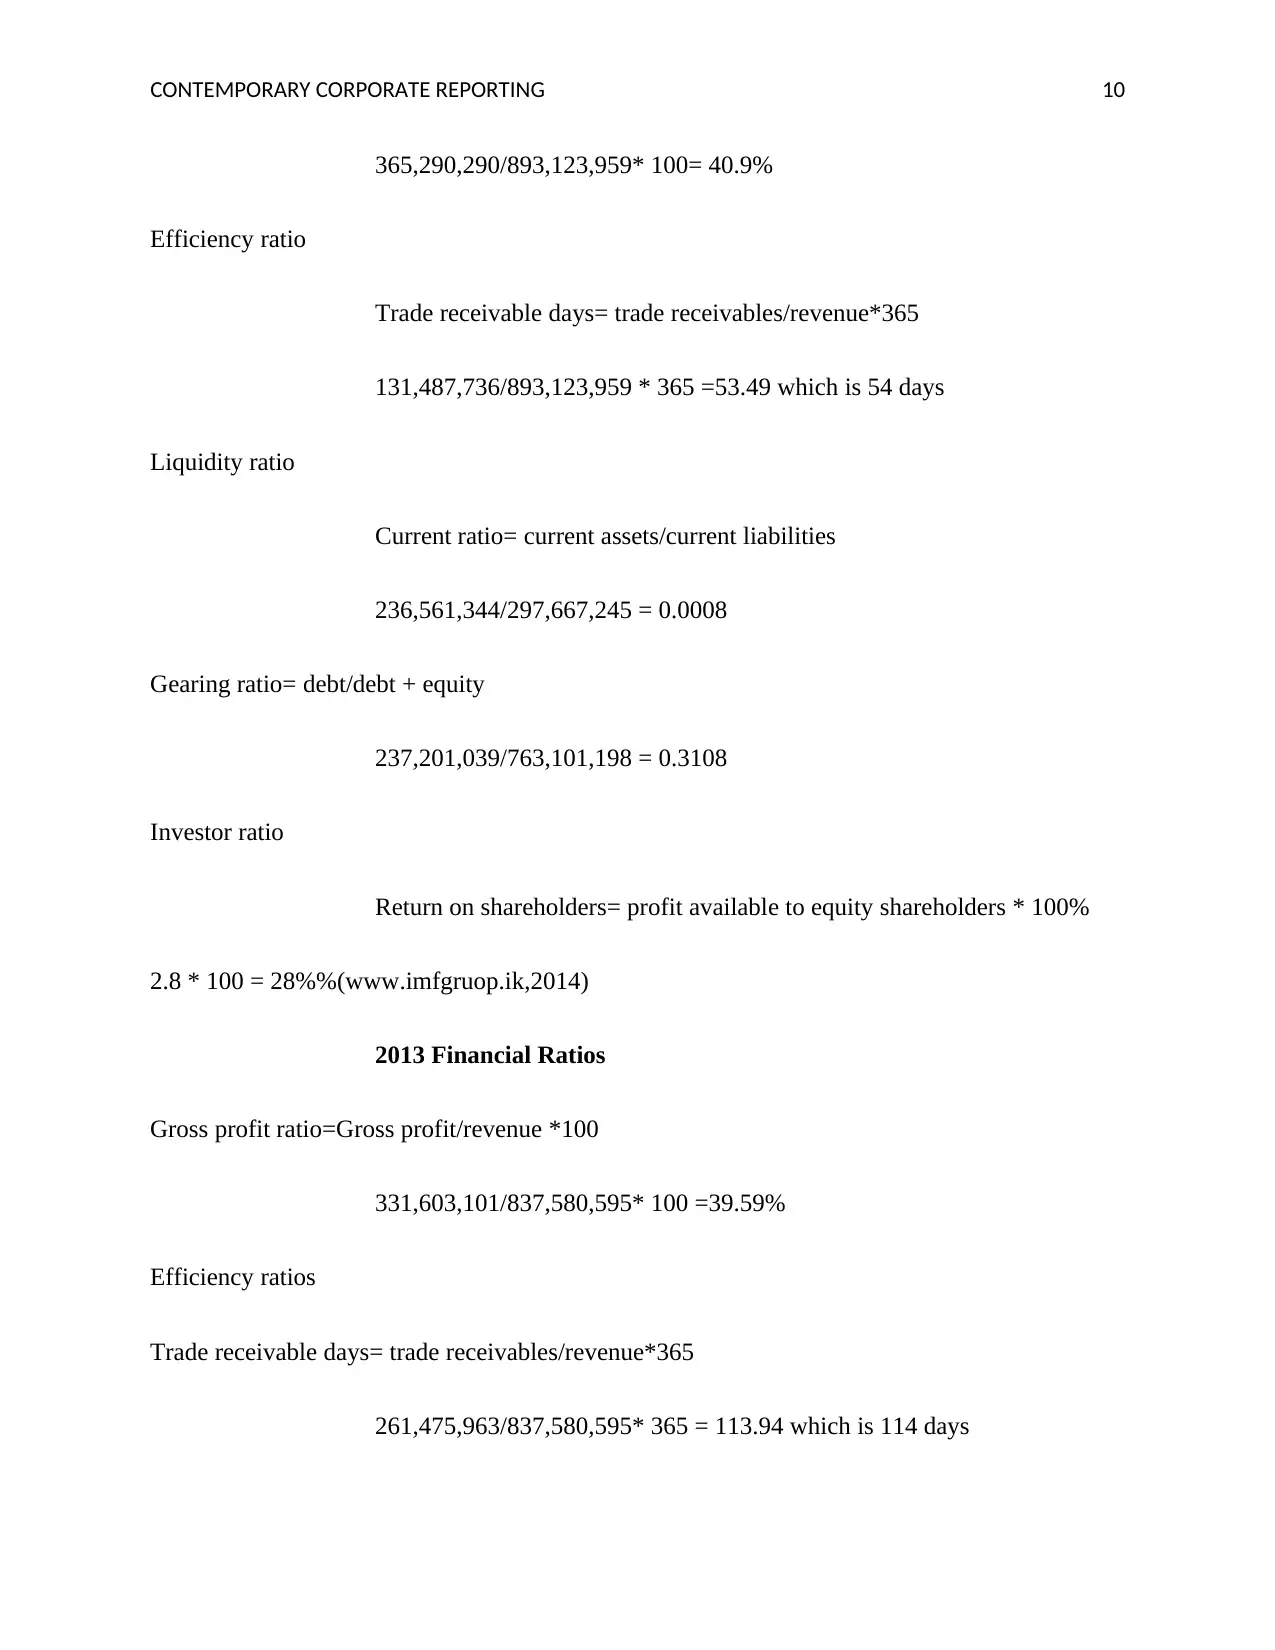
365,290,290/893,123,959* 100= 40.9%
Efficiency ratio
Trade receivable days= trade receivables/revenue*365
131,487,736/893,123,959 * 365 =53.49 which is 54 days
Liquidity ratio
Current ratio= current assets/current liabilities
236,561,344/297,667,245 = 0.0008
Gearing ratio= debt/debt + equity
237,201,039/763,101,198 = 0.3108
Investor ratio
Return on shareholders= profit available to equity shareholders * 100%
2.8 * 100 = 28%%(www.imfgruop.ik,2014)
2013 Financial Ratios
Gross profit ratio=Gross profit/revenue *100
331,603,101/837,580,595* 100 =39.59%
Efficiency ratios
Trade receivable days= trade receivables/revenue*365
261,475,963/837,580,595* 365 = 113.94 which is 114 days
Paraphrase This Document
Need a fresh take? Get an instant paraphrase of this document with our AI Paraphraser
CONTEMPORARY CORPORATE REPORTING 11
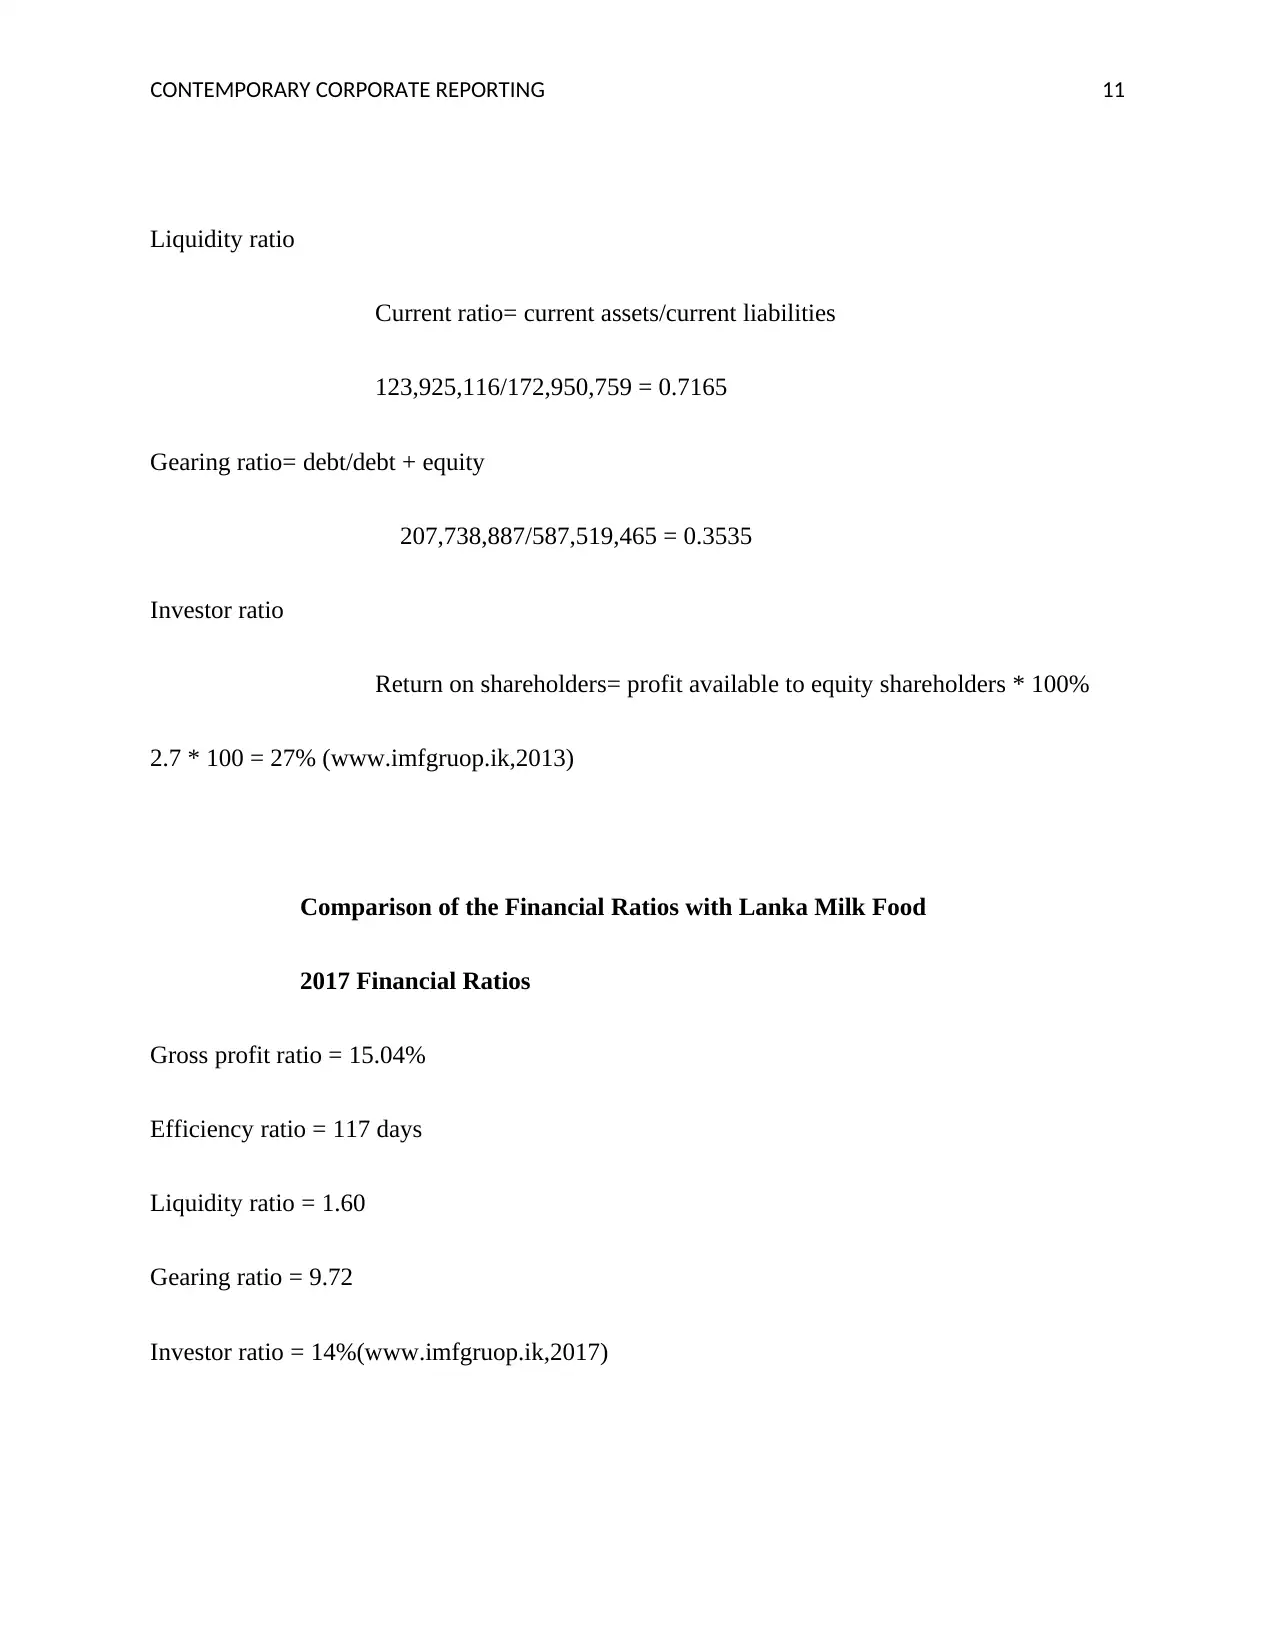
Liquidity ratio
Current ratio= current assets/current liabilities
123,925,116/172,950,759 = 0.7165
Gearing ratio= debt/debt + equity
207,738,887/587,519,465 = 0.3535
Investor ratio
Return on shareholders= profit available to equity shareholders * 100%
2.7 * 100 = 27% (www.imfgruop.ik,2013)
Comparison of the Financial Ratios with Lanka Milk Food
2017 Financial Ratios
Gross profit ratio = 15.04%
Efficiency ratio = 117 days
Liquidity ratio = 1.60
Gearing ratio = 9.72
Investor ratio = 14%(www.imfgruop.ik,2017)
CONTEMPORARY CORPORATE REPORTING 12
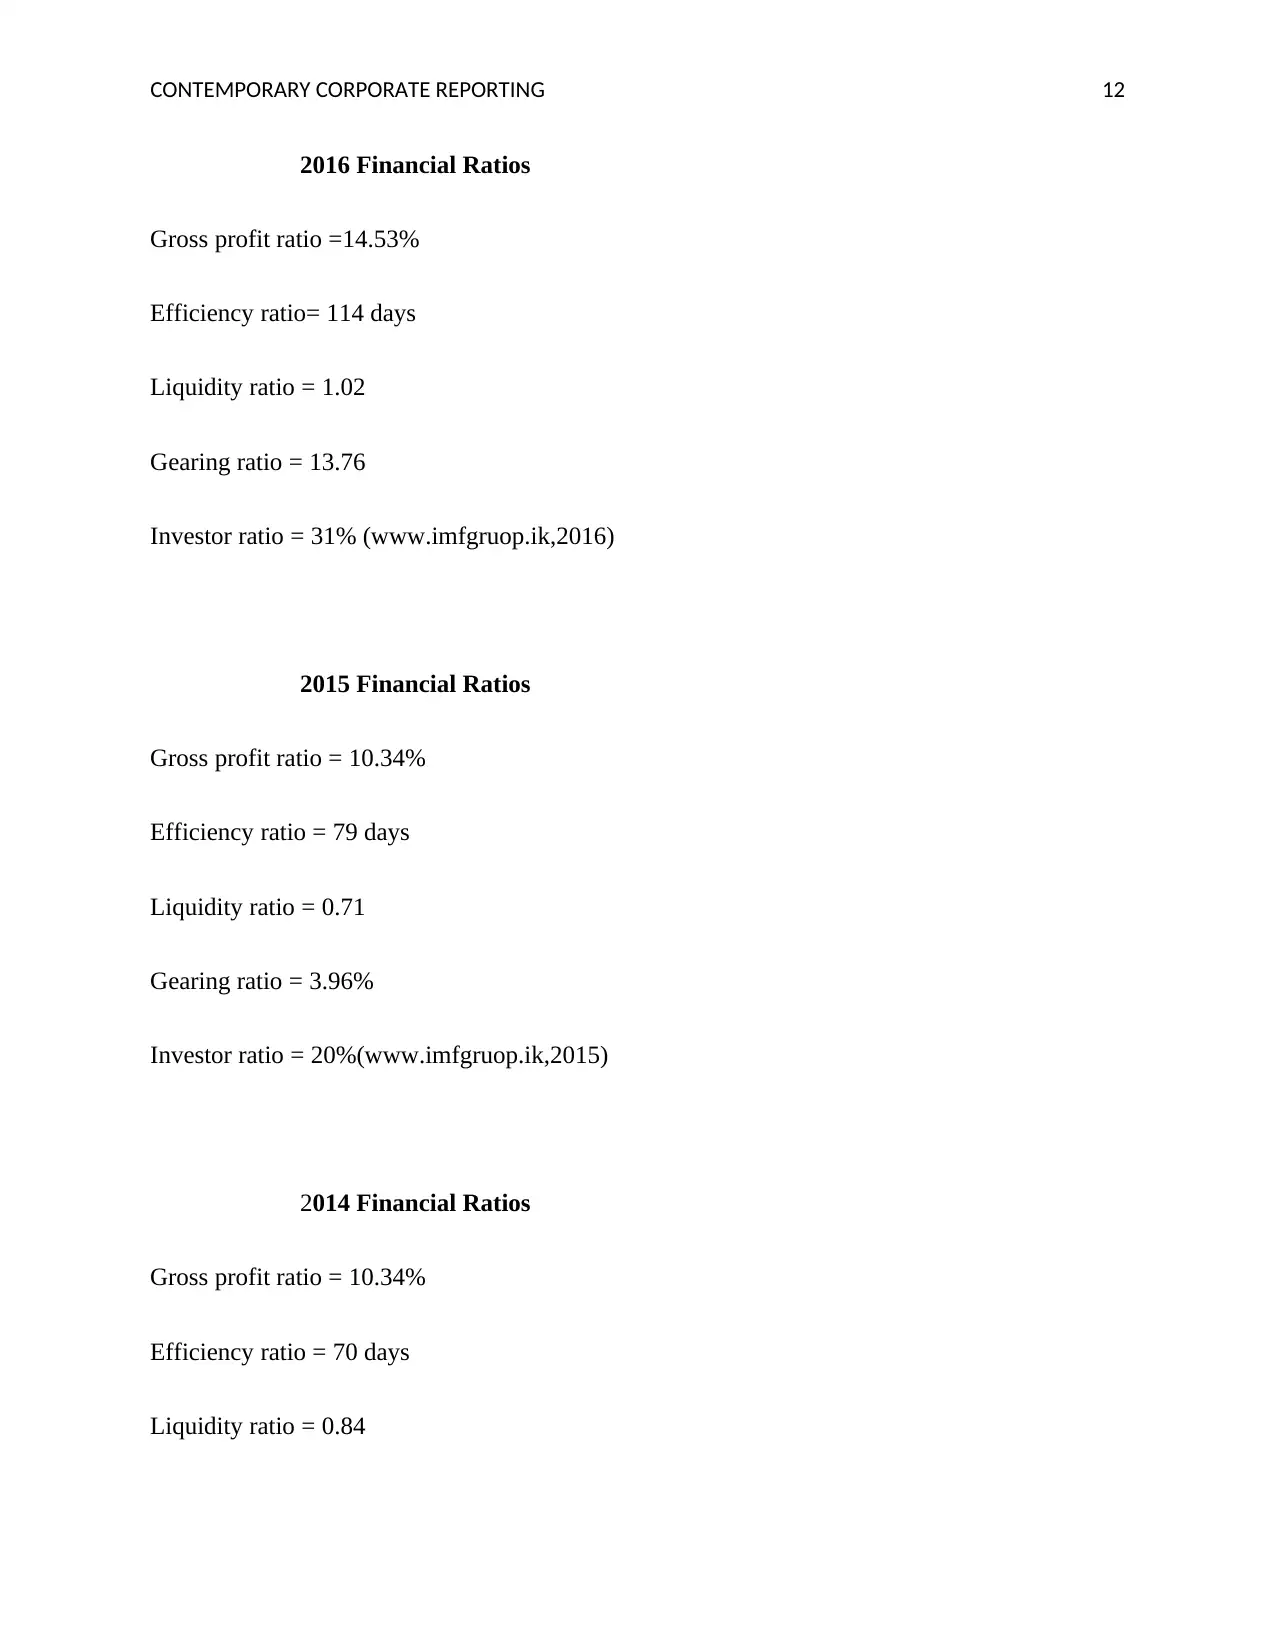
2016 Financial Ratios
Gross profit ratio =14.53%
Efficiency ratio= 114 days
Liquidity ratio = 1.02
Gearing ratio = 13.76
Investor ratio = 31% (www.imfgruop.ik,2016)
2015 Financial Ratios
Gross profit ratio = 10.34%
Efficiency ratio = 79 days
Liquidity ratio = 0.71
Gearing ratio = 3.96%
Investor ratio = 20%(www.imfgruop.ik,2015)
2014 Financial Ratios
Gross profit ratio = 10.34%
Efficiency ratio = 70 days
Liquidity ratio = 0.84
⊘ This is a preview!⊘
Do you want full access?
Subscribe today to unlock all pages.
Trusted by 1+ million students worldwide
1 out of 21
Related Documents


Your All-in-One AI-Powered Toolkit for Academic Success.
+13062052269
info@desklib.com
Available 24*7 on WhatsApp / Email
![[object Object]](/_next/static/media/star-bottom.7253800d.svg)
Unlock your academic potential
Copyright © 2020–2026 A2Z Services. All Rights Reserved. Developed and managed by ZUCOL.