Explaining the Law of Demand and Supply in the Petroleum Industry
Added on 2023-01-07
21 Pages4790 Words20 Views
INTRODUCTION
TASK 1
BM533 COURSEWORK: Contemporary Economic Analysis
MODULE TUTOR AT GBS:
TABLE OF CONTENTS
TASK 1
BM533 COURSEWORK: Contemporary Economic Analysis
MODULE TUTOR AT GBS:
TABLE OF CONTENTS

1.1 EXPLAIN THE LAW OF DEMAND, MOVEMENT ALONG THE SAME DEMAND
CURVE
1.2 EXPLAIN THE LAW OF SUPPLY, MOVEMENT ALONG THE SAME SUPPLY
CURVE
TASK 2
COMPARE AND CONTRAST EMERGING THEORIES AND MODELS 21ST
CENTURY CONTEMPORARY ECONOMIC WITH THOSE OF THE 20TH
CENTURY AND RELATE BOTH OF THESE TO MODERN BUSINESS
PRACTICE
CONCLUSION
REFERENCES
Page 1 of 21
CURVE
1.2 EXPLAIN THE LAW OF SUPPLY, MOVEMENT ALONG THE SAME SUPPLY
CURVE
TASK 2
COMPARE AND CONTRAST EMERGING THEORIES AND MODELS 21ST
CENTURY CONTEMPORARY ECONOMIC WITH THOSE OF THE 20TH
CENTURY AND RELATE BOTH OF THESE TO MODERN BUSINESS
PRACTICE
CONCLUSION
REFERENCES
Page 1 of 21
INTRODUCTION
Economics is a concept which deals with production, distribution and consumption
functions of goods and services. This concept can be broken into two broad categories;
macroeconomics and microeconomics. It studies the behavior of aggregate economy
(Spencer, 1990).
Contemporary business analysis is related to modernization of business techniques in
present world. It involves adoption of latest techniques to increase the productivity of the
firm (Spencer, 1990).
This assessment is about explaining the law of demand and supply within the context of
petroleum industry. Task 2, reflects the comparison between 20th and 21st centuries
emerging theories and models. Additional to this contemporary economics concept has
also been discussed with those of the 20th century.
In this assessment Petroleum business has been taken as reference to understand the
various concept of demand and supply law.
Page 2 of 21
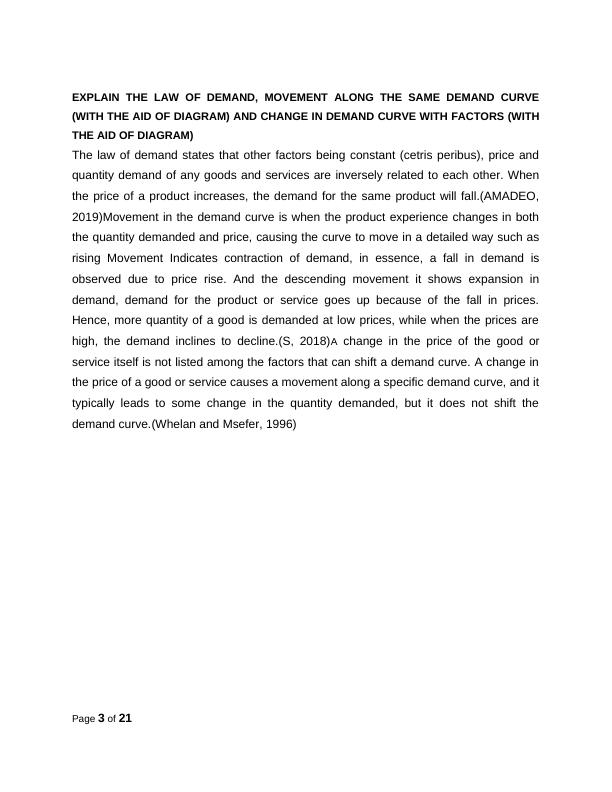
EXPLAIN THE LAW OF DEMAND, MOVEMENT ALONG THE SAME DEMAND CURVE
(WITH THE AID OF DIAGRAM) AND CHANGE IN DEMAND CURVE WITH FACTORS (WITH
THE AID OF DIAGRAM)
The law of demand states that other factors being constant (cetris peribus), price and
quantity demand of any goods and services are inversely related to each other. When
the price of a product increases, the demand for the same product will fall.(AMADEO,
2019)Movement in the demand curve is when the product experience changes in both
the quantity demanded and price, causing the curve to move in a detailed way such as
rising Movement Indicates contraction of demand, in essence, a fall in demand is
observed due to price rise. And the descending movement it shows expansion in
demand, demand for the product or service goes up because of the fall in prices.
Hence, more quantity of a good is demanded at low prices, while when the prices are
high, the demand inclines to decline.(S, 2018)A change in the price of the good or
service itself is not listed among the factors that can shift a demand curve. A change in
the price of a good or service causes a movement along a specific demand curve, and it
typically leads to some change in the quantity demanded, but it does not shift the
demand curve.(Whelan and Msefer, 1996)
Page 3 of 21
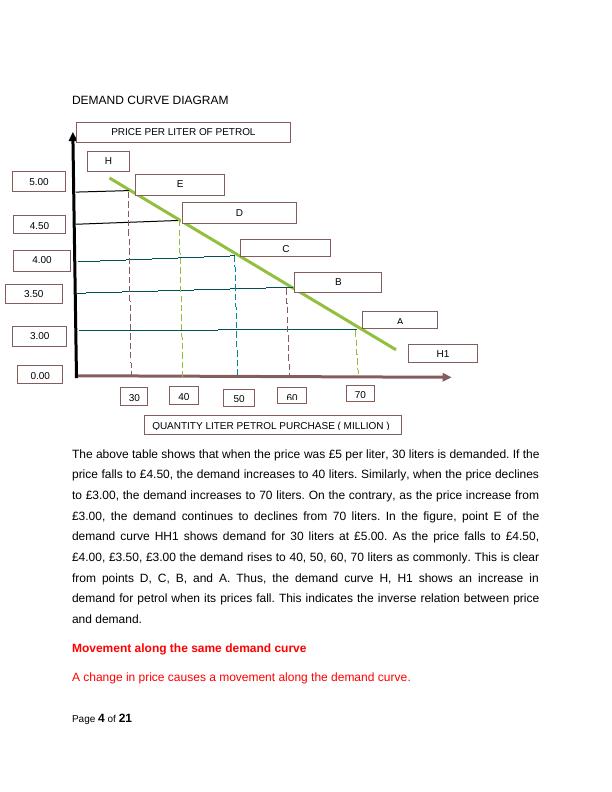
DEMAND CURVE DIAGRAM
The above table shows that when the price was £5 per liter, 30 liters is demanded. If the
price falls to £4.50, the demand increases to 40 liters. Similarly, when the price declines
to £3.00, the demand increases to 70 liters. On the contrary, as the price increase from
£3.00, the demand continues to declines from 70 liters. In the figure, point E of the
demand curve HH1 shows demand for 30 liters at £5.00. As the price falls to £4.50,
£4.00, £3.50, £3.00 the demand rises to 40, 50, 60, 70 liters as commonly. This is clear
from points D, C, B, and A. Thus, the demand curve H, H1 shows an increase in
demand for petrol when its prices fall. This indicates the inverse relation between price
and demand.
Movement along the same demand curve
A change in price causes a movement along the demand curve.
Page 4 of 21
5.00
4.50
4.00
3.50
3.00
PRICE PER LITER OF PETROL
0.00
QUANTITY LITER PETROL PURCHASE ( MILLION )
A
B
C
D
E
7060504030
H
H1
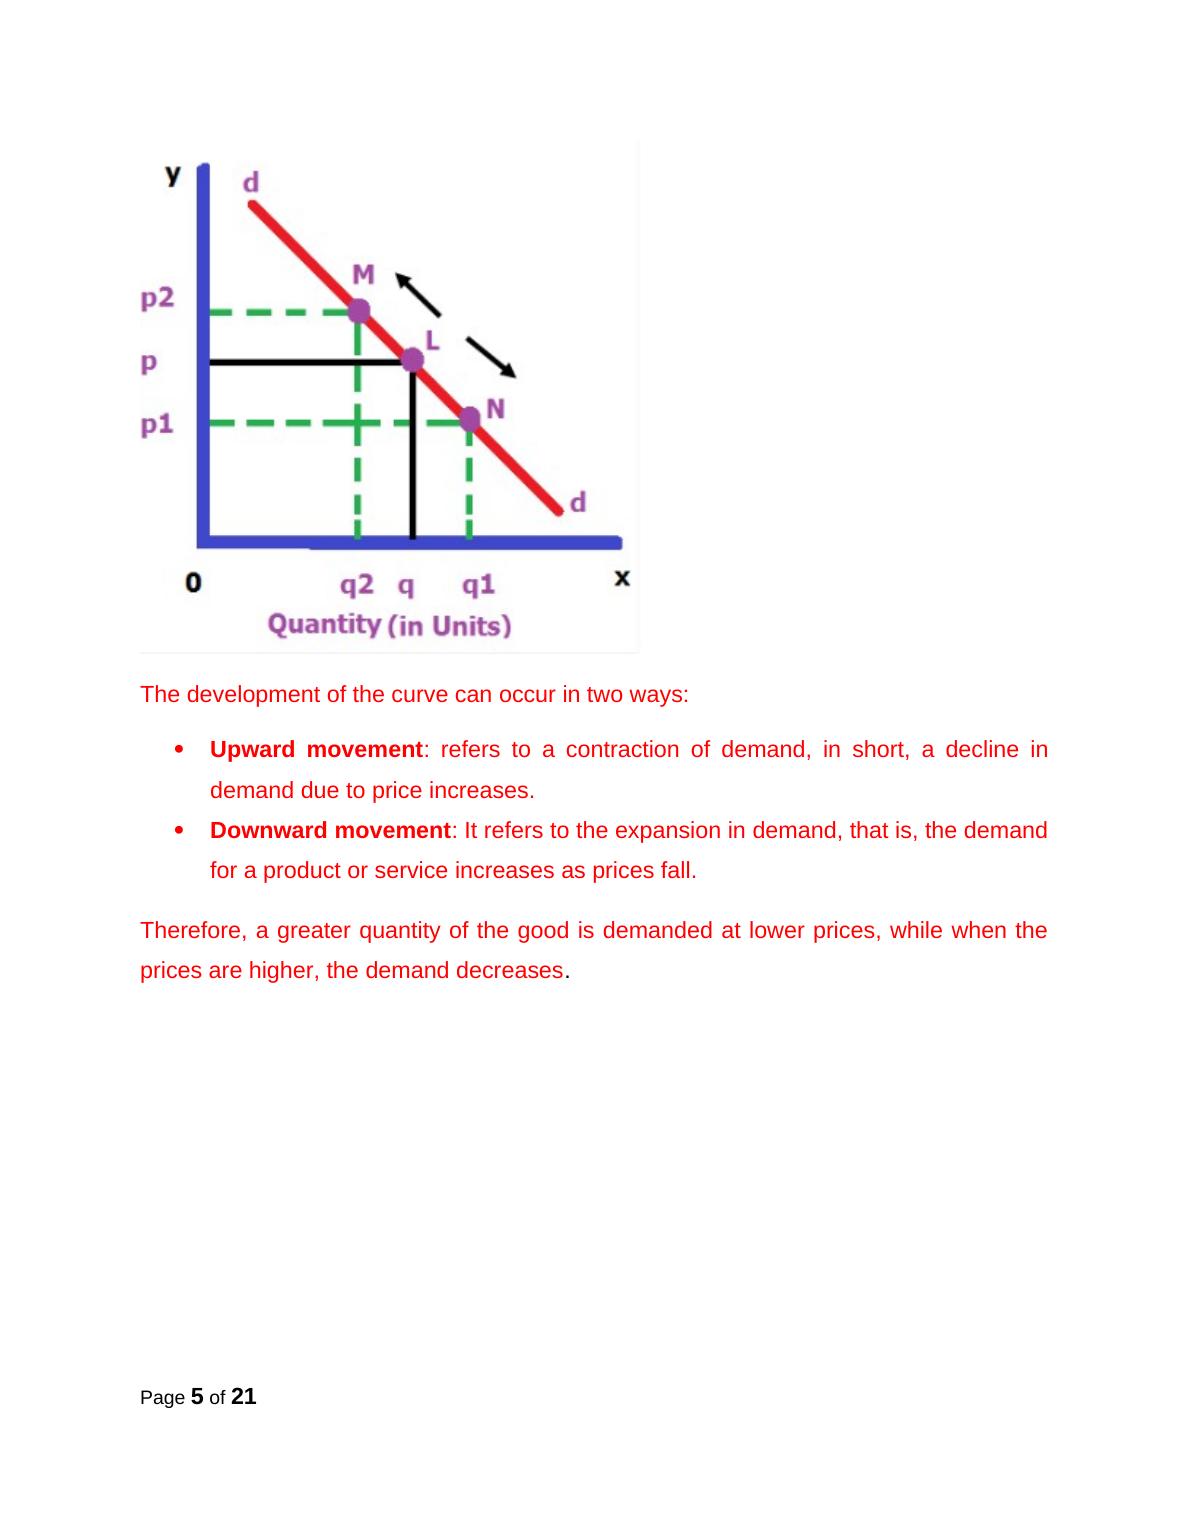
The development of the curve can occur in two ways:
Upward movement: refers to a contraction of demand, in short, a decline in
demand due to price increases.
Downward movement: It refers to the expansion in demand, that is, the demand
for a product or service increases as prices fall.
Therefore, a greater quantity of the good is demanded at lower prices, while when the
prices are higher, the demand decreases.
Page 5 of 21
End of preview
Want to access all the pages? Upload your documents or become a member.
Related Documents
Supply and Demandlg...
|15
|2878
|46
Contemporary Business Economics: Law of Demand, Law of Supply, 20th Century Economic Theories, 21st Century Economic Theorieslg...
|19
|4031
|70
Law of Demand and Supply: Explained with Diagramslg...
|16
|2893
|79
Contemporary Economic Analysislg...
|15
|3065
|64
Contemporary Economic Analysis: Law of Demand and Supply, Theories and Modelslg...
|11
|2909
|331
Contemporary Business Economicslg...
|12
|3244
|70