Pensonic vs. Panasonic Financial Analysis
VerifiedAdded on 2019/09/16
|10
|1495
|228
Report
AI Summary
This report provides a comprehensive financial analysis of Pensonic and Panasonic, two companies operating in the Malaysian market. The analysis covers several key areas, including average returns and standard deviation of stock prices, liquidity ratios (current ratio, quick ratio, cash ratio), leverage ratios (debt ratio, debt-to-equity ratio, interest coverage ratio), and profitability ratios (gross profit ratio, net profit ratio, operating profit ratio). The report also examines market preference based on market share data. The findings reveal that Panasonic demonstrates superior financial health compared to Pensonic across all analyzed metrics. Panasonic exhibits significantly higher liquidity, negligible debt, and substantially greater profitability. While Pensonic shows higher operating profit, its heavy reliance on debt and lower net profit significantly detract from its overall financial strength. The report concludes that Panasonic enjoys a stronger market preference, indicated by its considerably larger market share. The analysis is supported by data extracted from the annual reports of both companies and historical stock price data from Yahoo Finance.
Contents
Average Returns and Standard Deviation:.............................................................................................2
Financial Health analysis........................................................................................................................3
Liquidity:............................................................................................................................................3
Leverage:...........................................................................................................................................4
Profitability:.......................................................................................................................................5
Market Preference:...........................................................................................................................6
Appendix 1: Key financial inputs............................................................................................................7
Pensonic............................................................................................................................................7
Panasonic:.........................................................................................................................................8
References:............................................................................................................................................9
1
Paraphrase This Document
Need a fresh take? Get an instant paraphrase of this document with our AI Paraphraser
Average Returns and Standard Deviation:
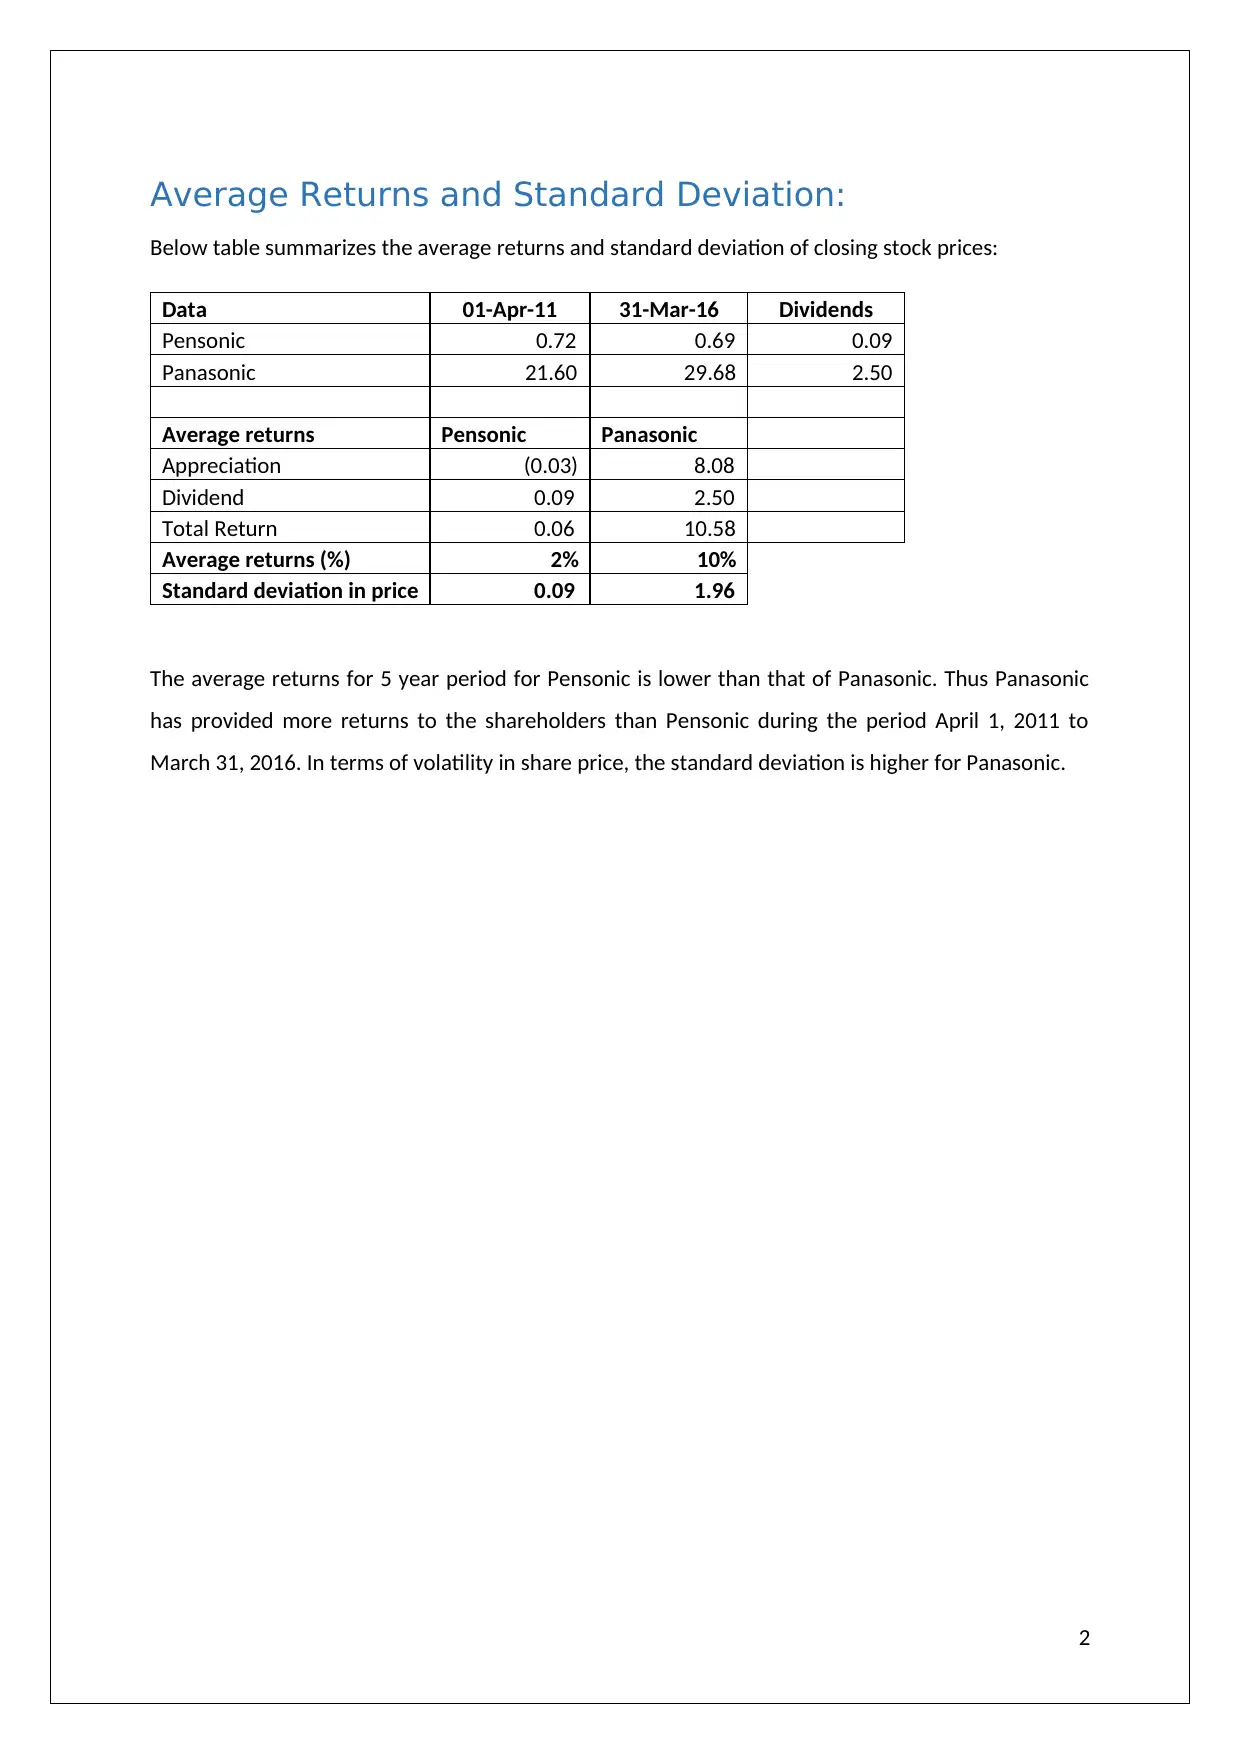
Below table summarizes the average returns and standard deviation of closing stock prices:
Data 01-Apr-11 31-Mar-16 Dividends
Pensonic 0.72 0.69 0.09
Panasonic 21.60 29.68 2.50
Average returns Pensonic Panasonic
Appreciation (0.03) 8.08
Dividend 0.09 2.50
Total Return 0.06 10.58
Average returns (%) 2% 10%
Standard deviation in price 0.09 1.96
The average returns for 5 year period for Pensonic is lower than that of Panasonic. Thus Panasonic
has provided more returns to the shareholders than Pensonic during the period April 1, 2011 to
March 31, 2016. In terms of volatility in share price, the standard deviation is higher for Panasonic.
2
Financial Health analysis
Liquidity:
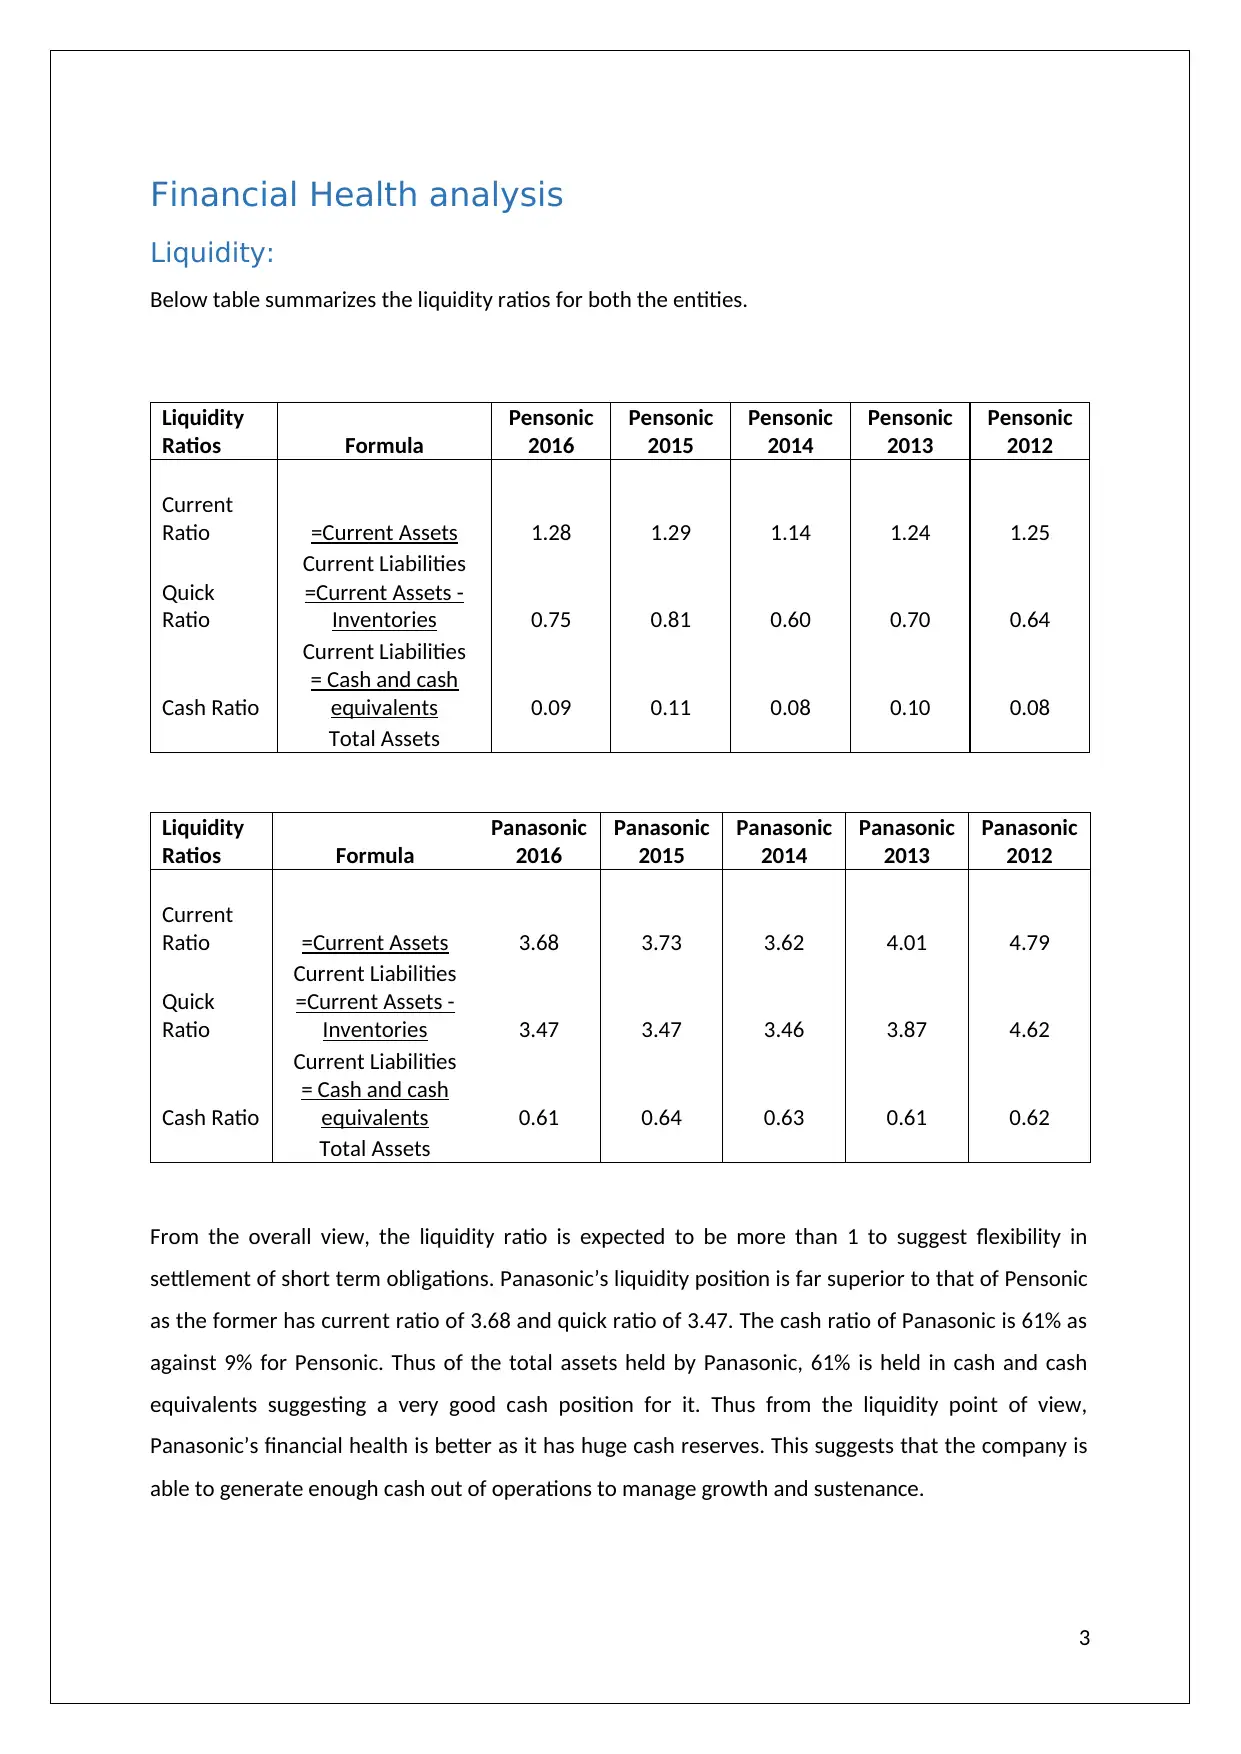
Below table summarizes the liquidity ratios for both the entities.
Liquidity
Ratios Formula
Pensonic
2016
Pensonic
2015
Pensonic
2014
Pensonic
2013
Pensonic
2012
Current
Ratio =Current Assets 1.28 1.29 1.14 1.24 1.25
Current Liabilities
Quick
Ratio
=Current Assets -
Inventories 0.75 0.81 0.60 0.70 0.64
Current Liabilities
Cash Ratio
= Cash and cash
equivalents 0.09 0.11 0.08 0.10 0.08
Total Assets
Liquidity
Ratios Formula
Panasonic
2016
Panasonic
2015
Panasonic
2014
Panasonic
2013
Panasonic
2012
Current
Ratio =Current Assets 3.68 3.73 3.62 4.01 4.79
Current Liabilities
Quick
Ratio
=Current Assets -
Inventories 3.47 3.47 3.46 3.87 4.62
Current Liabilities
Cash Ratio
= Cash and cash
equivalents 0.61 0.64 0.63 0.61 0.62
Total Assets
From the overall view, the liquidity ratio is expected to be more than 1 to suggest flexibility in
settlement of short term obligations. Panasonic’s liquidity position is far superior to that of Pensonic
as the former has current ratio of 3.68 and quick ratio of 3.47. The cash ratio of Panasonic is 61% as
against 9% for Pensonic. Thus of the total assets held by Panasonic, 61% is held in cash and cash
equivalents suggesting a very good cash position for it. Thus from the liquidity point of view,
Panasonic’s financial health is better as it has huge cash reserves. This suggests that the company is
able to generate enough cash out of operations to manage growth and sustenance.
3
Liquidity:
Below table summarizes the liquidity ratios for both the entities.
Liquidity
Ratios Formula
Pensonic
2016
Pensonic
2015
Pensonic
2014
Pensonic
2013
Pensonic
2012
Current
Ratio =Current Assets 1.28 1.29 1.14 1.24 1.25
Current Liabilities
Quick
Ratio
=Current Assets -
Inventories 0.75 0.81 0.60 0.70 0.64
Current Liabilities
Cash Ratio
= Cash and cash
equivalents 0.09 0.11 0.08 0.10 0.08
Total Assets
Liquidity
Ratios Formula
Panasonic
2016
Panasonic
2015
Panasonic
2014
Panasonic
2013
Panasonic
2012
Current
Ratio =Current Assets 3.68 3.73 3.62 4.01 4.79
Current Liabilities
Quick
Ratio
=Current Assets -
Inventories 3.47 3.47 3.46 3.87 4.62
Current Liabilities
Cash Ratio
= Cash and cash
equivalents 0.61 0.64 0.63 0.61 0.62
Total Assets
From the overall view, the liquidity ratio is expected to be more than 1 to suggest flexibility in
settlement of short term obligations. Panasonic’s liquidity position is far superior to that of Pensonic
as the former has current ratio of 3.68 and quick ratio of 3.47. The cash ratio of Panasonic is 61% as
against 9% for Pensonic. Thus of the total assets held by Panasonic, 61% is held in cash and cash
equivalents suggesting a very good cash position for it. Thus from the liquidity point of view,
Panasonic’s financial health is better as it has huge cash reserves. This suggests that the company is
able to generate enough cash out of operations to manage growth and sustenance.
3
⊘ This is a preview!⊘
Do you want full access?
Subscribe today to unlock all pages.
Trusted by 1+ million students worldwide

4
Paraphrase This Document
Need a fresh take? Get an instant paraphrase of this document with our AI Paraphraser
Leverage:
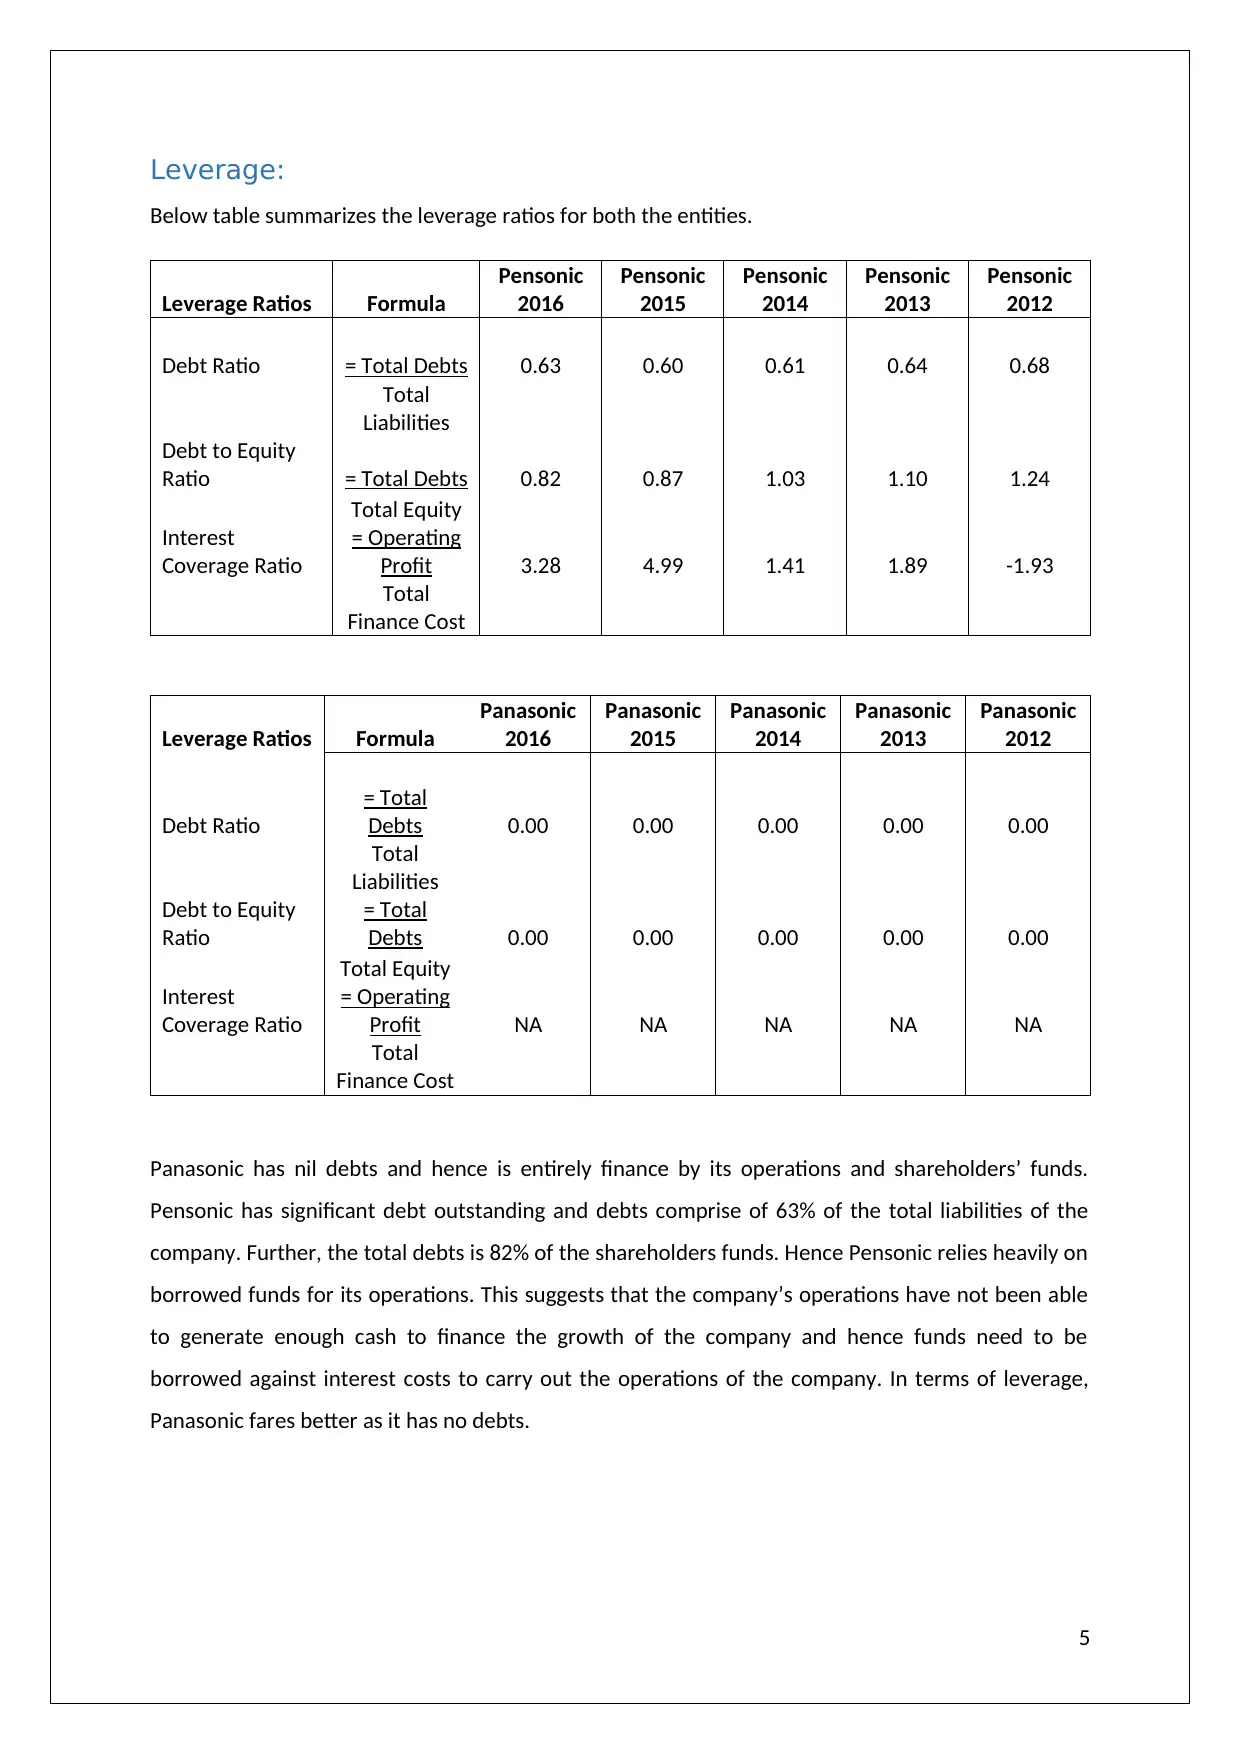
Below table summarizes the leverage ratios for both the entities.
Leverage Ratios Formula
Pensonic
2016
Pensonic
2015
Pensonic
2014
Pensonic
2013
Pensonic
2012
Debt Ratio = Total Debts 0.63 0.60 0.61 0.64 0.68
Total
Liabilities
Debt to Equity
Ratio = Total Debts 0.82 0.87 1.03 1.10 1.24
Total Equity
Interest
Coverage Ratio
= Operating
Profit 3.28 4.99 1.41 1.89 -1.93
Total
Finance Cost
Leverage Ratios Formula
Panasonic
2016
Panasonic
2015
Panasonic
2014
Panasonic
2013
Panasonic
2012
Debt Ratio
= Total
Debts 0.00 0.00 0.00 0.00 0.00
Total
Liabilities
Debt to Equity
Ratio
= Total
Debts 0.00 0.00 0.00 0.00 0.00
Total Equity
Interest
Coverage Ratio
= Operating
Profit NA NA NA NA NA
Total
Finance Cost
Panasonic has nil debts and hence is entirely finance by its operations and shareholders’ funds.
Pensonic has significant debt outstanding and debts comprise of 63% of the total liabilities of the
company. Further, the total debts is 82% of the shareholders funds. Hence Pensonic relies heavily on
borrowed funds for its operations. This suggests that the company’s operations have not been able
to generate enough cash to finance the growth of the company and hence funds need to be
borrowed against interest costs to carry out the operations of the company. In terms of leverage,
Panasonic fares better as it has no debts.
5
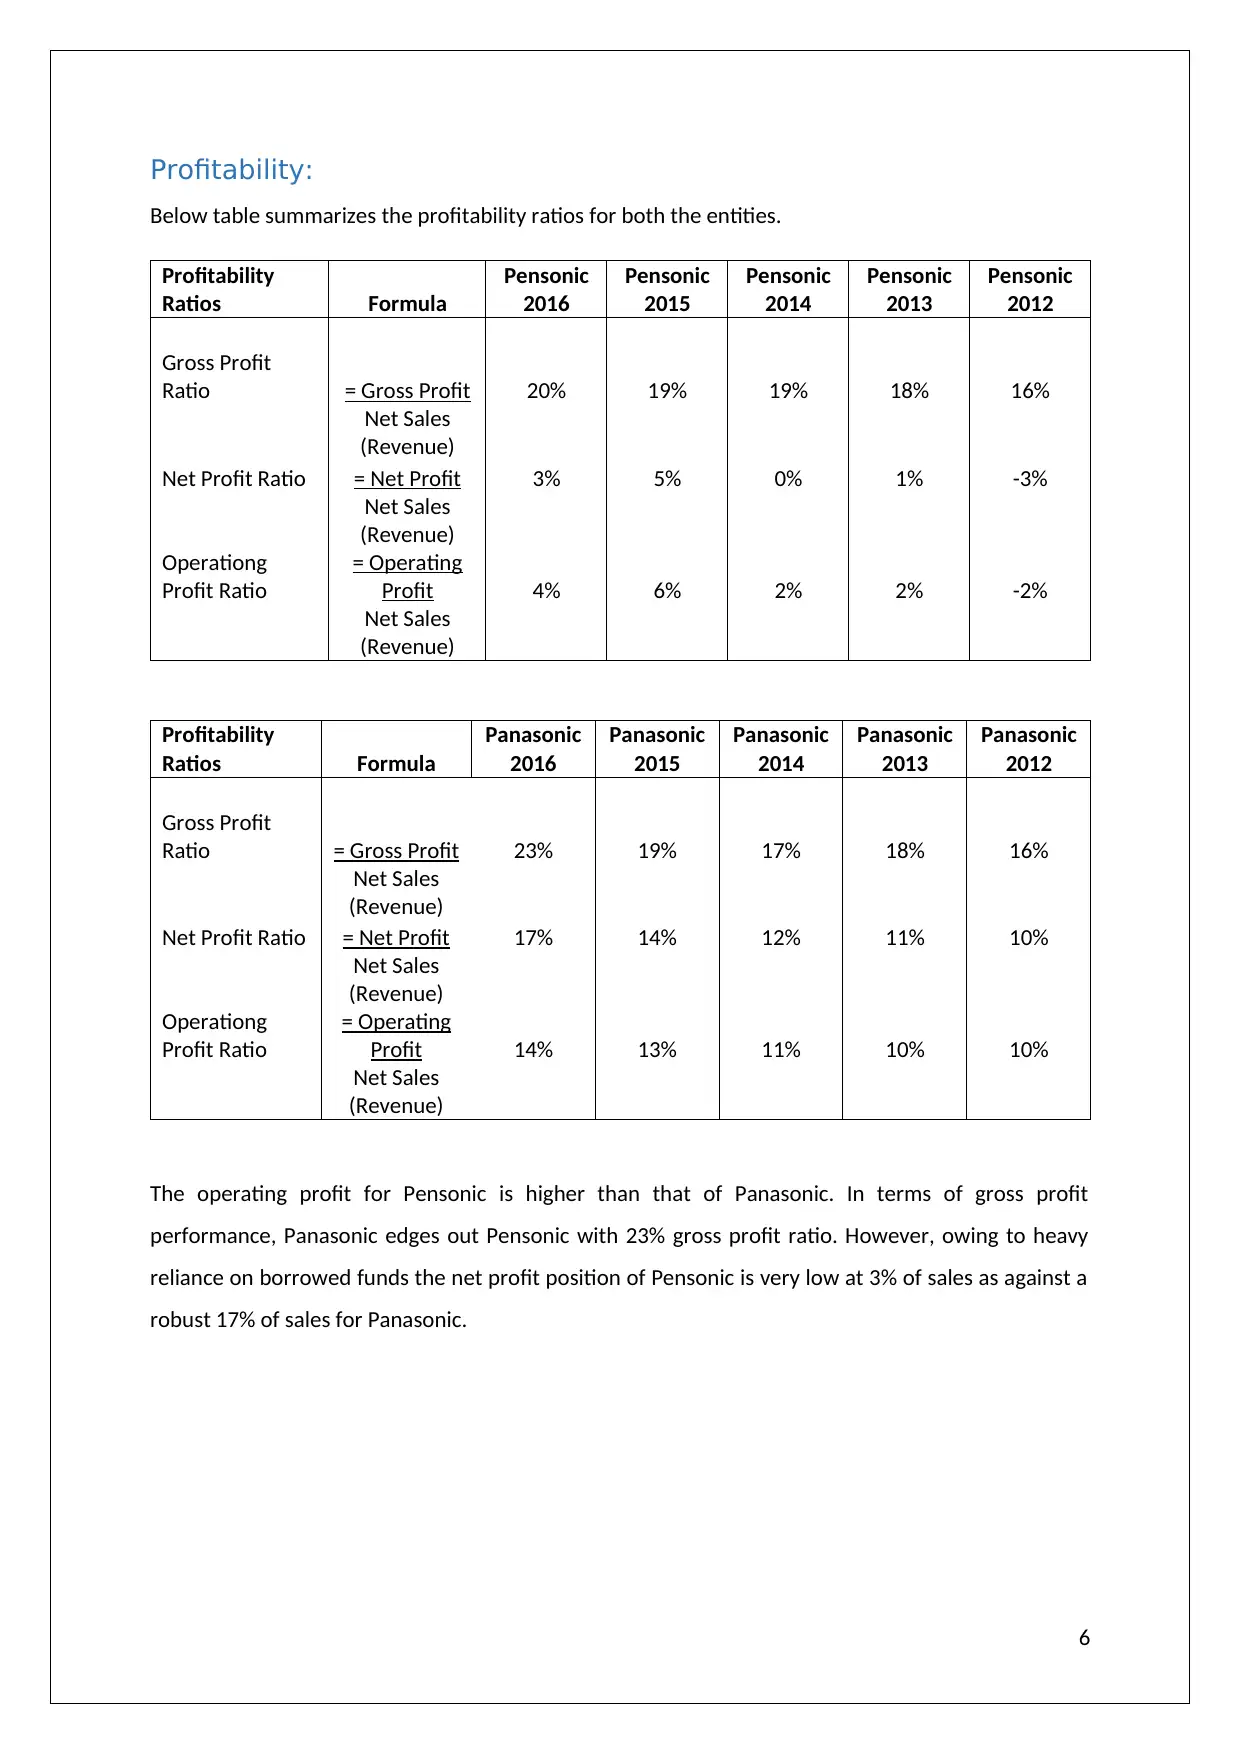
Profitability:
Below table summarizes the profitability ratios for both the entities.
Profitability
Ratios Formula
Pensonic
2016
Pensonic
2015
Pensonic
2014
Pensonic
2013
Pensonic
2012
Gross Profit
Ratio = Gross Profit 20% 19% 19% 18% 16%
Net Sales
(Revenue)
Net Profit Ratio = Net Profit 3% 5% 0% 1% -3%
Net Sales
(Revenue)
Operationg
Profit Ratio
= Operating
Profit 4% 6% 2% 2% -2%
Net Sales
(Revenue)
Profitability
Ratios Formula
Panasonic
2016
Panasonic
2015
Panasonic
2014
Panasonic
2013
Panasonic
2012
Gross Profit
Ratio = Gross Profit 23% 19% 17% 18% 16%
Net Sales
(Revenue)
Net Profit Ratio = Net Profit 17% 14% 12% 11% 10%
Net Sales
(Revenue)
Operationg
Profit Ratio
= Operating
Profit 14% 13% 11% 10% 10%
Net Sales
(Revenue)
The operating profit for Pensonic is higher than that of Panasonic. In terms of gross profit
performance, Panasonic edges out Pensonic with 23% gross profit ratio. However, owing to heavy
reliance on borrowed funds the net profit position of Pensonic is very low at 3% of sales as against a
robust 17% of sales for Panasonic.
6
⊘ This is a preview!⊘
Do you want full access?
Subscribe today to unlock all pages.
Trusted by 1+ million students worldwide
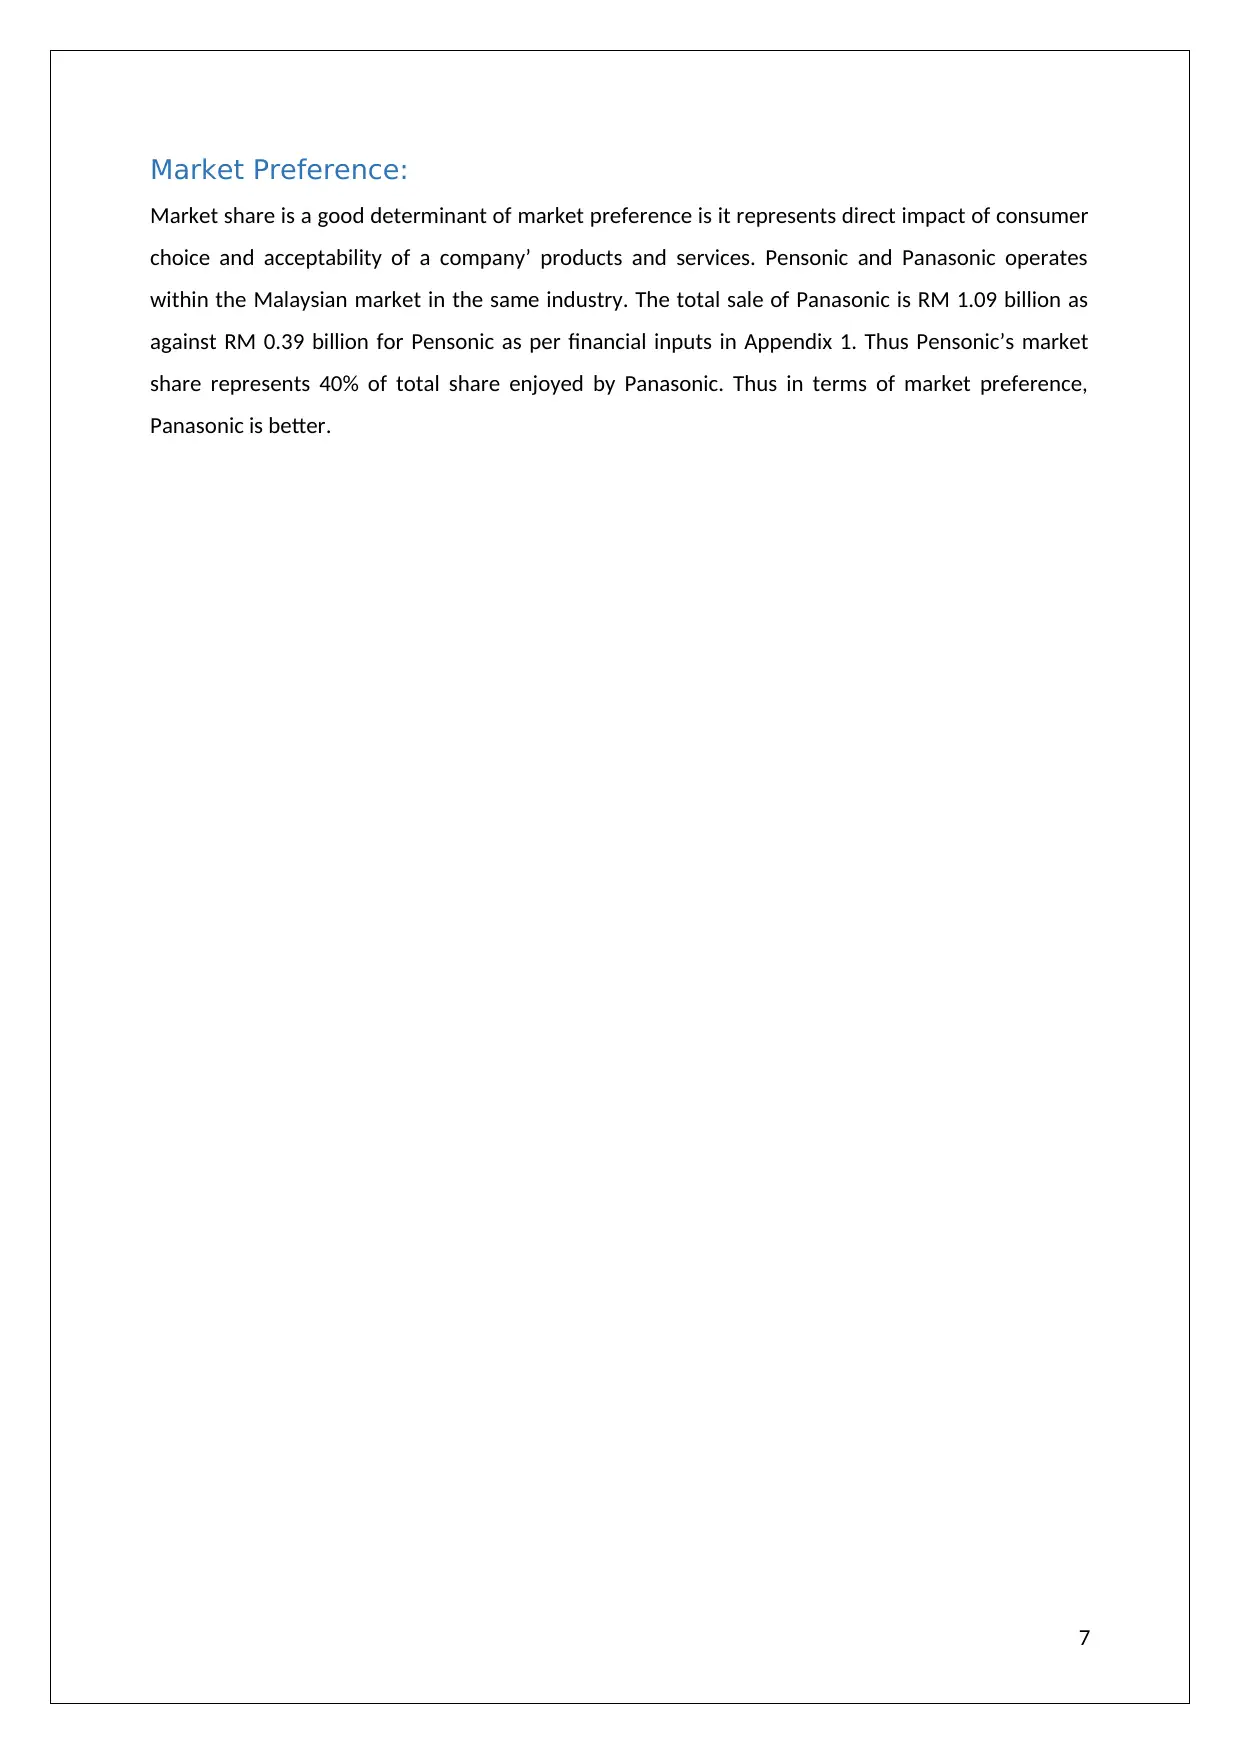
Market Preference:
Market share is a good determinant of market preference is it represents direct impact of consumer
choice and acceptability of a company’ products and services. Pensonic and Panasonic operates
within the Malaysian market in the same industry. The total sale of Panasonic is RM 1.09 billion as
against RM 0.39 billion for Pensonic as per financial inputs in Appendix 1. Thus Pensonic’s market
share represents 40% of total share enjoyed by Panasonic. Thus in terms of market preference,
Panasonic is better.
7
Paraphrase This Document
Need a fresh take? Get an instant paraphrase of this document with our AI Paraphraser
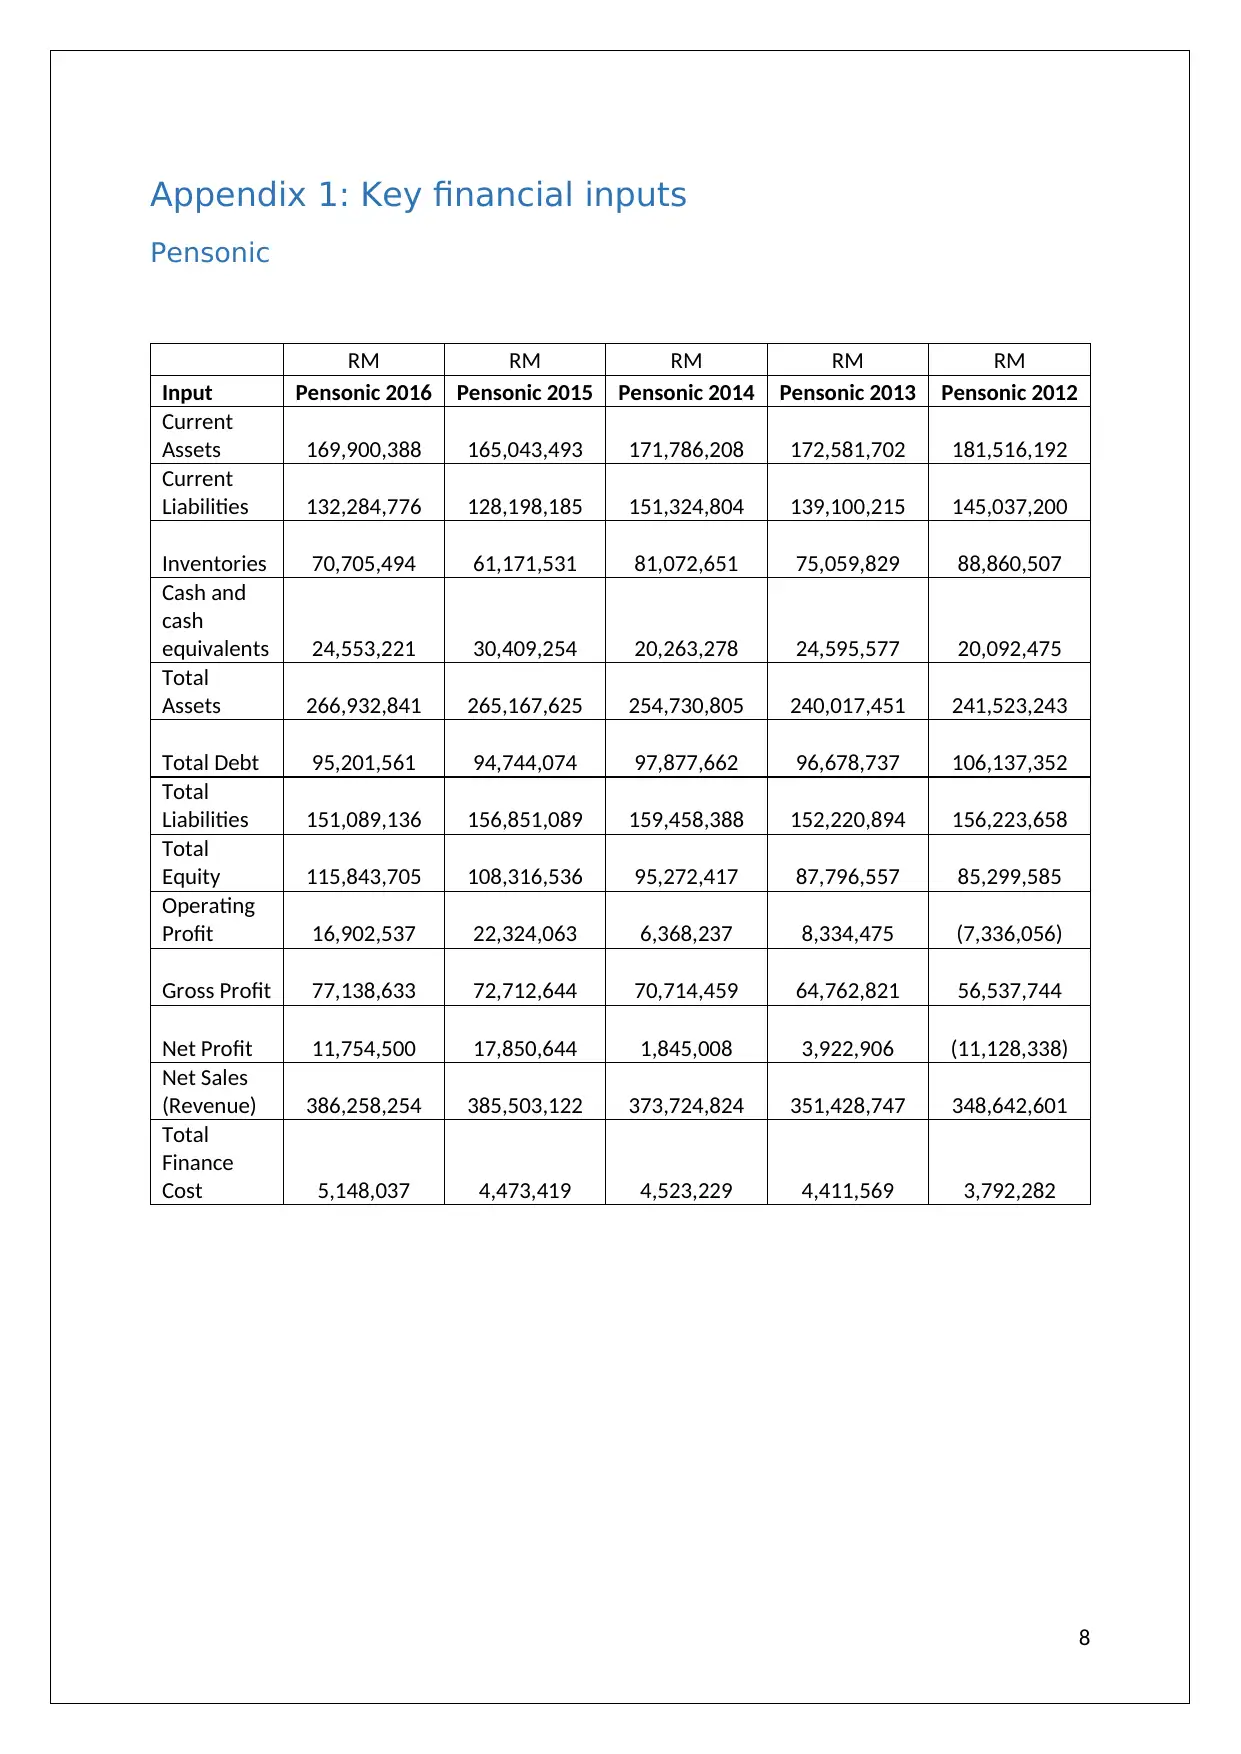
Appendix 1: Key financial inputs
Pensonic
RM RM RM RM RM
Input Pensonic 2016 Pensonic 2015 Pensonic 2014 Pensonic 2013 Pensonic 2012
Current
Assets 169,900,388 165,043,493 171,786,208 172,581,702 181,516,192
Current
Liabilities 132,284,776 128,198,185 151,324,804 139,100,215 145,037,200
Inventories 70,705,494 61,171,531 81,072,651 75,059,829 88,860,507
Cash and
cash
equivalents 24,553,221 30,409,254 20,263,278 24,595,577 20,092,475
Total
Assets 266,932,841 265,167,625 254,730,805 240,017,451 241,523,243
Total Debt 95,201,561 94,744,074 97,877,662 96,678,737 106,137,352
Total
Liabilities 151,089,136 156,851,089 159,458,388 152,220,894 156,223,658
Total
Equity 115,843,705 108,316,536 95,272,417 87,796,557 85,299,585
Operating
Profit 16,902,537 22,324,063 6,368,237 8,334,475 (7,336,056)
Gross Profit 77,138,633 72,712,644 70,714,459 64,762,821 56,537,744
Net Profit 11,754,500 17,850,644 1,845,008 3,922,906 (11,128,338)
Net Sales
(Revenue) 386,258,254 385,503,122 373,724,824 351,428,747 348,642,601
Total
Finance
Cost 5,148,037 4,473,419 4,523,229 4,411,569 3,792,282
8
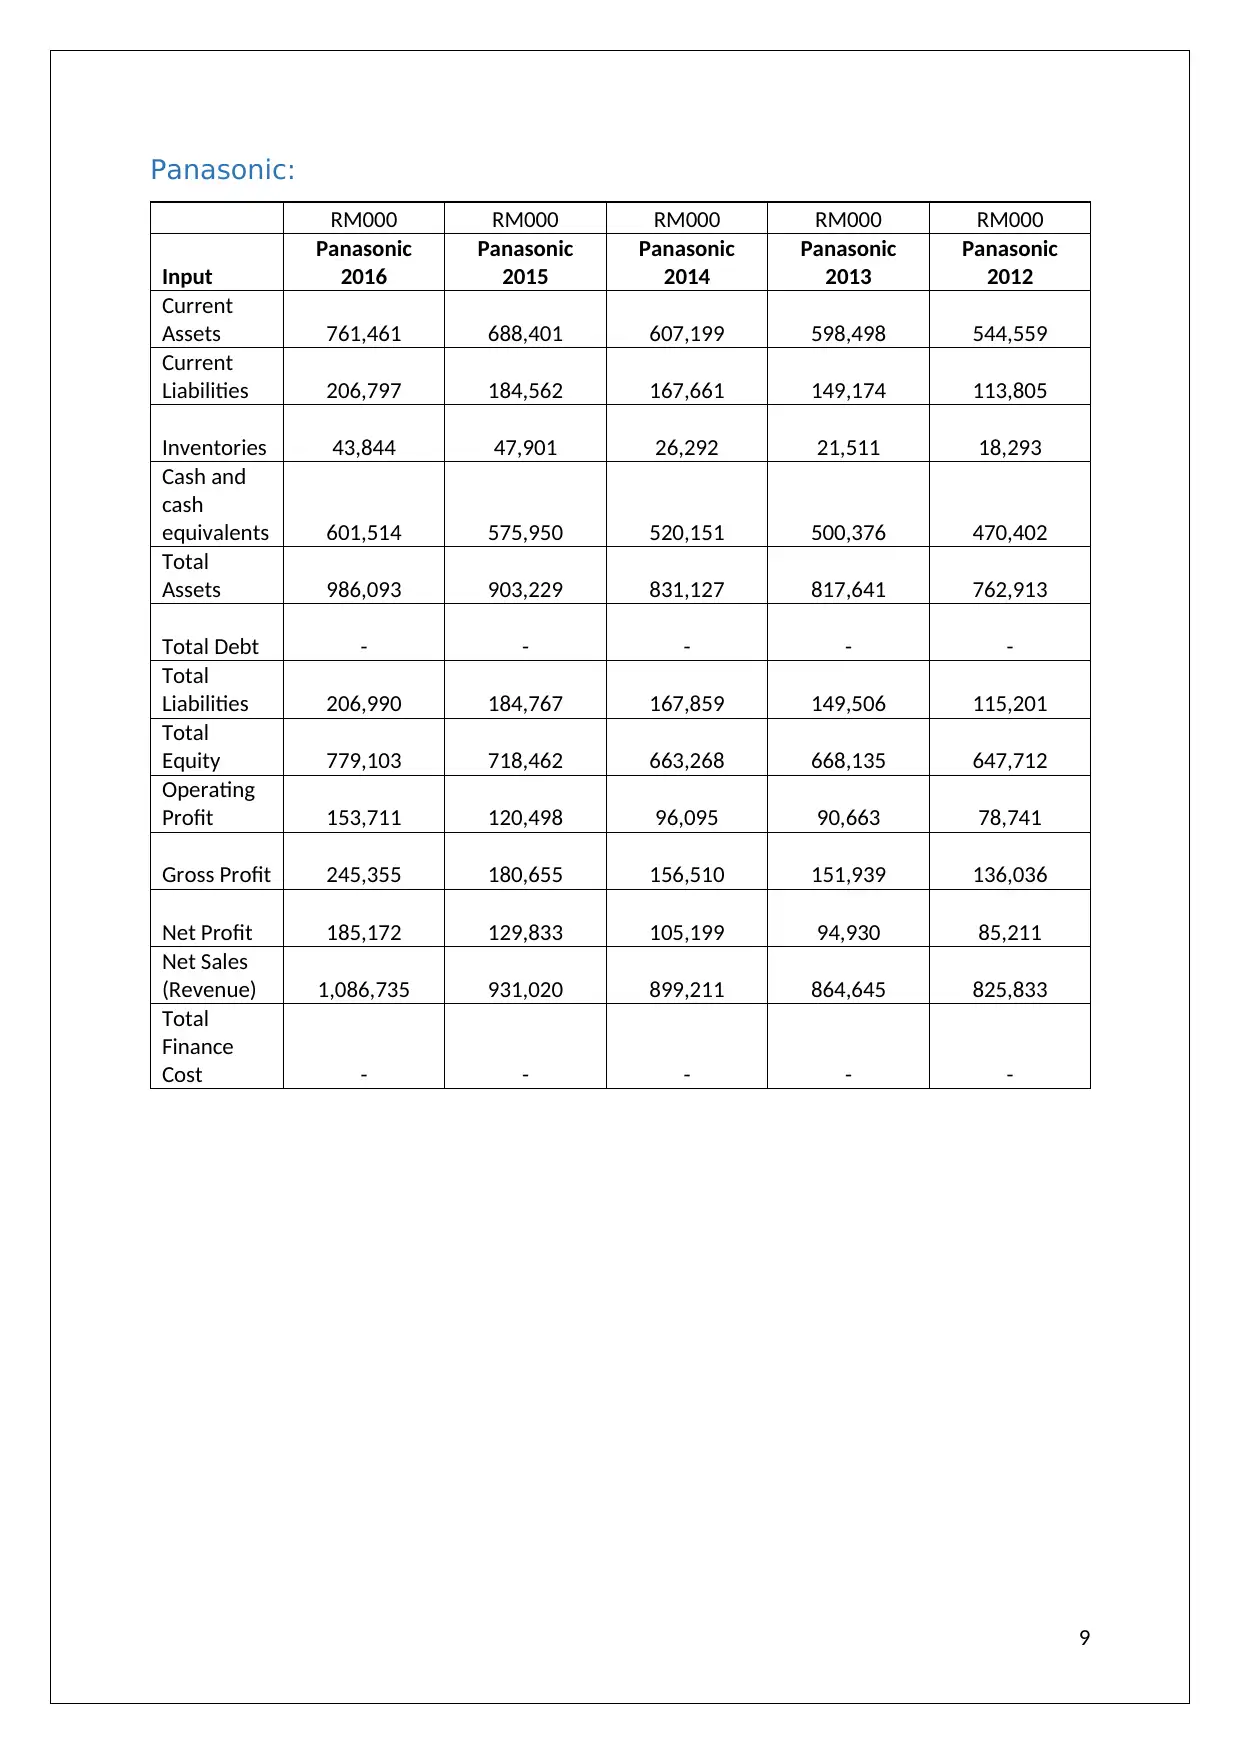
Panasonic:
RM000 RM000 RM000 RM000 RM000
Input
Panasonic
2016
Panasonic
2015
Panasonic
2014
Panasonic
2013
Panasonic
2012
Current
Assets 761,461 688,401 607,199 598,498 544,559
Current
Liabilities 206,797 184,562 167,661 149,174 113,805
Inventories 43,844 47,901 26,292 21,511 18,293
Cash and
cash
equivalents 601,514 575,950 520,151 500,376 470,402
Total
Assets 986,093 903,229 831,127 817,641 762,913
Total Debt - - - - -
Total
Liabilities 206,990 184,767 167,859 149,506 115,201
Total
Equity 779,103 718,462 663,268 668,135 647,712
Operating
Profit 153,711 120,498 96,095 90,663 78,741
Gross Profit 245,355 180,655 156,510 151,939 136,036
Net Profit 185,172 129,833 105,199 94,930 85,211
Net Sales
(Revenue) 1,086,735 931,020 899,211 864,645 825,833
Total
Finance
Cost - - - - -
9
⊘ This is a preview!⊘
Do you want full access?
Subscribe today to unlock all pages.
Trusted by 1+ million students worldwide
References:
Pensonic.com, 2016, “The Annual Report 2016”, Retrieved from:
http://pensonic.com/index.php/finance/, Accessed date: November 7, 2016
Pensonic.com, 2015, “The Annual Report 2015”, Retrieved from:
http://pensonic.com/index.php/finance/, Accessed date: November 7, 2016
Pensonic.com, 2014, “The Annual Report 2014”, Retrieved from:
http://pensonic.com/index.php/finance/, Accessed date: November 7, 2016
Pensonic.com, 2013, “The Annual Report 2013”, Retrieved from:
http://pensonic.com/index.php/finance/, Accessed date: November 7, 2016
Pensonic.com, 2012, “The Annual Report 2012”, Retrieved from:
http://pensonic.com/index.php/finance/, Accessed date: November 7, 2016
Panasonic.com, 2016, “The Annual Report 2016”, Retrieved from:
http://pmma.panasonic.com.my/investor-relations/bursa-malaysia-requirements/, Accessed date:
November 7, 2016
Panasonic.com, 2015, “The Annual Report 2015”, Retrieved from:
http://pmma.panasonic.com.my/investor-relations/bursa-malaysia-requirements/, Accessed date:
November 7, 2016
Panasonic.com, 2014, “The Annual Report 2014”, Retrieved from:
http://pmma.panasonic.com.my/investor-relations/bursa-malaysia-requirements/, Accessed date:
November 7, 2016
Panasonic.com, 2013, “The Annual Report 2013”, Retrieved from:
http://pmma.panasonic.com.my/investor-relations/bursa-malaysia-requirements/, Accessed date:
November 7, 2016
Panasonic.com, 2012, “The Annual Report 2012”, Retrieved from:
http://pmma.panasonic.com.my/investor-relations/bursa-malaysia-requirements/, Accessed date:
November 7, 2016
Yahoofinance, n.d., “Historical data”, Retrieved from:
http://finance.yahoo.com/quote/3719.KL/history?
period1=1301596200&period2=1459362600&interval=div%7Csplit&filter=div&frequency=1wk,
Accessed date: November 7, 2016
10
1 out of 10