Food Bloggers' Influence on Students' Traveling Food Choices
VerifiedAdded on 2020/10/16
|53
|10324
|466
AI Summary
The research examines the effects of social media influencers on students' food selections during travel. A survey was conducted among 153 respondents from Da Nang University of Economics to identify key factors influencing their decisions. The findings reveal that cyber community influence on Instagram, presenting guide, inspiring taste desire, and delivering knowledge are significant factors affecting students' food choices when traveling. Linear regression analysis shows that cyber community influence on Instagram and presenting guide have the most impact on students' food selections when traveling. Additionally, the study finds a difference in students' food selections based on gender, with women being more influenced than men. However, there is no significant difference in students' food selections when traveling by school year.
Contribute Materials
Your contribution can guide someone’s learning journey. Share your
documents today.
CONTENTS
PART 1. INTRODUCTION.. 3
1.1 THE URGENCY OF THIS STUDY (TÍNH CẤP THIẾT) 3
1.1.1 People have a tendency to search information on social networking sites
before travelling 3
1.1.2 People cannot get worth information while there are too many bloggers
nowadays, including food bloggers 4
1.2 RESEARCH PROBLEM DEFINING.. 5
1.2.1 Marketing problem defining. 5
1.2.2 Study problem defining. 5
1.3 OBJECTIVE OF THE RESEARCH.. 6
1.4 RESEARCH QUESTION.. 6
1.5 OBJECT AND SCOPE OF THE RESEARCH.. 6
1.5.1 Research object 6
1.5.2 Research scope. 6
PART 2. LITERATURE REVIEW... 6
2.1 WHO ARE FOOD BLOGGERS?. 7
2.2 FOOD BLOGGERS ON INSTAGRAM... 8
2.3 PREVIOUS RESEARCH.. 9
PART 3. MODEL AND HYPOTHESES. 11
3.1 HYPOTHESIS. 11
3.1.1 Inspiring taste desire. 12
Secure Best Marks with AI Grader
Need help grading? Try our AI Grader for instant feedback on your assignments.
3.1.2 Forming taste awareness. 13
3.1.3 Personal characteristics. 14
3.2 PROPOSED RESEARCH MODEL.. 16
PART 4. METHODOLOGY.. 17
4.1 RESEARCH PROCESS. 17
4.1.1 Research process. 17
4.1.2 Timeline. 18
4.2 DATA COLLECTION.. 18
4.2.1 Research approach. 18
4.2.2 Data collection method. 19
4.2.3 How to collect data. 19
4.2.4 Questionnaire (enclosed file) 20
4.3 Sampling method. 20
4.4 Research budget 21
PART 1. INTRODUCTION
This part introduces the subject of the study. This part also builds up the
statement of the problem and research questions. It will explain why it is
necessary to research this topic and what research questions of this study will
answer. This chapter of the research includes three main sections: a section on
the statement of the problem which will give information about the specific
problem, background and need related to the problem, the focus of the study,
research questions and what questions the research proposes to answer, and
other important sections.
1.1 THE URGENCY OF THIS STUDY (TÍNH CẤP THIẾT)
1.1.1 People have a tendency to search information on social
networking sites before travelling
Today, tourism has become an indispensable demand in social life and
developed rapidly all around the world. Young people, especially students, who
has the biggest proportion of leading the trend, always update and access
everything quickly from eating, playing, and even travelling. It can be observed
that the various channels of information can be noticed, more and more young
people like travelling, and that young people create new trends in tourism
makes tourism products increasingly diverse.
According to statistics from WeareSocial and Hootsuite in 2019, 94 per cent of
users in Vietnam surf the Internet daily (We Are Social & Hootsuite, 2020).
Besides, Statcounter reported that the number of people over the world using
Instagram was about 8.54% in March 2020, with increasing over 6% in last 7
months and this data for Vietnam was 1.85%. We can see that social media -
especially Instagram are gradually becoming popular with Internet users. As an
imagery-based application, Instagram has enabled millions of users to share
photos from their own adventures. Posts can be shared widely or with pre-
approved followers.
A majority of visitors have very little knowledge of the destination on their first
trip, therefore that many people tend to check reviews and information, compare
prices on social platforms is extremely essential. For those who love travelling
and cuisine, they certainly will be familiar with the existence of food bloggers.
New research from Booking.com has found that 64 per cent of travellers are
choosing their next travel destination based on its food and drink options. Food
bloggers as social media marketing especially in Instagram, used to provide
reviews about culinary products. The existence of food bloggers is believed to
help students to choose eating places that be appropriate to the needs of ones.
There has been research on how social media, user-generated content and
electronic word-of-mouth affect consumers behaviour and travel planning, but a
few of them study the relation between Instagram and consumers behaviour
before their travels. On the other hand, there are many articles and blog posts on
Instagram for travel planning, but do people actually use them for the given
purpose and do they have an influence on their choices?
1.1.2 People cannot get worth information while there are too
many bloggers nowadays, including food bloggers
Food has always been a social thing that brings people together, but with the
advent of the internet and, more specifically, online food influencers, the ways
in which we experience food and all its possibilities have changed. Nowadays,
social media are inseparable from the life of the broad majority of young
generation. Sites like Facebook, Twitter, TripAdvisor, Instagram and Pinterest
play a crucial role in many young people’s daily life. Therefore, people today
have access to information much easier than before. However, this development
leads to a large number of bloggers, including food bloggers. Each food blogger
has his or her own ideas or comments about eating places which they have
visited. With such a huge amount of food rating information, it's hard for users
to find places to eat and drink that are right for themselves.
In conclusion, with these figures, it shows that Instagram is becoming more
influential to tourists. In particular, it is impossible not to mention about food
blogger - those who have a influence on the choice of places to eat and drink
for tourists. So why is food blogger becoming more popular and such a tourist
trend? What are the characteristics of an food blogger to travelers' dining
options? In this study, we aim to find answers to these problems.
Secure Best Marks with AI Grader
Need help grading? Try our AI Grader for instant feedback on your assignments.
1.2 RESEARCH PROBLEM DEFINING
1.2.1 Marketing problem defining
Concerning a report of market research firm Euromonitor, between 2014 and
2019, Vietnam’s food and beverage service (F&B) market grew at an average
rate of 18% per year. According to experts’ forecast, by 2023, the F&B
industry’s revenue could double, reaching 408 billion USD and continue to
grow further as the middle class in Vietnamese society is increasing. Although
there are few barriers to entry F&B market, the elimination rate is rapid[NT1] .
(VietNam, 2019) So it is a big challenge for businesses. To maintain prosper,
businesses have to be flexible in developing products and services, especially
can not fail to mention the appropriate and judicious marketing campaigns.
Today, the development of information technology and the media has had a
significant impact on the F&B industry. In particular, as food bloggers become
the new influencers of the food industry, many restaurant management was
taking this opportunity by inviting some food bloggers in purpose to review
their restaurant. The restaurant management expects that food bloggers can help
them to raise awareness of their brand to customers or even increasing their
sales through food bloggers. So what are the factors of food bloggers impact
most on customers’ food selection? That’s a problem which make businesses
always confused.
1.2.2 Study problem defining
Researching “The factors of Food Bloggers on Instagram that affect
students' food selections when travelling” to check the factors that customers
are most interested in and find correlations between these ones and customer
decisions.
1.3 OBJECTIVE OF THE RESEARCH
This study aims at investigating factors of food bloggers on Instagram that
affects student’s food selections when traveling and evaluating the influential
levels of these ones on student’s food selections when traveling. On the other
hand, based on the influential levels, this research will supply information to
food bloggers in order to help them know the factors which students are
interested in most and develop their own work.
1.4 RESEARCH QUESTION
· What are the factors of food bloggers on Instagram affecting students’
food selections when they travel?
· How do these factors impact on students’ food selections?
1.5 OBJECT AND SCOPE OF THE RESEARCH
1.5.1 Research object
Building a model of the factors of food bloggers on Instagram that affects
to students’ food selections when travelling.
1.5.2 Research scope
Content: The thesis focused on studying the model of the factors of food
bloggers on Instagram that affect students’ food selections when travelling.
Scope: This study focuses on students who are studying at Da Nang
University of Economics.
Time: This research will be carried out from May to June 2020.
PART 2. LITERATURE REVIEW
This section of this research is about the review of literature from previous
studies connected to this research. It also provides a background information
about some factors related to food selection decision and their impact on
students. Thus, it will help readers understand the multiple concepts related
researcher’s foundation for gathering and analysing data.
2.1 WHO ARE FOOD BLOGGERS?
According to “Food blogger Instagram: Promotion through social
media”, someone who shares and writes about food in a blog is known as a food
blogger. In addition, food bloggers not only use blogs as their media to share
but also social media such as Instagram which is a social media to share photos
online, which later it becomes one of the food bloggers tools to share. Food
bloggers are made by someone who is interested in cooking or trying new foods
either by cooking themselves or visiting a place that has a variety of different
and unique foods.
With regarding “Food Blogger Review on Instagram as an Alternative
for Helping Consumer Purchase Decision”, Food bloggers are widely known
by the public and have large followers so they have the ability to influence
others or as influencers.
According to “The impact of food blogger toward consumer’s attitude
and behavior in choosing restaurant”, in fact, food bloggers also have a
specialization in their topic about food. Some food bloggers have a hobby in
cooking; therefore, they share food recipes and put the food they had cooked on
the blog. Some others like to do culinary travel, and then they decided to share
their experience of having delicious meals in great new places or restaurants
through blog as well.
Paraphrase This Document
Need a fresh take? Get an instant paraphrase of this document with our AI Paraphraser
In the opinion of Lofgren (2013), food bloggers are people who promote
and share information about specific foods, restaurants, chefs, and recipes.
L. Robinson assumed that the person who did the food blogging is known
as a food blogger. Food bloggers tend to write about travel and restaurants
including home personal food diaries and their own recipes (The art of food
blogging)
In summary, food bloggers are people who write and share information
about the food such as recipes, culinary travel, restaurants or experiences of
having delicious meal through blogs or social media.
2.2 FOOD BLOGGERS ON INSTAGRAM
The impact of digital development is more happening at the business
level rather than on its food processing business. As a result, the utilization of
social media such as Instagram is so very popular. Promotion through food
blogger on Instagram social media in the eyes of respondents as a whole is in
the position of good category. This shows that promotion through food blogger
on Instagram social media can be a tool which can be used by restaurant
business actors in doing business promotion. (Food Blogger Review on
Instagram as an Alternative for Helping Consumer Purchase Decision)
Nowadays, Instagram has become a popular way for consumers to share
their lives with others and for brands to share their products with consumers.
Instagram is a perfect place for food bloggers to promote and share their work
as it’s all about gorgeous photography, visuals, discovery and inspiration. (Food
blogs on Instagram)
For culinary connoisseurs, certainly they will be familiar to the existence
of food bloggers as social media marketing, especially in Instagram, which is an
online mobile photosharing become one of food bloggers’ tools to share. With
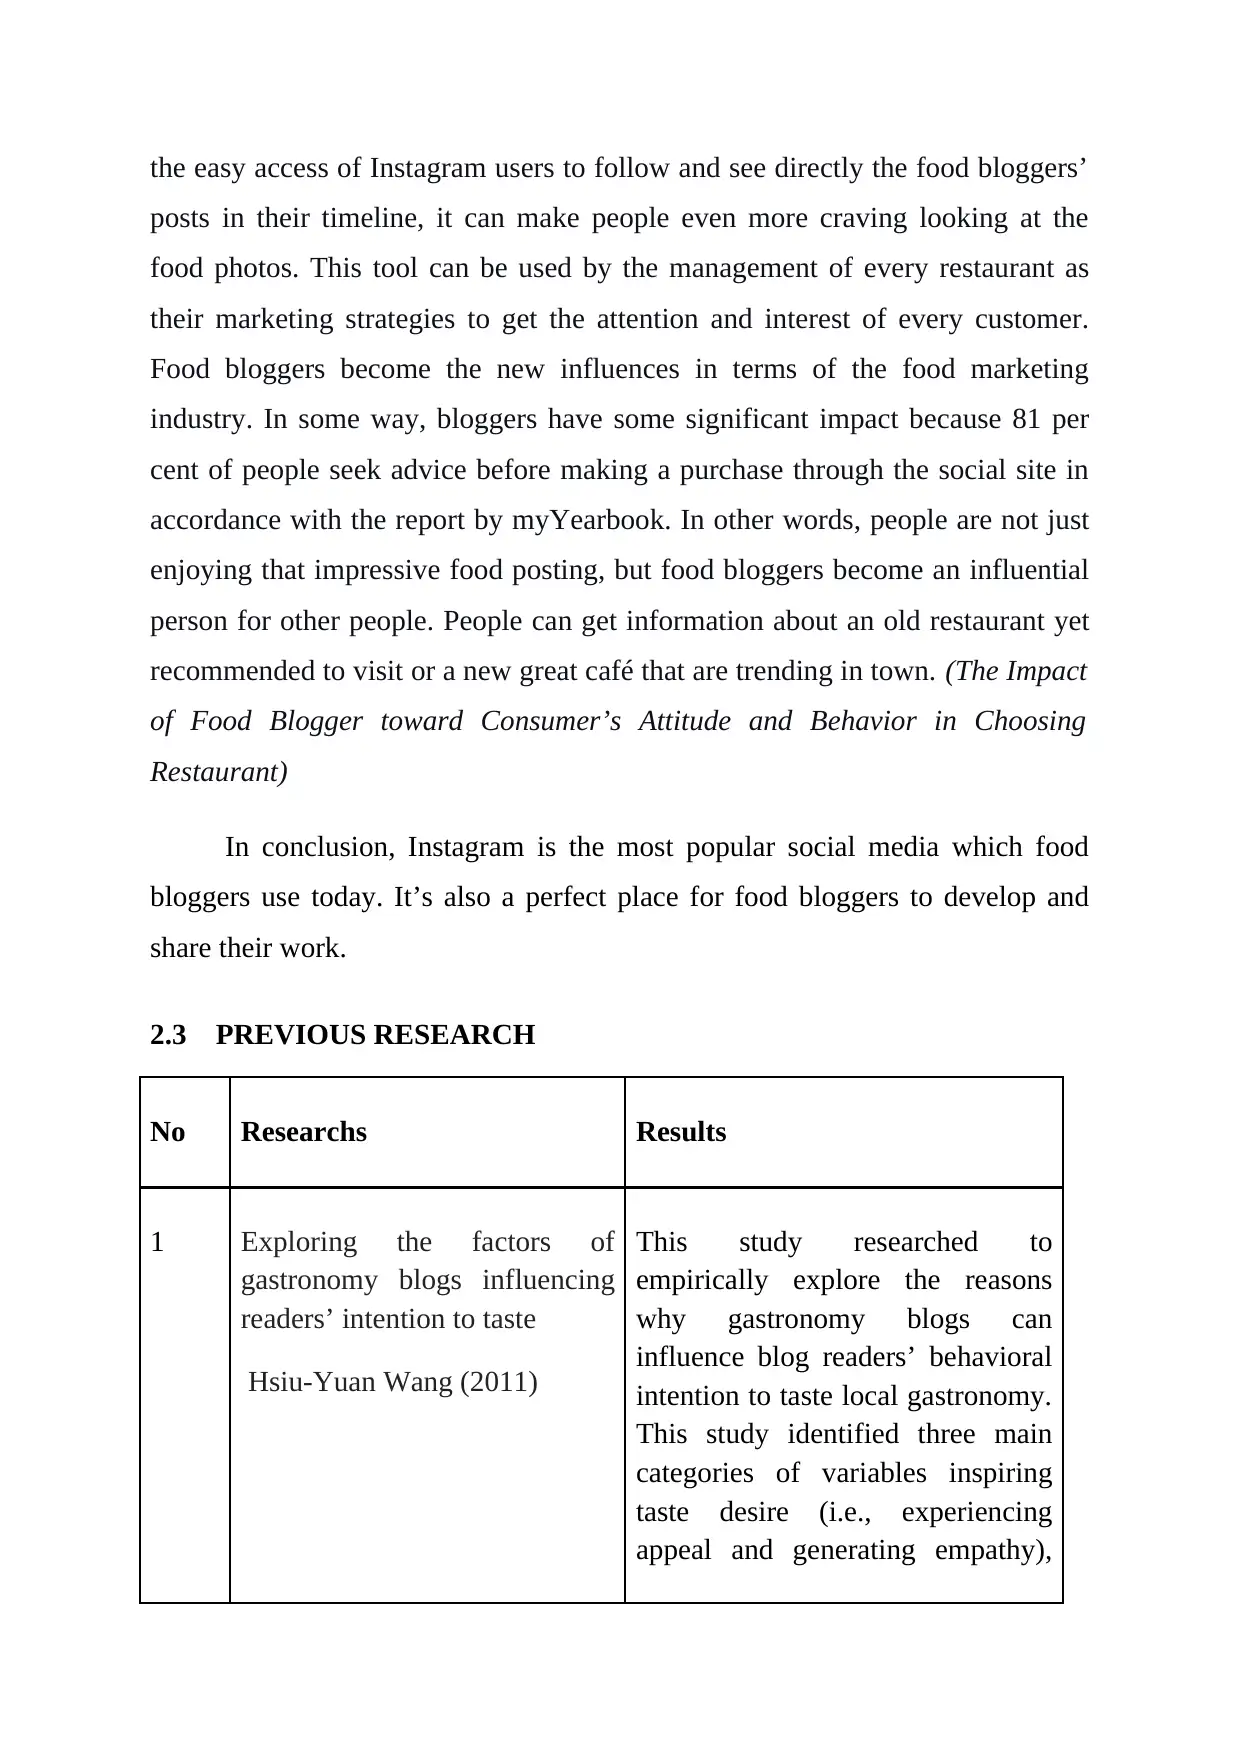
the easy access of Instagram users to follow and see directly the food bloggers’
posts in their timeline, it can make people even more craving looking at the
food photos. This tool can be used by the management of every restaurant as
their marketing strategies to get the attention and interest of every customer.
Food bloggers become the new influences in terms of the food marketing
industry. In some way, bloggers have some significant impact because 81 per
cent of people seek advice before making a purchase through the social site in
accordance with the report by myYearbook. In other words, people are not just
enjoying that impressive food posting, but food bloggers become an influential
person for other people. People can get information about an old restaurant yet
recommended to visit or a new great café that are trending in town. (The Impact
of Food Blogger toward Consumer’s Attitude and Behavior in Choosing
Restaurant)
In conclusion, Instagram is the most popular social media which food
bloggers use today. It’s also a perfect place for food bloggers to develop and
share their work.
2.3 PREVIOUS RESEARCH
No Researchs Results
1 Exploring the factors of
gastronomy blogs influencing
readers’ intention to taste
Hsiu-Yuan Wang (2011)
This study researched to
empirically explore the reasons
why gastronomy blogs can
influence blog readers’ behavioral
intention to taste local gastronomy.
This study identified three main
categories of variables inspiring
taste desire (i.e., experiencing
appeal and generating empathy),
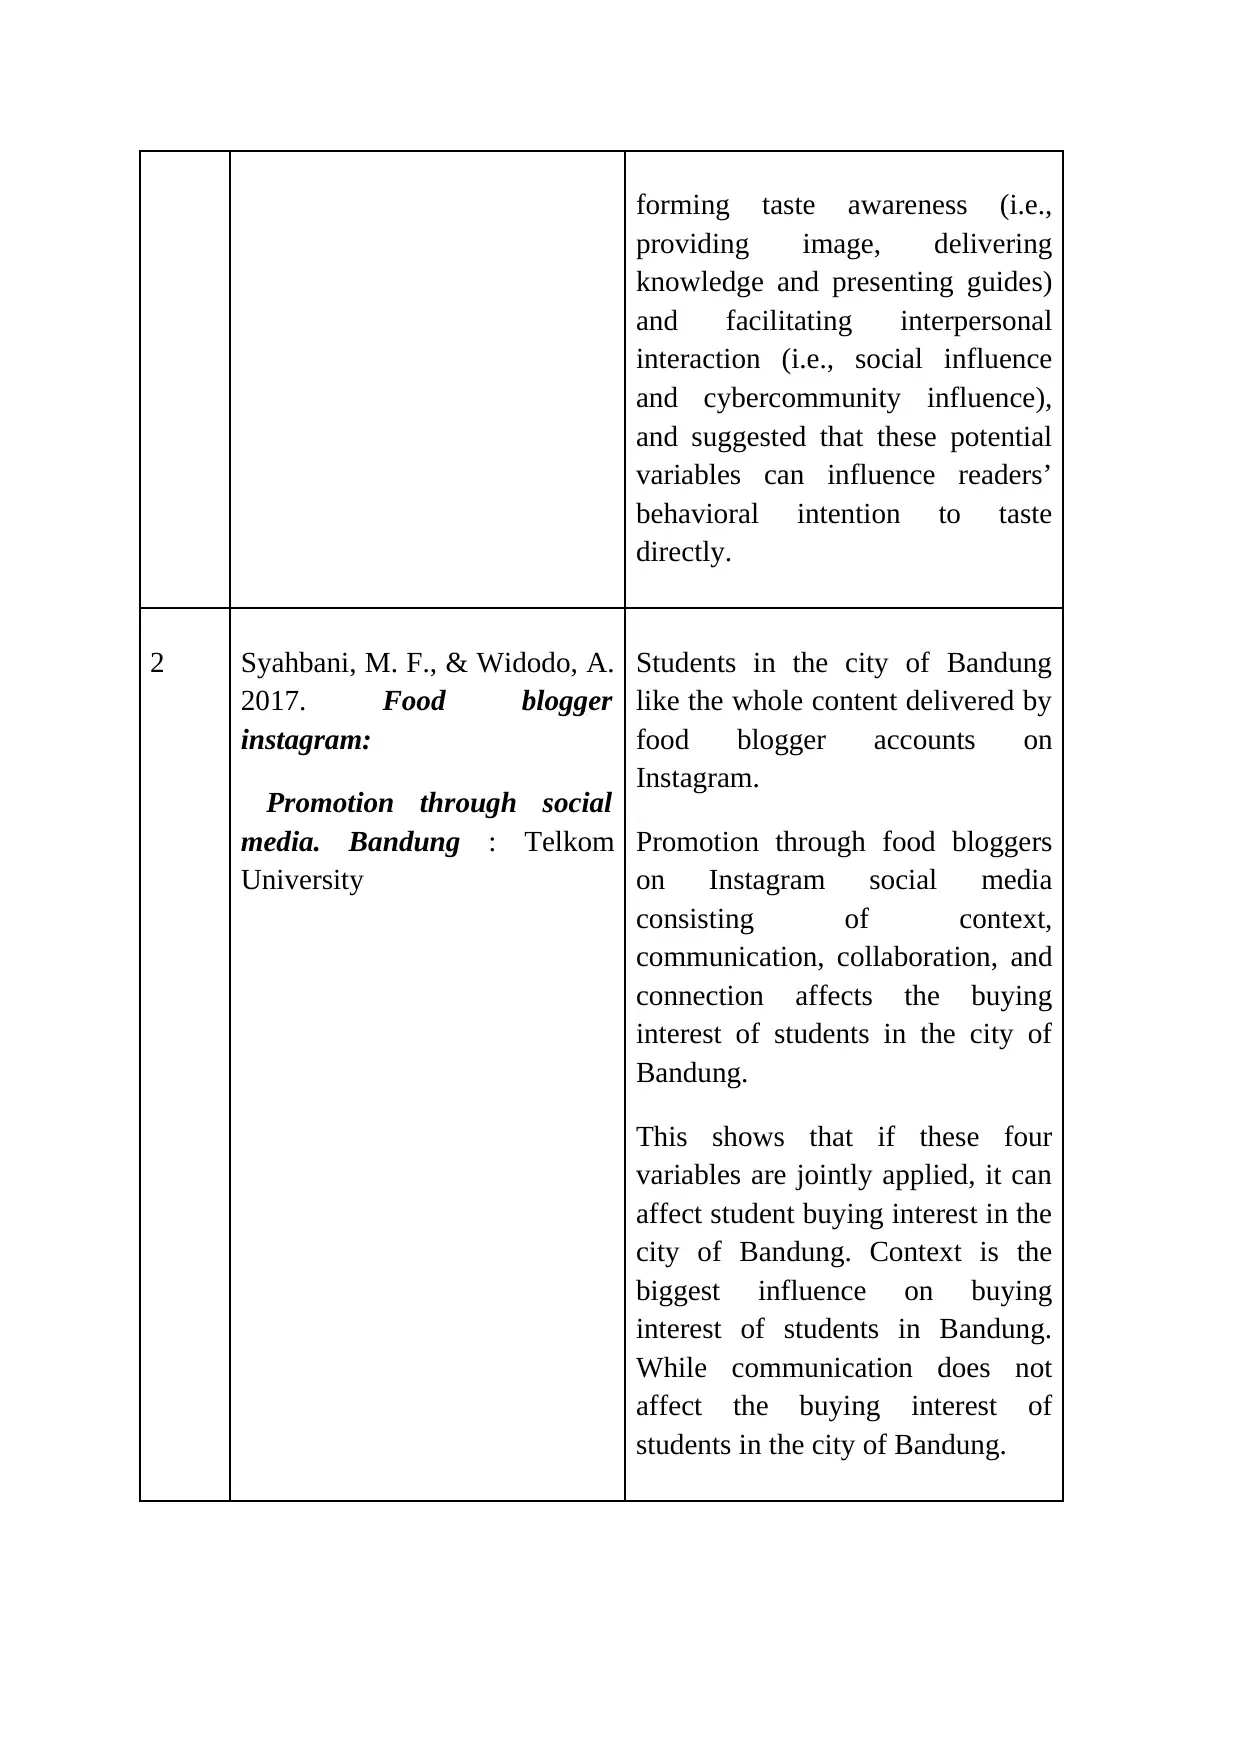
forming taste awareness (i.e.,
providing image, delivering
knowledge and presenting guides)
and facilitating interpersonal
interaction (i.e., social influence
and cybercommunity influence),
and suggested that these potential
variables can influence readers’
behavioral intention to taste
directly.
2 Syahbani, M. F., & Widodo, A.
2017. Food blogger
instagram:
Promotion through social
media. Bandung : Telkom
University
Students in the city of Bandung
like the whole content delivered by
food blogger accounts on
Instagram.
Promotion through food bloggers
on Instagram social media
consisting of context,
communication, collaboration, and
connection affects the buying
interest of students in the city of
Bandung.
This shows that if these four
variables are jointly applied, it can
affect student buying interest in the
city of Bandung. Context is the
biggest influence on buying
interest of students in Bandung.
While communication does not
affect the buying interest of
students in the city of Bandung.
Secure Best Marks with AI Grader
Need help grading? Try our AI Grader for instant feedback on your assignments.
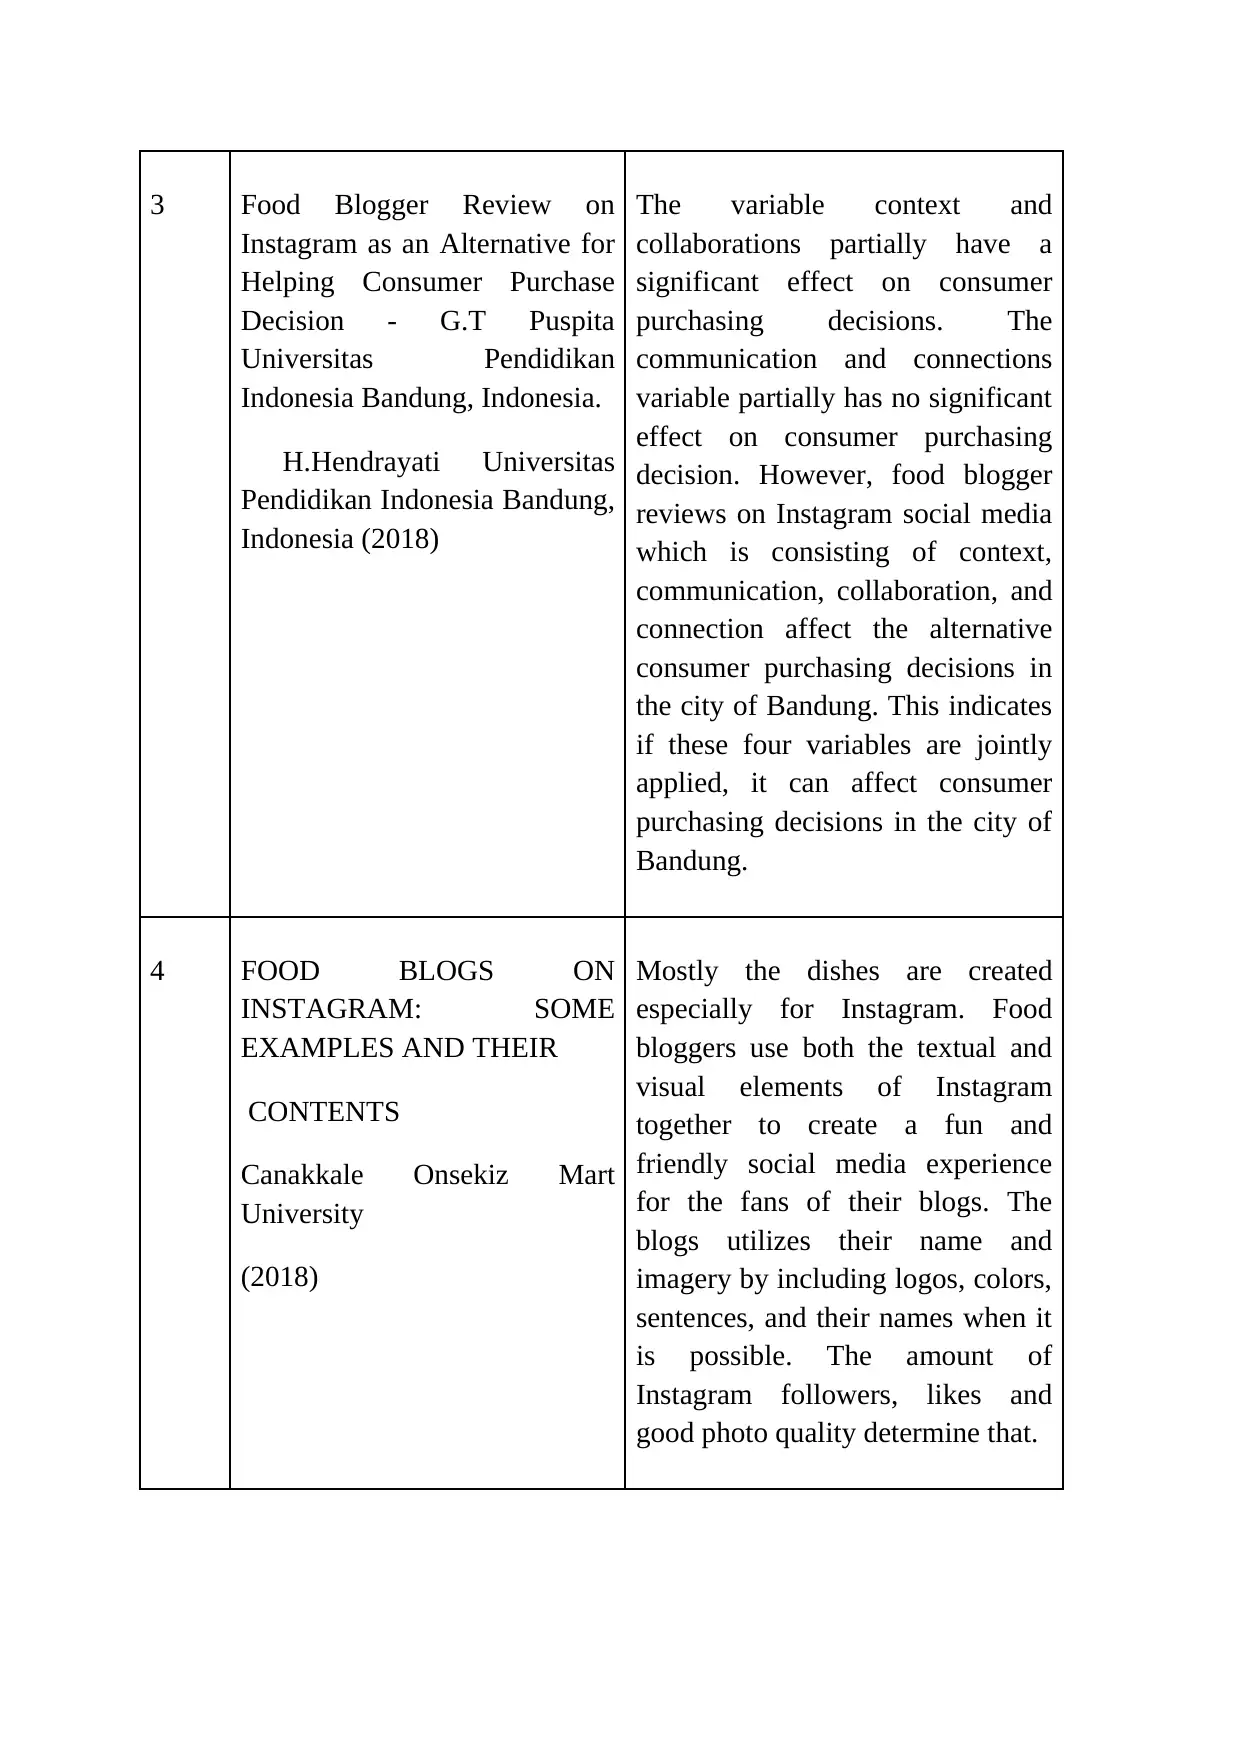
3 Food Blogger Review on
Instagram as an Alternative for
Helping Consumer Purchase
Decision - G.T Puspita
Universitas Pendidikan
Indonesia Bandung, Indonesia.
H.Hendrayati Universitas
Pendidikan Indonesia Bandung,
Indonesia (2018)
The variable context and
collaborations partially have a
significant effect on consumer
purchasing decisions. The
communication and connections
variable partially has no significant
effect on consumer purchasing
decision. However, food blogger
reviews on Instagram social media
which is consisting of context,
communication, collaboration, and
connection affect the alternative
consumer purchasing decisions in
the city of Bandung. This indicates
if these four variables are jointly
applied, it can affect consumer
purchasing decisions in the city of
Bandung.
4 FOOD BLOGS ON
INSTAGRAM: SOME
EXAMPLES AND THEIR
CONTENTS
Canakkale Onsekiz Mart
University
(2018)
Mostly the dishes are created
especially for Instagram. Food
bloggers use both the textual and
visual elements of Instagram
together to create a fun and
friendly social media experience
for the fans of their blogs. The
blogs utilizes their name and
imagery by including logos, colors,
sentences, and their names when it
is possible. The amount of
Instagram followers, likes and
good photo quality determine that.
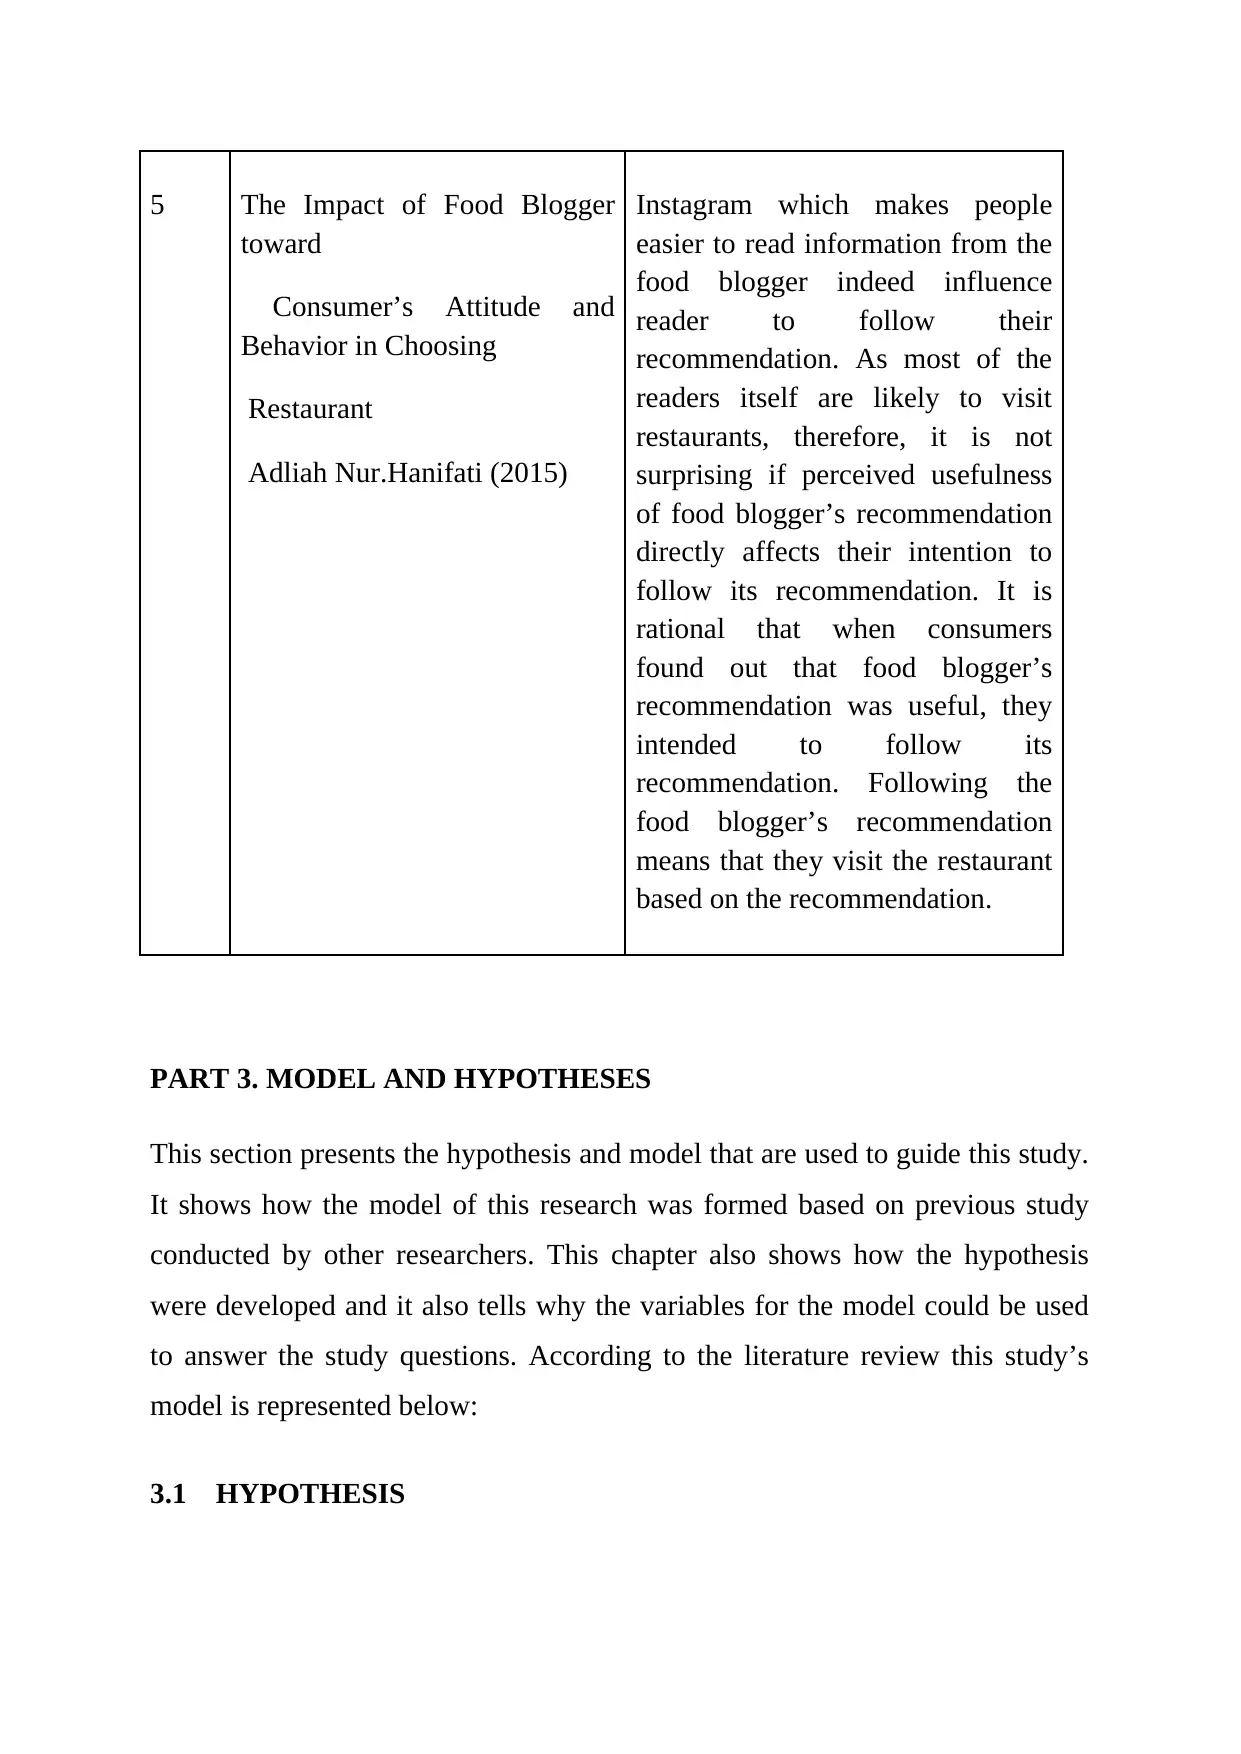
5 The Impact of Food Blogger
toward
Consumer’s Attitude and
Behavior in Choosing
Restaurant
Adliah Nur.Hanifati (2015)
Instagram which makes people
easier to read information from the
food blogger indeed influence
reader to follow their
recommendation. As most of the
readers itself are likely to visit
restaurants, therefore, it is not
surprising if perceived usefulness
of food blogger’s recommendation
directly affects their intention to
follow its recommendation. It is
rational that when consumers
found out that food blogger’s
recommendation was useful, they
intended to follow its
recommendation. Following the
food blogger’s recommendation
means that they visit the restaurant
based on the recommendation.
PART 3. MODEL AND HYPOTHESES
This section presents the hypothesis and model that are used to guide this study.
It shows how the model of this research was formed based on previous study
conducted by other researchers. This chapter also shows how the hypothesis
were developed and it also tells why the variables for the model could be used
to answer the study questions. According to the literature review this study’s
model is represented below:
3.1 HYPOTHESIS
After studying the previous research, our group decided to base on the research
"Exploring the factors of gastronomy blogs influencing readers’ intention to
taste" of Hsiu-Yuan Wang (2011) in order to build a research model of this
topic. Based on the research of Hsiu-Yuan Wang and other related documents,
this study will identify five main factors of food bloggers that affect students’
food selections when travelling: (1) inspiring taste desire, (2) delivering
knowledge, (3) presenting guides), (4) cybercommunity influence on Instagram
and (5) social influence and suggest that these factors could impact on students’
intention to taste directly.
3.1.1 Inspiring taste desire
Inspiring taste desire in this study refers to the degree to which pictures,
videos and contents in food bloggers' pages can make readers feel attractive,
curious, and excited, including generating aspiration of tasting cuisines in
gastronomic location the author described. Through the progress of media
technology, most consumers can now see the photos and read information about
scenic spots over the Internet to experience the sights in advance (Klein,1998).
Especially for young people who are born in this information age, and grew up
with the Internet and social media. Faced to the question “Will You Find Your
Next Client — or Will They Find You?”, it is a direct challenge to business
owners to define a marketing strategy, a combination search, social media and
content marketing, to attract a clearly defined audience who are researching a
solution to a challenge or need. Content marketing is the foundation for a
successful inbound strategy for without content there is nothing to optimize and
nothing to share on social sites (Debra Murphy). A study in Scotland by Boyne
et al. (2002) ascertained that tourists who had viewed pictures and text in a
guidebook were inspired and ready to spend more money on meals involving
locally produced food, desired to taste local cuisine and preferred eating out
Paraphrase This Document
Need a fresh take? Get an instant paraphrase of this document with our AI Paraphraser
more often. Obviously, contents play an important role in attracting tourists to
follow food blogs and inspiring their intention to taste.
Visual media creates influence on individual perceptions of what is
attractive, exciting, curious, and attention grabbing. Rust and Oliver (2000)
indicated that feelings of excitement or curiosity can prompt expectation of food
experiences since a need to taste local food or regional beverages may come
from excitement seeking, thus pushing people to have exciting experiences.
Sparks et al. (2003) also stated the opportunity of trying new, exciting and
different foods (i.e., curiosity) is one of the major reasons for eating out during
holidays Prior studies have suggested that photos or movies that can help to feel
the appeal of landscapes, and cause high level of interest and empathy with
characters in a drama would create positive effect on individual intention to
have direct experience (Kim et al., 2007b; Lin and Huang, 2006). Cuisine
promotional materials in general include good pictures of food. Attractive
photographs have proven to be effective tools for them to enhance the
consumer’s visual impression (Neal et al., 2000). Through presenting touching
photographs in websites normally help to generate empathy and inspire others
to do likewise (Lin and Huang, 2006). According to the research “Food
Influencers on Instagram and Chinese Overseas Students in the UK”, visual
content (pictures and video clips) is regarded as the most significant use of
social media platforms especially Instagram. The statistics show that visual
content is the most essential thing for the food-related content on Instagram.
This result reflects that visual content, especially pictures, is the most influential
factor of Instagram and food posts. Moreover, nice pictures and videos can not
only attract more Chinese overseas students but also increase the impact of food
influencers.
When students visit the food bloggers' page, it can be said that the first
thing that catches their eyes is the impressive photos and videos. Besides,
attractive contents also play an equally important role to stimulate students’
intention to taste. Hence, we suppose that attractive pictures, videos and content
have positive effects on students' behavioral intention to taste when travelling.
H1: Inspiring taste desire has a positive effect on students’ food selections
when travelling.
3.1.2 Delivering knowledge
Delivering knowledge in this study is defined as the extent to which food
bloggers can help journeyers to understand the local culture where they are
going to visit such as local food traditions and habits, table manners and how to
enjoy unfamiliar local dishes. For example, travelling to Danang, you cannot
miss local cuisine such as Quang Noodles, Pork Rolls, or in Hue city, you
should try enjoying some special food such as Bun Bo Hue, Bun Hen.
Through gastronomy blogs, they can share their true experiences in culinary
destinations they visited, learn some knowledge about local cuisine, or decrease
the worry of tasting unfamiliar food materials, such that the possibility of
promoting tourists’ intention to have direct tasting experience is high.
Accordingly, we anticipate that delivering knowledge has a positive effect on
the behaviours of food selections. This leads to the hypothesis as the following:
H2: Delivering knowledge has a positive effect on students’ food selections
when travelling.
3.1.3 Presenting guides
Presenting guides, helping to form taste awareness, refers to the degree to which
food bloggers can provide useful guides such as suggestions of menu items and
food budget, information regarding address, map and business hours of a
cuisine location, as well as tips to help accomplish the plan of a culinary
journey.
Food bloggers who have personally tasted local cuisine are supposed to know
and post the above information in their page to guide travellers to have a direct
experience. By visiting gastronomy blogs, journeyers can acquire more
gastronomic suggestions, compare the alternatives and then make the best
decision for foodstuffs selection. This may boost their intention to taste local
delicacies. Therefore, we predict that presenting guides has a positive influence
on tourists' behavioural intention to food selection. The following hypothesis
was tested:
H3. Presenting guides has a positive effect on students’ food selections when
travelling.
3.1.4 Facilitating interpersonal interaction
Social influence
Based on Venkatesh et al. (2003), social influence in this study refers to the
extent to which a person perceives that important others have visited
somewhere (e.g., a culinary destination or prestigious restaurants, bars, cafes,
etc.), tasted something (e.g., healthy local cuisine) or carried out a culinary
journey recommended by gastronomy blogs.
The advent of the Instagram have enabled people to rely more and more on
online information searching for seeking information related to gastronomy
and tourism. Gastronomy blog authors who have had positive experiences in
tasting local delicacies (such as taste, price, food hygiene and safety, etc) can
spread eWOM by creating a new type of reality to influence readers during
their online information searches (Litvin et al., 2008). Those who have
information from food bloggers are able to personally give it a try, and then
Secure Best Marks with AI Grader
Need help grading? Try our AI Grader for instant feedback on your assignments.
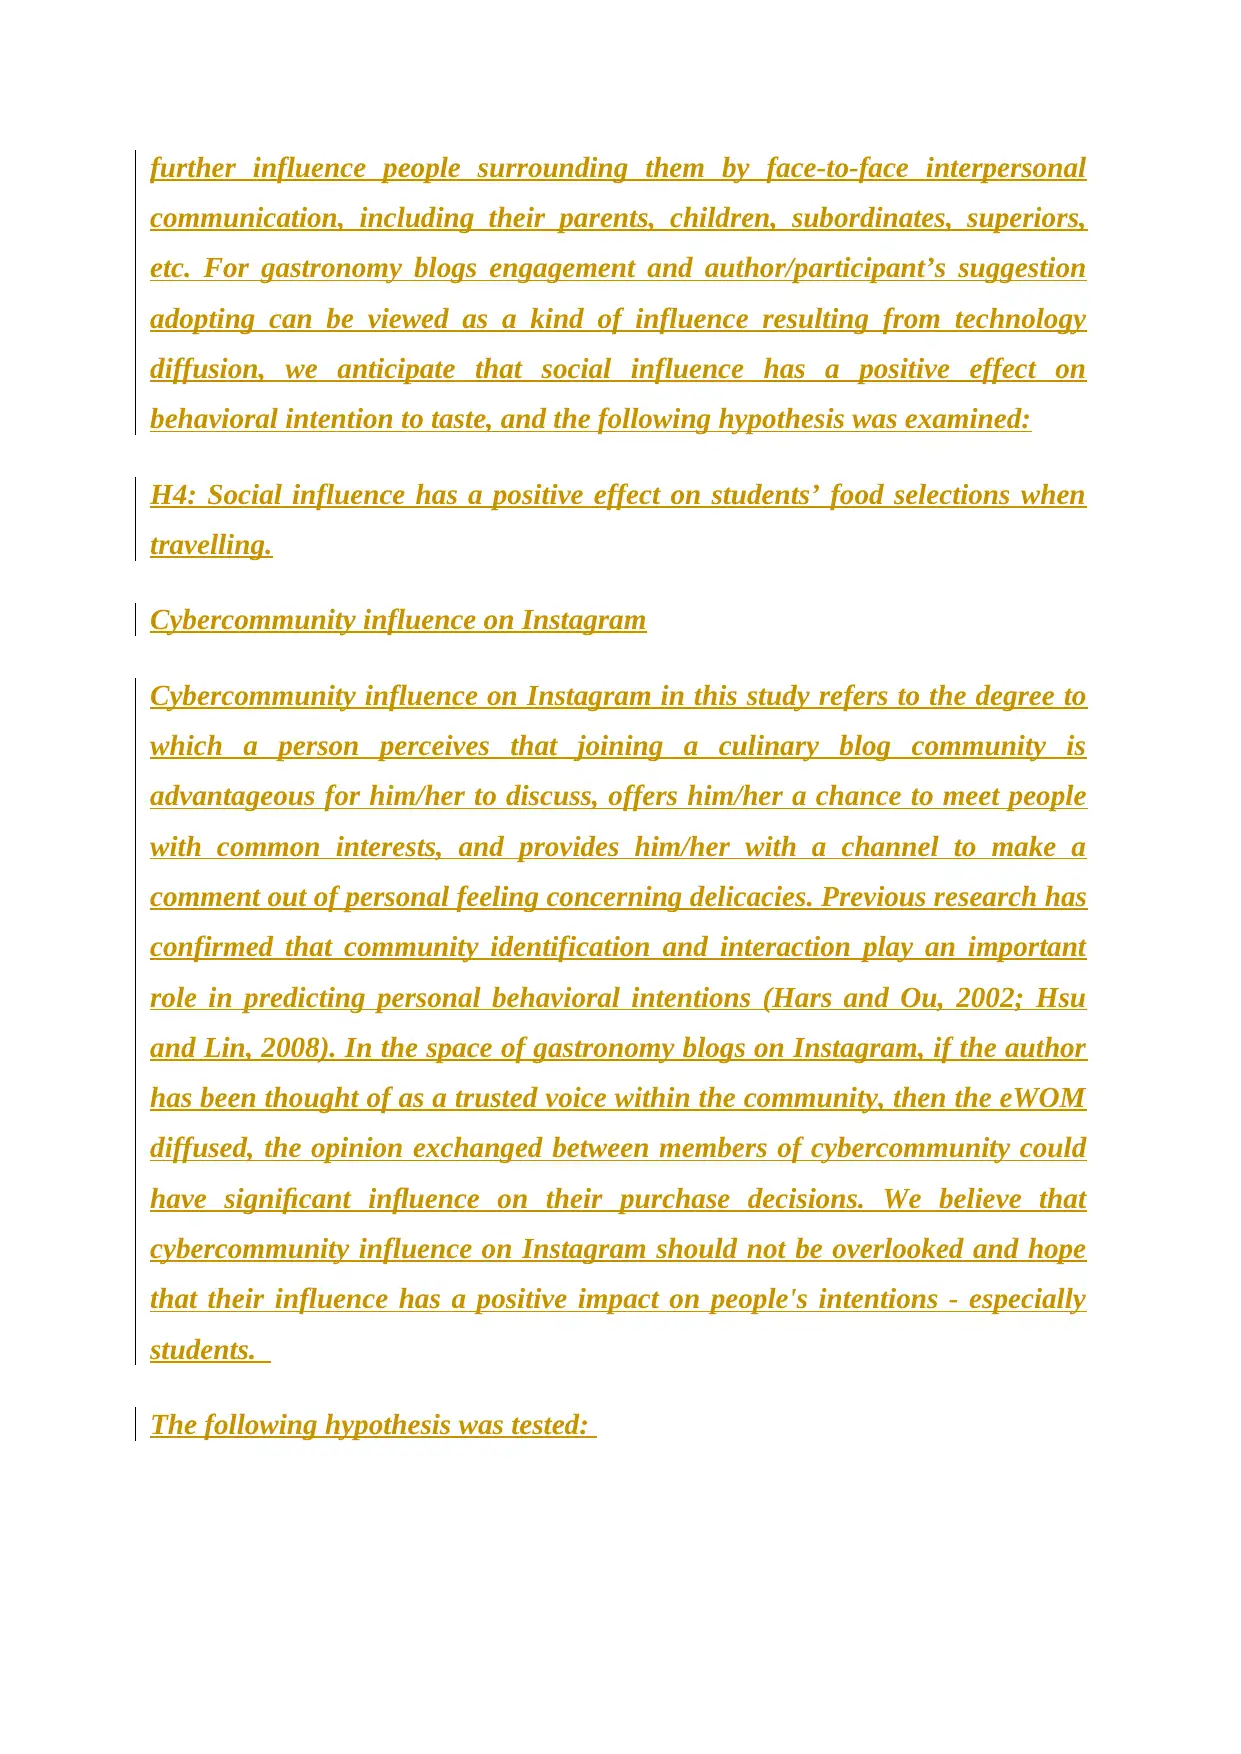
further influence people surrounding them by face-to-face interpersonal
communication, including their parents, children, subordinates, superiors,
etc. For gastronomy blogs engagement and author/participant’s suggestion
adopting can be viewed as a kind of influence resulting from technology
diffusion, we anticipate that social influence has a positive effect on
behavioral intention to taste, and the following hypothesis was examined:
H4: Social influence has a positive effect on students’ food selections when
travelling.
Cybercommunity influence on Instagram
Cybercommunity influence on Instagram in this study refers to the degree to
which a person perceives that joining a culinary blog community is
advantageous for him/her to discuss, offers him/her a chance to meet people
with common interests, and provides him/her with a channel to make a
comment out of personal feeling concerning delicacies. Previous research has
confirmed that community identification and interaction play an important
role in predicting personal behavioral intentions (Hars and Ou, 2002; Hsu
and Lin, 2008). In the space of gastronomy blogs on Instagram, if the author
has been thought of as a trusted voice within the community, then the eWOM
diffused, the opinion exchanged between members of cybercommunity could
have significant influence on their purchase decisions. We believe that
cybercommunity influence on Instagram should not be overlooked and hope
that their influence has a positive impact on people's intentions - especially
students.
The following hypothesis was tested:
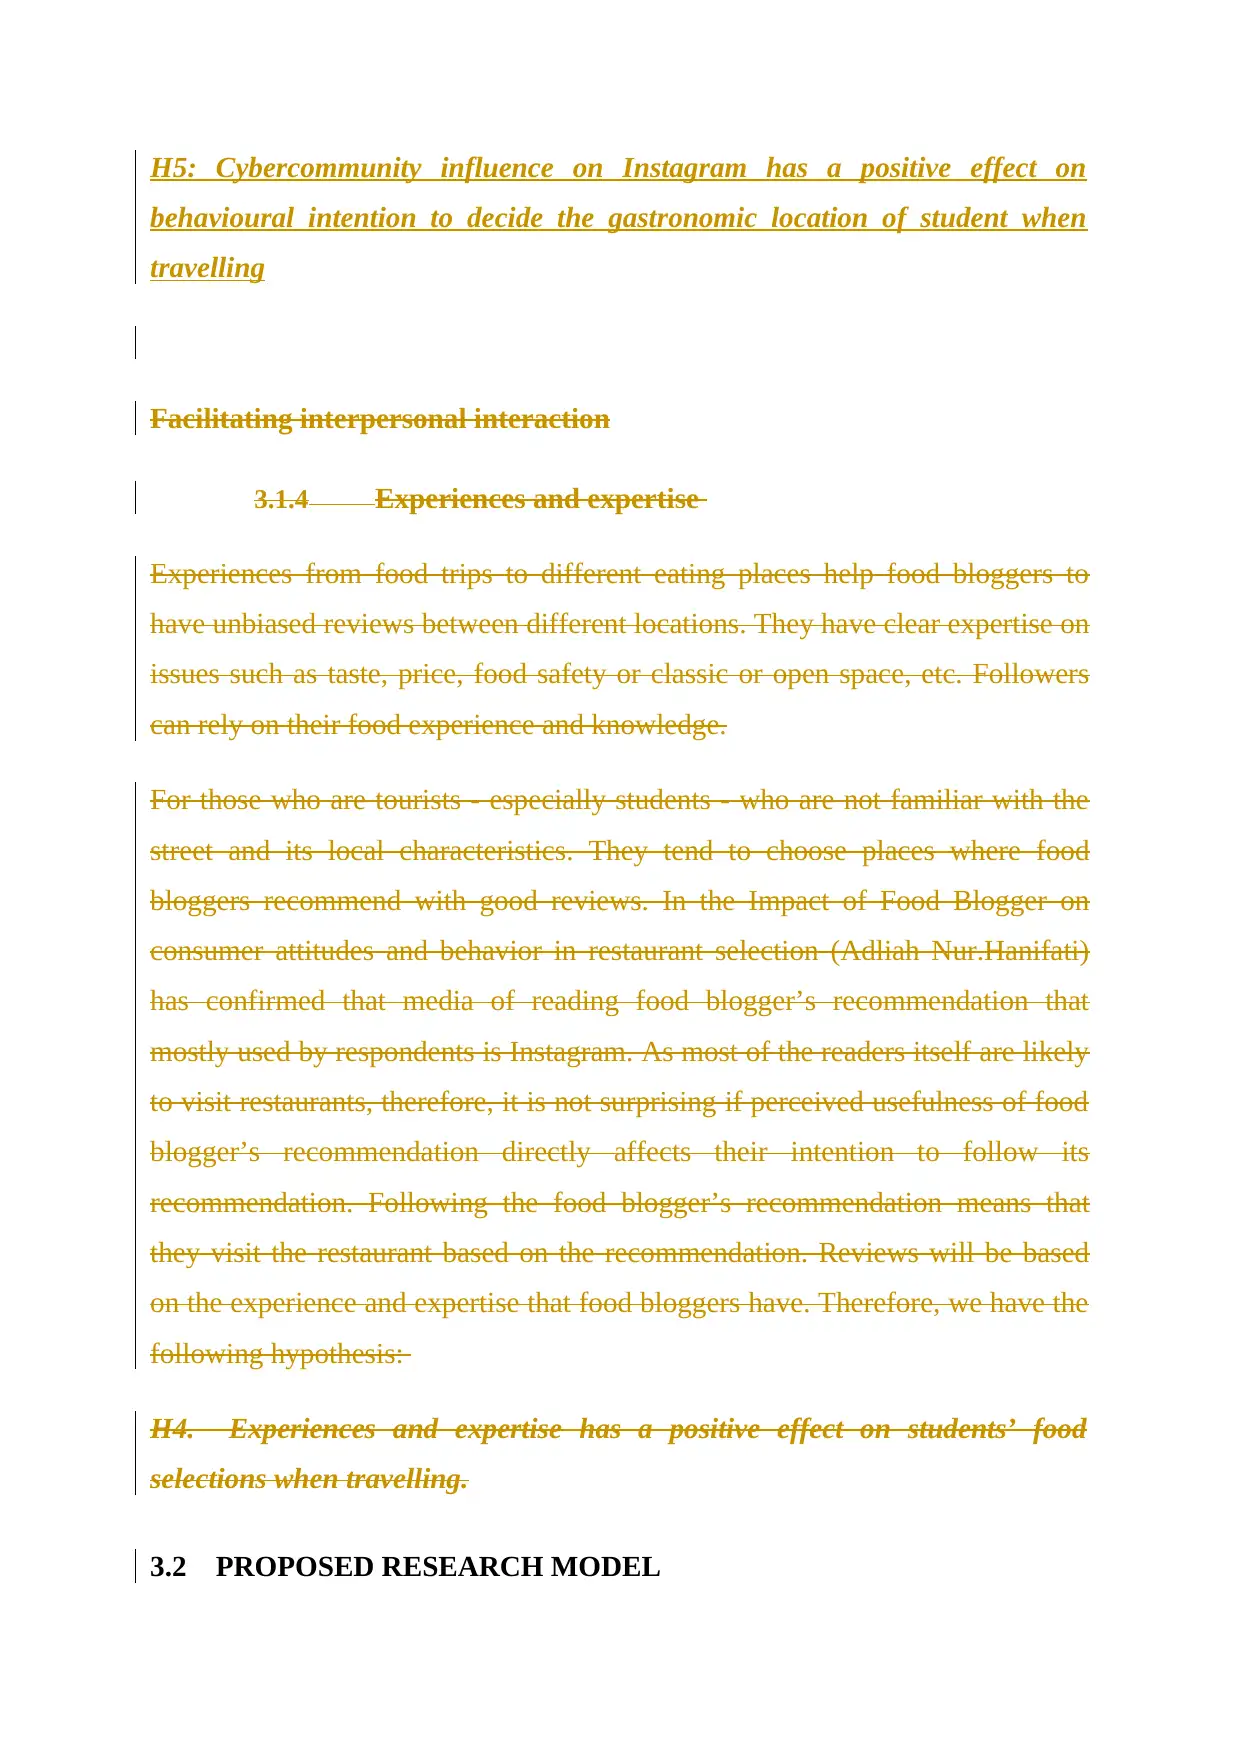
H5: Cybercommunity influence on Instagram has a positive effect on
behavioural intention to decide the gastronomic location of student when
travelling
Facilitating interpersonal interaction
3.1.4 Experiences and expertise
Experiences from food trips to different eating places help food bloggers to
have unbiased reviews between different locations. They have clear expertise on
issues such as taste, price, food safety or classic or open space, etc. Followers
can rely on their food experience and knowledge.
For those who are tourists - especially students - who are not familiar with the
street and its local characteristics. They tend to choose places where food
bloggers recommend with good reviews. In the Impact of Food Blogger on
consumer attitudes and behavior in restaurant selection (Adliah Nur.Hanifati)
has confirmed that media of reading food blogger’s recommendation that
mostly used by respondents is Instagram. As most of the readers itself are likely
to visit restaurants, therefore, it is not surprising if perceived usefulness of food
blogger’s recommendation directly affects their intention to follow its
recommendation. Following the food blogger’s recommendation means that
they visit the restaurant based on the recommendation. Reviews will be based
on the experience and expertise that food bloggers have. Therefore, we have the
following hypothesis:
H4. Experiences and expertise has a positive effect on students’ food
selections when travelling.
3.2 PROPOSED RESEARCH MODEL
PART 4. METHODOLOGY
This section of the theses clarifies the study design and the quantitative nature
of this research, the techniques that were used in gathering this research data,
the sampling procedure, sample size and research budget. This chapter also
gives information about the research instrument which is a direct interview and
the content of the interview, the procedure and the method of the analysis.
4.1 RESEARCH PROCESS
4.1.1 Research process
In order to accomplish the research objectives and specifically answer the
research questions mentioned above, this study will be conducted based on
quantitative research with the following research process.
Steps of the research process Result
4.1.2 Timeline
Stage Tasks Time Situation
Paraphrase This Document
Need a fresh take? Get an instant paraphrase of this document with our AI Paraphraser
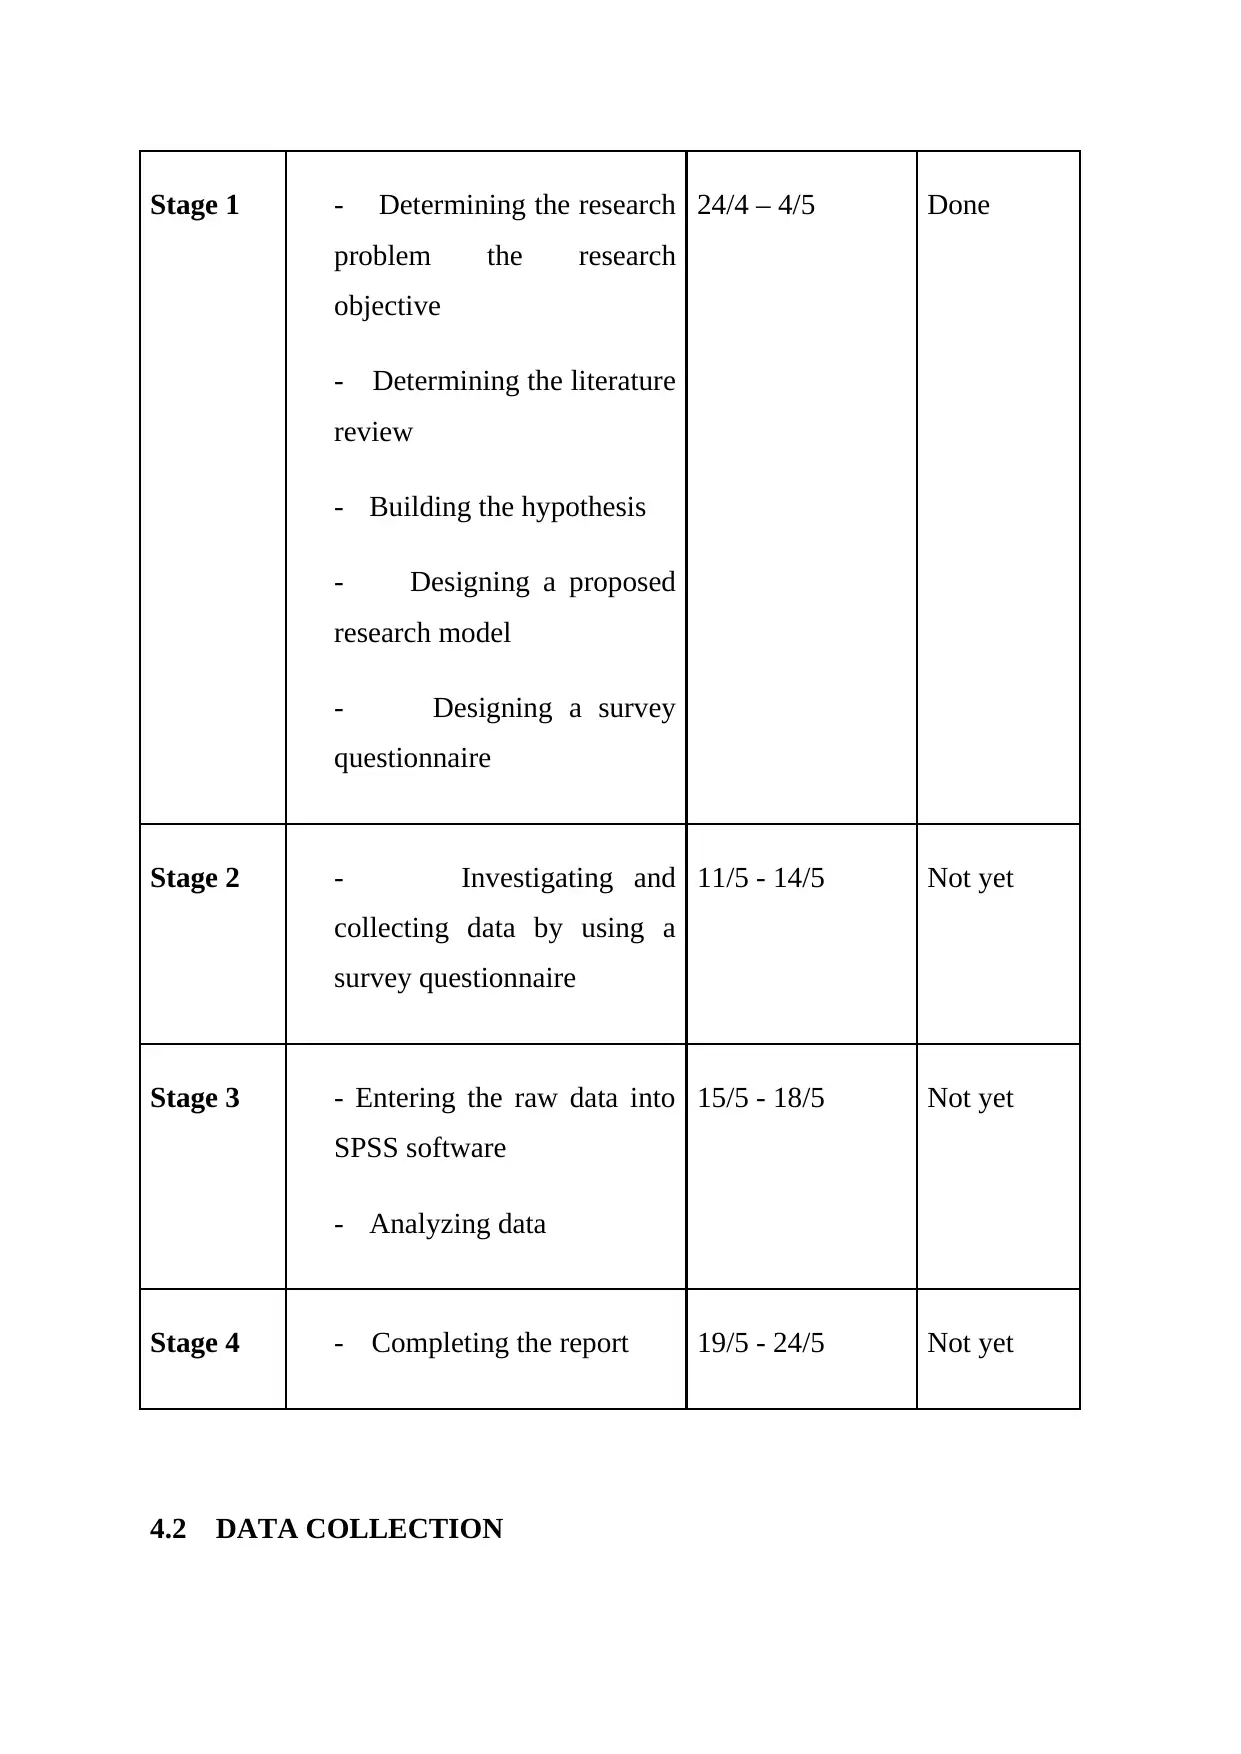
Stage 1 - Determining the research
problem the research
objective
- Determining the literature
review
- Building the hypothesis
- Designing a proposed
research model
- Designing a survey
questionnaire
24/4 – 4/5 Done
Stage 2 - Investigating and
collecting data by using a
survey questionnaire
11/5 - 14/5 Not yet
Stage 3 - Entering the raw data into
SPSS software
- Analyzing data
15/5 - 18/5 Not yet
Stage 4 - Completing the report 19/5 - 24/5 Not yet
4.2 DATA COLLECTION
4.2.1 Research approach
The research nature is quantitative. Quantitative research is defined as
a systematic investigation of phenomena by gathering quantifiable data and
performing statistical, mathematical, or computational techniques.[NT2] [A3] The
quantitative research has been chosen for this research, this is because of the
aim of this research. The research aimed to understand how the specific factors
affect students' food selection and what they consider before they choose food
when travelling. Another reason for choosing quantitative research is quick,
reliable and accurate collected data. As data is collected, analyzed, and
presented in numbers, the results obtained will be extremely reliable. Numbers
do not lie. They offer an honest picture of the conducted research without
discrepancies and is also extremely accurate. Besides, this research method
offers no scope for personal comments or biasing of results. The results
achieved are numerical and are thus, fair in most cases.
4.2.2 Data collection method
To carry out this study, our team will collect data via a direct survey
questionnaire. The content of the questionnaire includes the following:
Introduction: This section briefly introduces the research topic, the
purpose and the meaning of the information provided for the research.
Part 1: Personal information. This section is to identify data related to
respondents to ensure that the respondents are appropriate for the research.
Part 2: Answer the question. The main content includes questions related
to the factors of food bloggers on Instagram that affects to students’ food
selections when travelling.
All answers in part 2 of the Questionnaire are given scores from 1 to 5
(Likert scale of 5). The meanings of the scores are:
• 1 = Strongly disagree
• 2 = Disagree
• 3 = Neutral
• 4 = Agree
• 5 = Strongly agree
4.2.3 How to collect data
· Direct interview: Conducted at Danang University of Economics. This
method ensures the number and quality of answers, and is consistent with the
goals that our group aims to.
· Online survey: This method helps the group expand the answers and save
a certain cost and time. The group will post the survey questionnaire on
Group “Sinh viên ĐH Kinh tế Đà Nẵng”.
We will give a small gift which includes 20 templates PowerPoint and some
study documents to each interviewee after taking part in the survey.
4.2.4 Questionnaire (enclosed file)
4.3 Sampling method
Sample size: sample size depends on the expectation of reliability, data analysis
method and estimation method used in the study. The data analysis method used
for this study was exploratory factor analysis (EFA). For factor analysis, the
sample size is usually determined based on the number of measurement
Secure Best Marks with AI Grader
Need help grading? Try our AI Grader for instant feedback on your assignments.
variables included in the study. Hair et al. (2006) suggested that to use EFA, the
sample size must be at least 50, the observation rate/items is 5: 1, meaning that
the number of samples needs to be 5 times compared to the number of observed
variables. In this topic, there are 13 items of observation (items) that need to
conduct factor analysis, so the minimum number of samples needed is 13 x 5 =
65.
To ensure the reliability of the survey, although the sample size requirement is
65, this study will survey 150 students from Da Nang University of Economics.
Sampling method: Non-probability sampling method
Collecting data: Data collection is performed via online survey questionnaire
and direct interview. The data collection will be conducted from May 11 to May
14, 2020.
Processing data: After collecting data, it is necessary to examine them to make
sure they are meaningful and valuable to process and analysis. For
questionnaires with "bad" data (incomplete answers, inappropriate answers,
unreadable answers, etc.), they can be remedied and inferred from other
questions or we can return to the respondents to clarify the matter. In particular,
after returning to ask more interviewers, if the data are unreliable, we will
discard the data. Data are entered into SPSS 20.0 software.
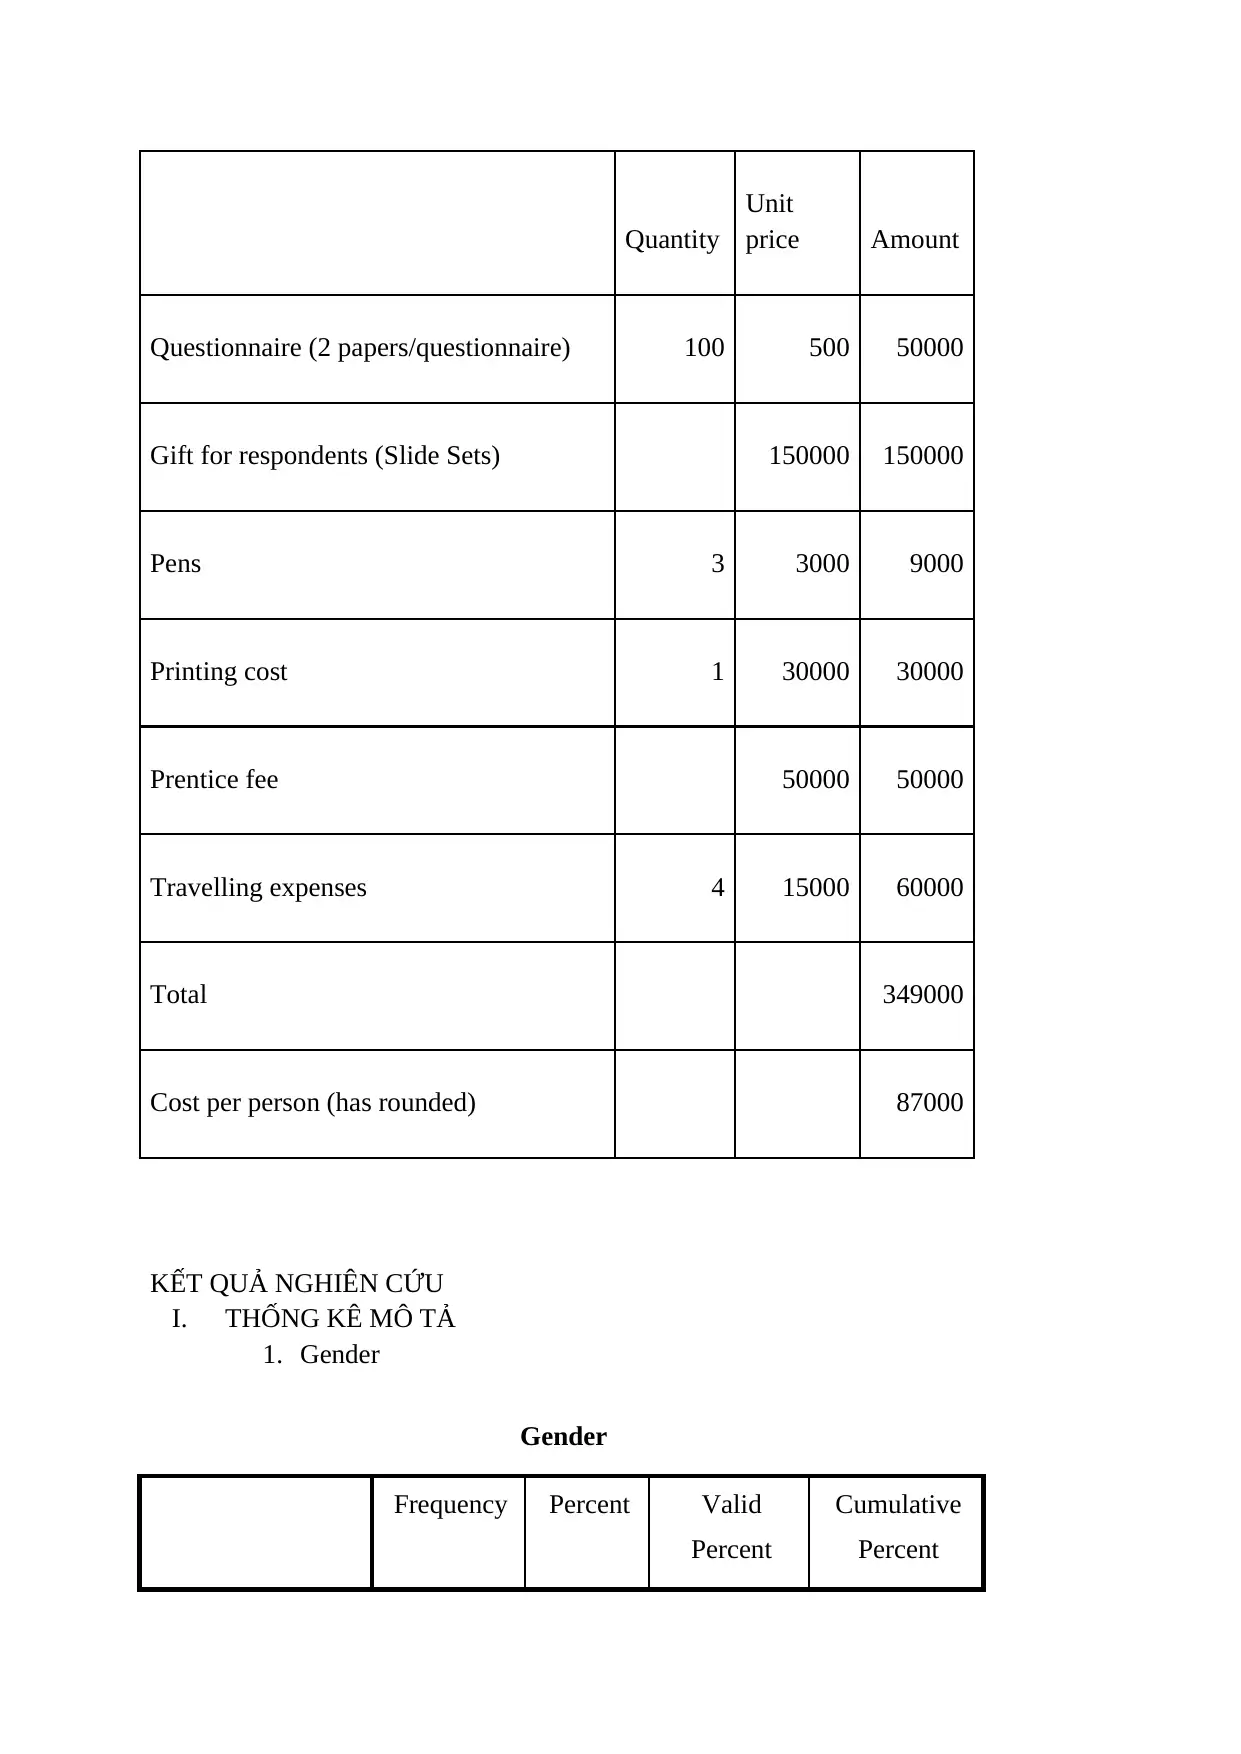
4.4 Research budget
Because our team will conduct the study by giving directly a paper
questionnaire to the interviewees, the estimated research budget is listed below:
Research budget
sample size must be at least 50, the observation rate/items is 5: 1, meaning that
the number of samples needs to be 5 times compared to the number of observed
variables. In this topic, there are 13 items of observation (items) that need to
conduct factor analysis, so the minimum number of samples needed is 13 x 5 =
65.
To ensure the reliability of the survey, although the sample size requirement is
65, this study will survey 150 students from Da Nang University of Economics.
Sampling method: Non-probability sampling method
Collecting data: Data collection is performed via online survey questionnaire
and direct interview. The data collection will be conducted from May 11 to May
14, 2020.
Processing data: After collecting data, it is necessary to examine them to make
sure they are meaningful and valuable to process and analysis. For
questionnaires with "bad" data (incomplete answers, inappropriate answers,
unreadable answers, etc.), they can be remedied and inferred from other
questions or we can return to the respondents to clarify the matter. In particular,
after returning to ask more interviewers, if the data are unreliable, we will
discard the data. Data are entered into SPSS 20.0 software.
4.4 Research budget
Because our team will conduct the study by giving directly a paper
questionnaire to the interviewees, the estimated research budget is listed below:
Research budget
Quantity
Unit
price Amount
Questionnaire (2 papers/questionnaire) 100 500 50000
Gift for respondents (Slide Sets) 150000 150000
Pens 3 3000 9000
Printing cost 1 30000 30000
Prentice fee 50000 50000
Travelling expenses 4 15000 60000
Total 349000
Cost per person (has rounded) 87000
KẾT QUẢ NGHIÊN CỨU
I. THỐNG KÊ MÔ TẢ
1. Gender
Gender
Frequency Percent Valid
Percent
Cumulative
Percent
Vali
d
"Male" 51 33,3 33,3 33,3
"Female
"
102 66,7 66,7 100,0
Total 153 100,0 100,0
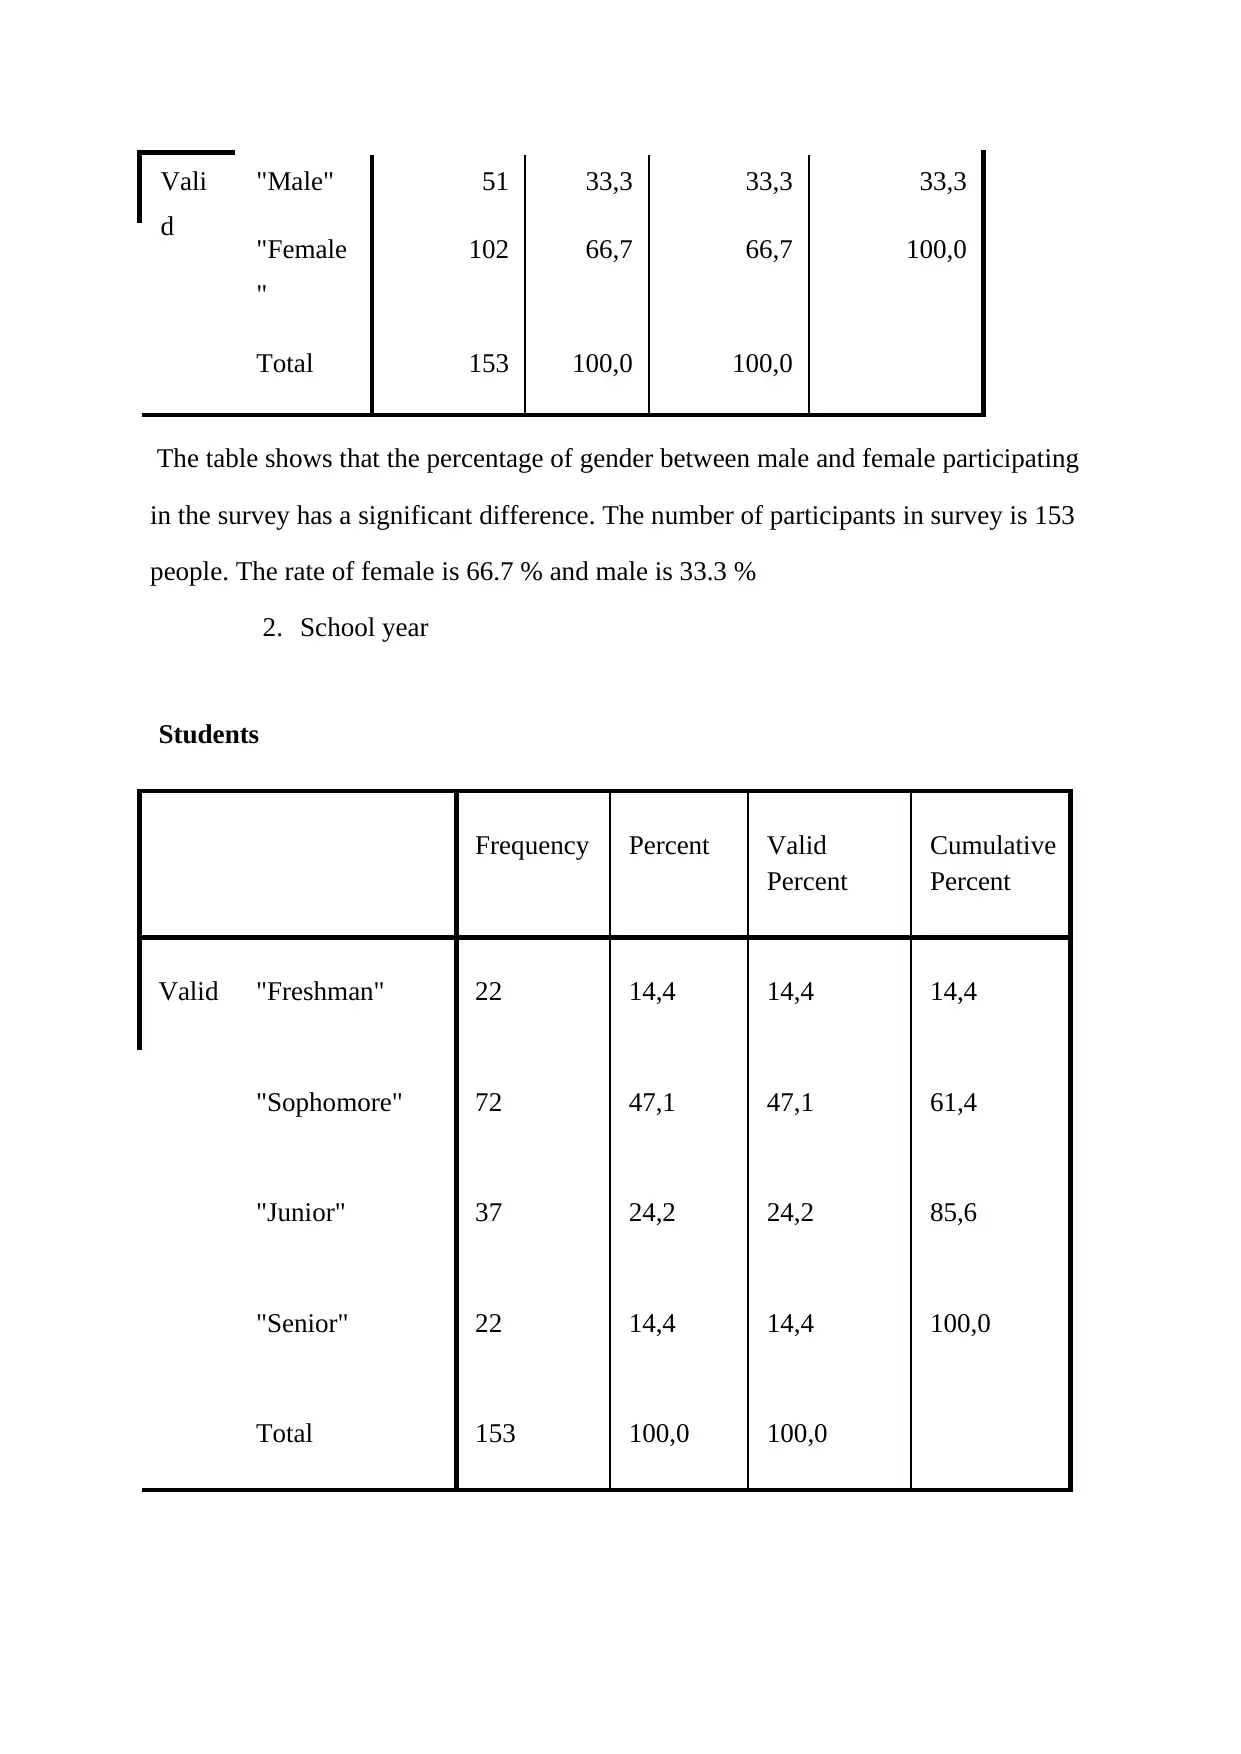
The table shows that the percentage of gender between male and female participating
in the survey has a significant difference. The number of participants in survey is 153
people. The rate of female is 66.7 % and male is 33.3 %
2. School year
Students
Frequency Percent Valid
Percent
Cumulative
Percent
Valid "Freshman" 22 14,4 14,4 14,4
"Sophomore" 72 47,1 47,1 61,4
"Junior" 37 24,2 24,2 85,6
"Senior" 22 14,4 14,4 100,0
Total 153 100,0 100,0
d
"Male" 51 33,3 33,3 33,3
"Female
"
102 66,7 66,7 100,0
Total 153 100,0 100,0
The table shows that the percentage of gender between male and female participating
in the survey has a significant difference. The number of participants in survey is 153
people. The rate of female is 66.7 % and male is 33.3 %
2. School year
Students
Frequency Percent Valid
Percent
Cumulative
Percent
Valid "Freshman" 22 14,4 14,4 14,4
"Sophomore" 72 47,1 47,1 61,4
"Junior" 37 24,2 24,2 85,6
"Senior" 22 14,4 14,4 100,0
Total 153 100,0 100,0
Paraphrase This Document
Need a fresh take? Get an instant paraphrase of this document with our AI Paraphraser
According to data from the survey, it can be seen that the participants surveyed focus
on a group of sophomore students which make up 47,1 %. Following is the group of
junior students with 24,2%. Other groups have the same rate 14,1%.
3. Level of concern
4. Food Bloggers
Case Summary
Cases
Valid Missing Total
N Percent N Percent N Percent
$FBa 153 100,0% 0 0,0% 153 100,0%
a. Group
$FB Frequencies
Responses Percent of Cases
N Percent
Food Blogera "Nofoodphobia" 33 9,0% 21,6%
"Ninhtito" 71 19,5% 46,4%
"Ăn sập Sài Gòn" 80 21,9% 52,3%
"The Panda’s Flavor" 35 9,6% 22,9%
"Nothingtoeat" 59 16,2% 38,6%
"Hana.foodie" 64 17,5% 41,8%
"Khác" 23 6,3% 15,0%
Total 365 100,0% 238,6%
a. Group
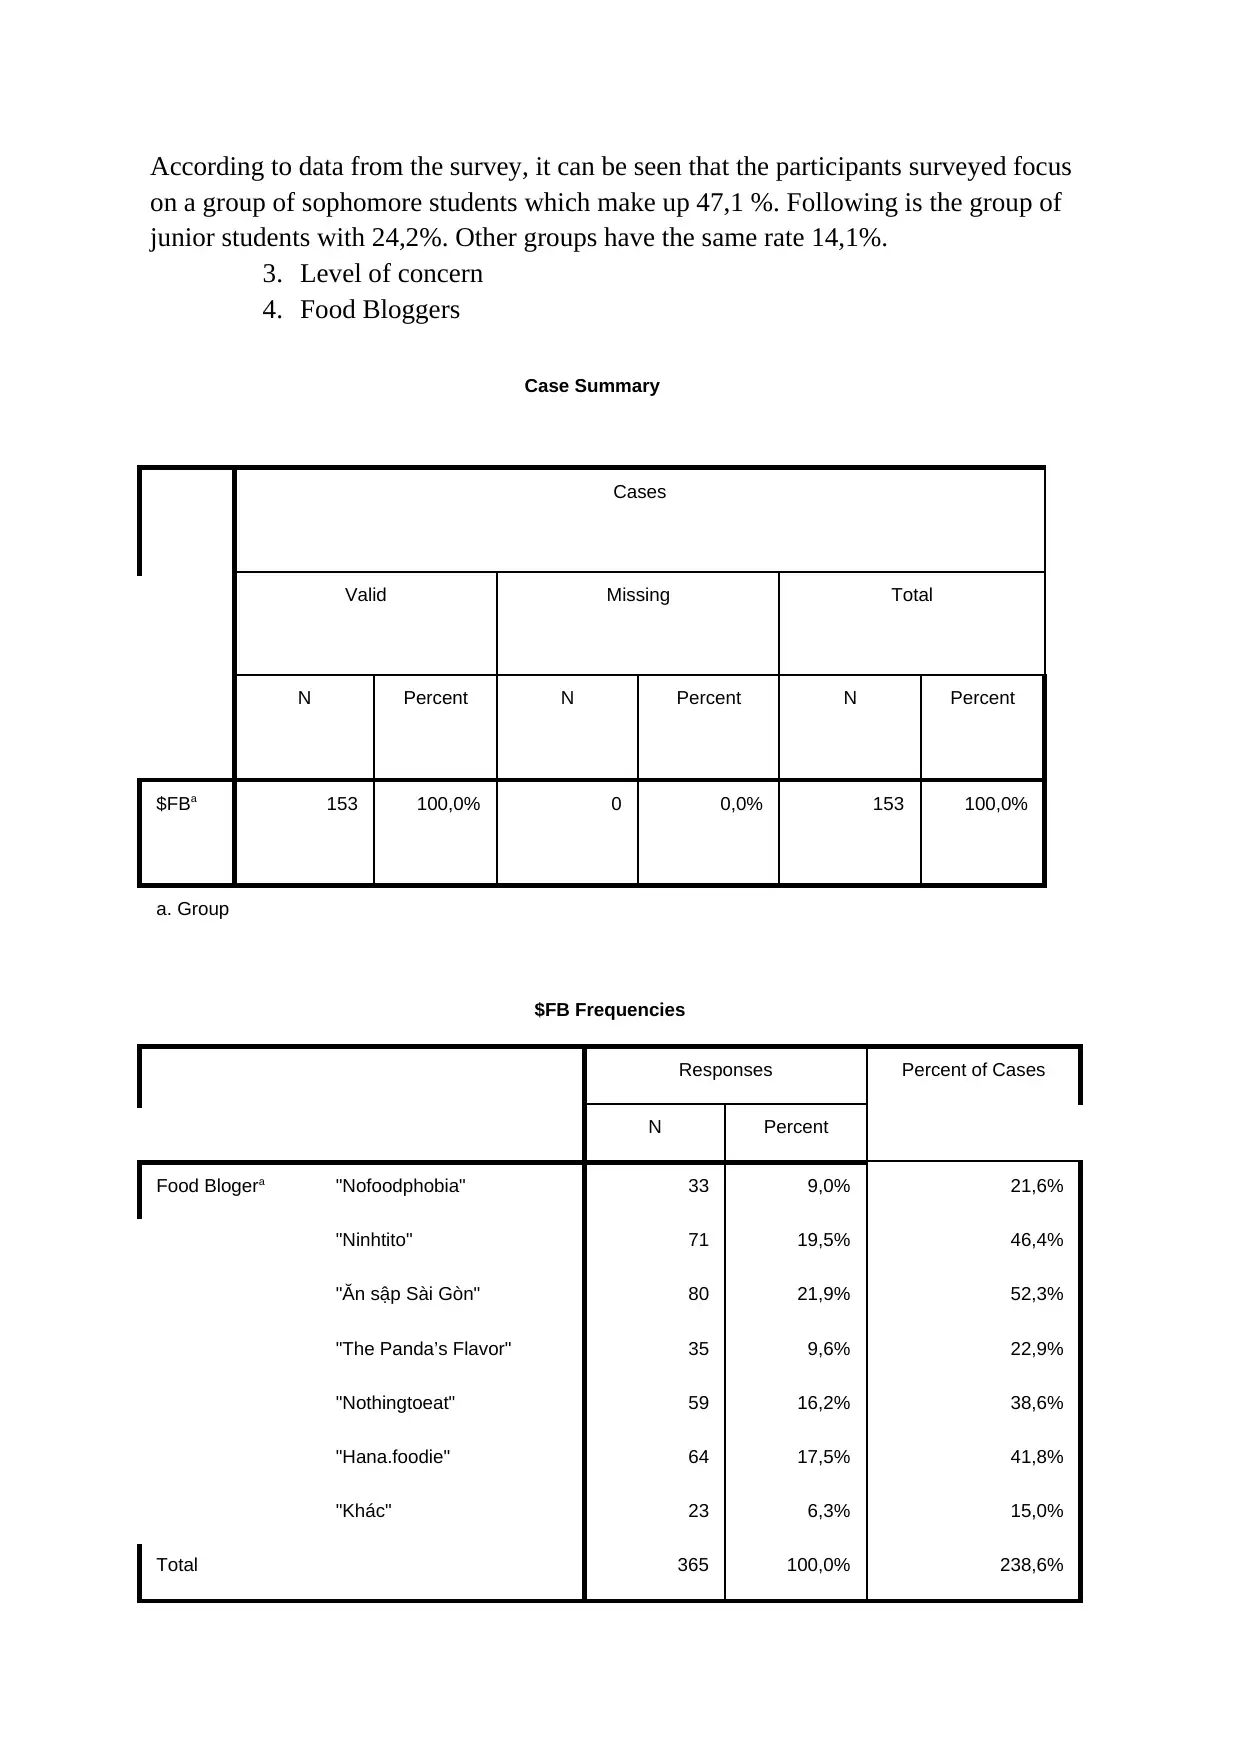
In this statistics, it shows that who food blogger is most popular in students. And the
result is “Ăn sập Sài Gòn” is the most popular food blogger with 21,9%. Followed by
Ninhtito, Hana.foodie and Nothingtoeat with 19,5%, 27,5% and 16,2 % respectively.
The remaining choices are Nofoodphobia, The Panda’s Flavor and other.
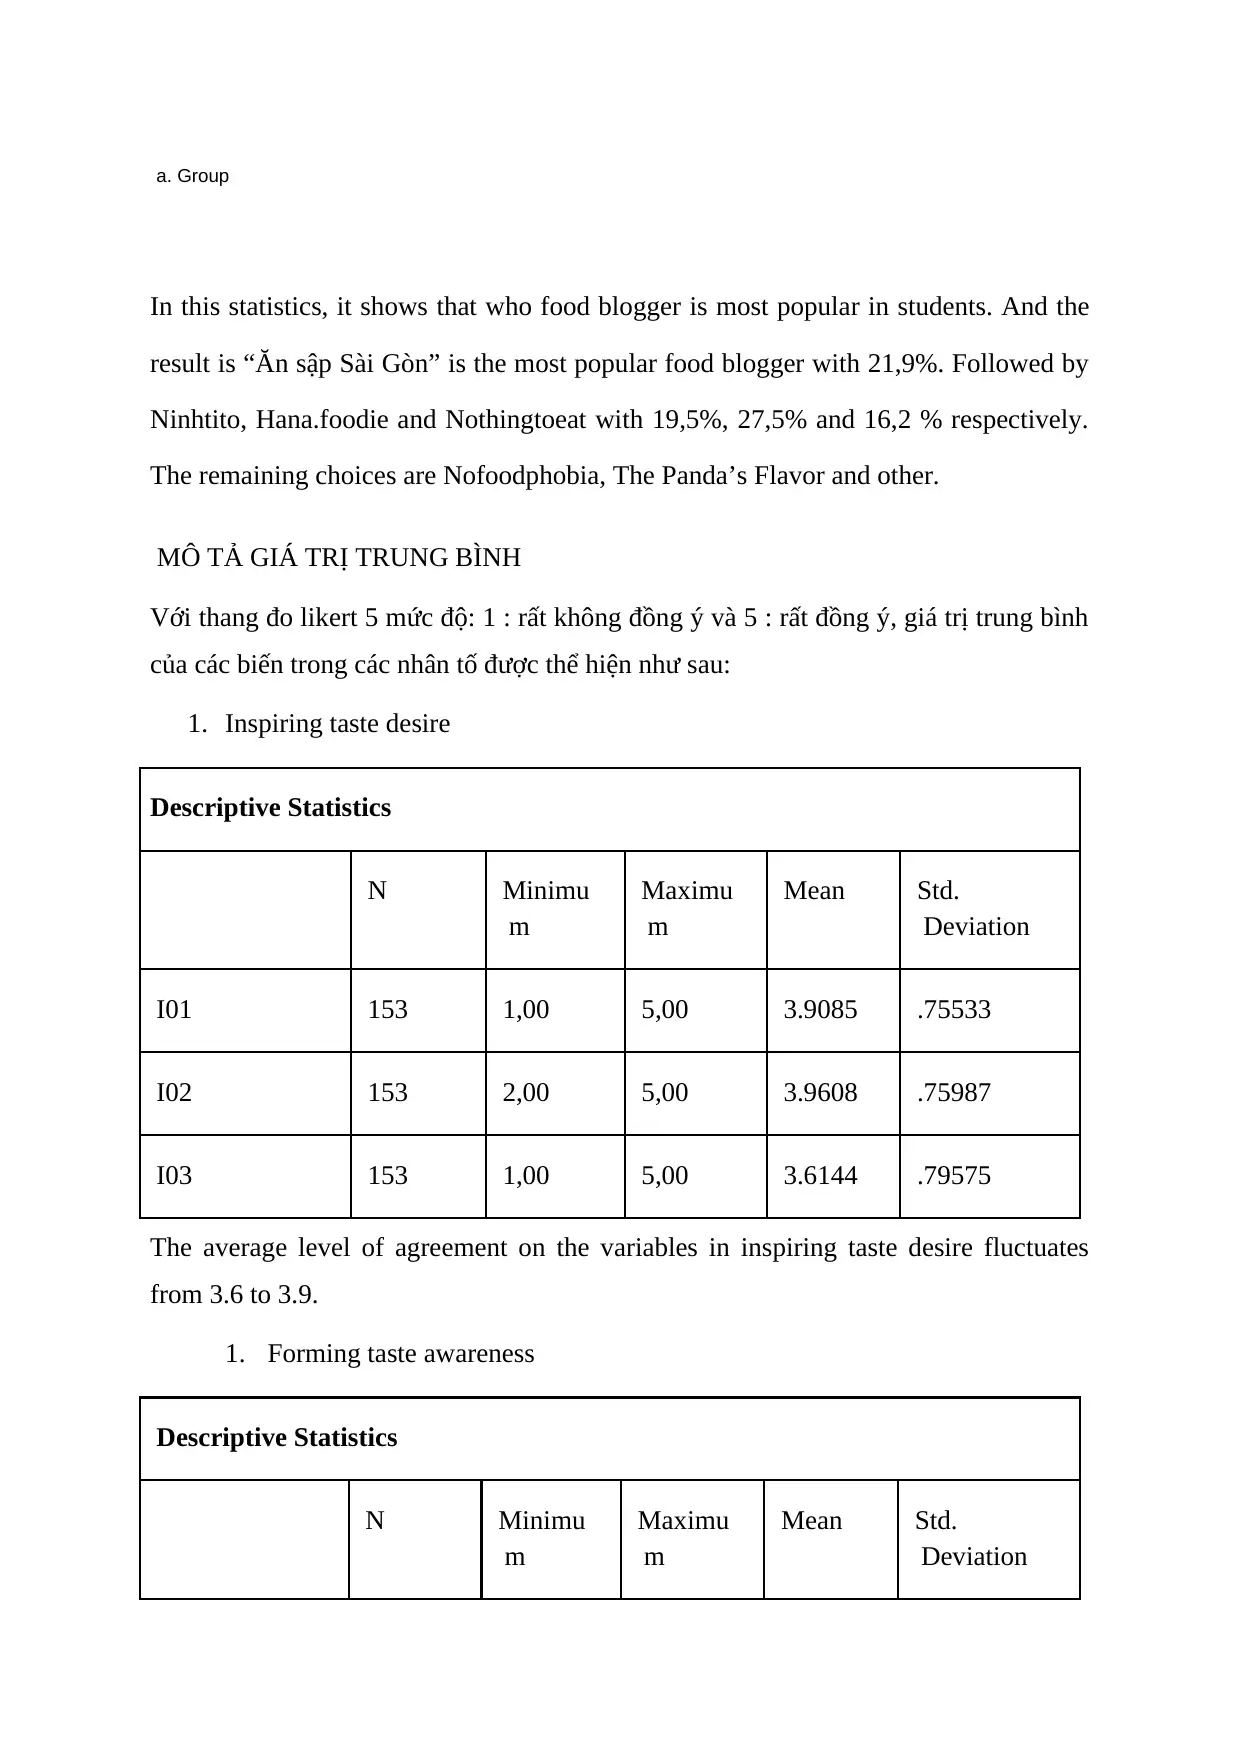
MÔ TẢ GIÁ TRỊ TRUNG BÌNH
Với thang đo likert 5 mức độ: 1 : rất không đồng ý và 5 : rất đồng ý, giá trị trung bình
của các biến trong các nhân tố được thể hiện như sau:
1. Inspiring taste desire
Descriptive Statistics
N Minimu
m
Maximu
m
Mean Std.
Deviation
I01 153 1,00 5,00 3.9085 .75533
I02 153 2,00 5,00 3.9608 .75987
I03 153 1,00 5,00 3.6144 .79575
The average level of agreement on the variables in inspiring taste desire fluctuates
from 3.6 to 3.9.
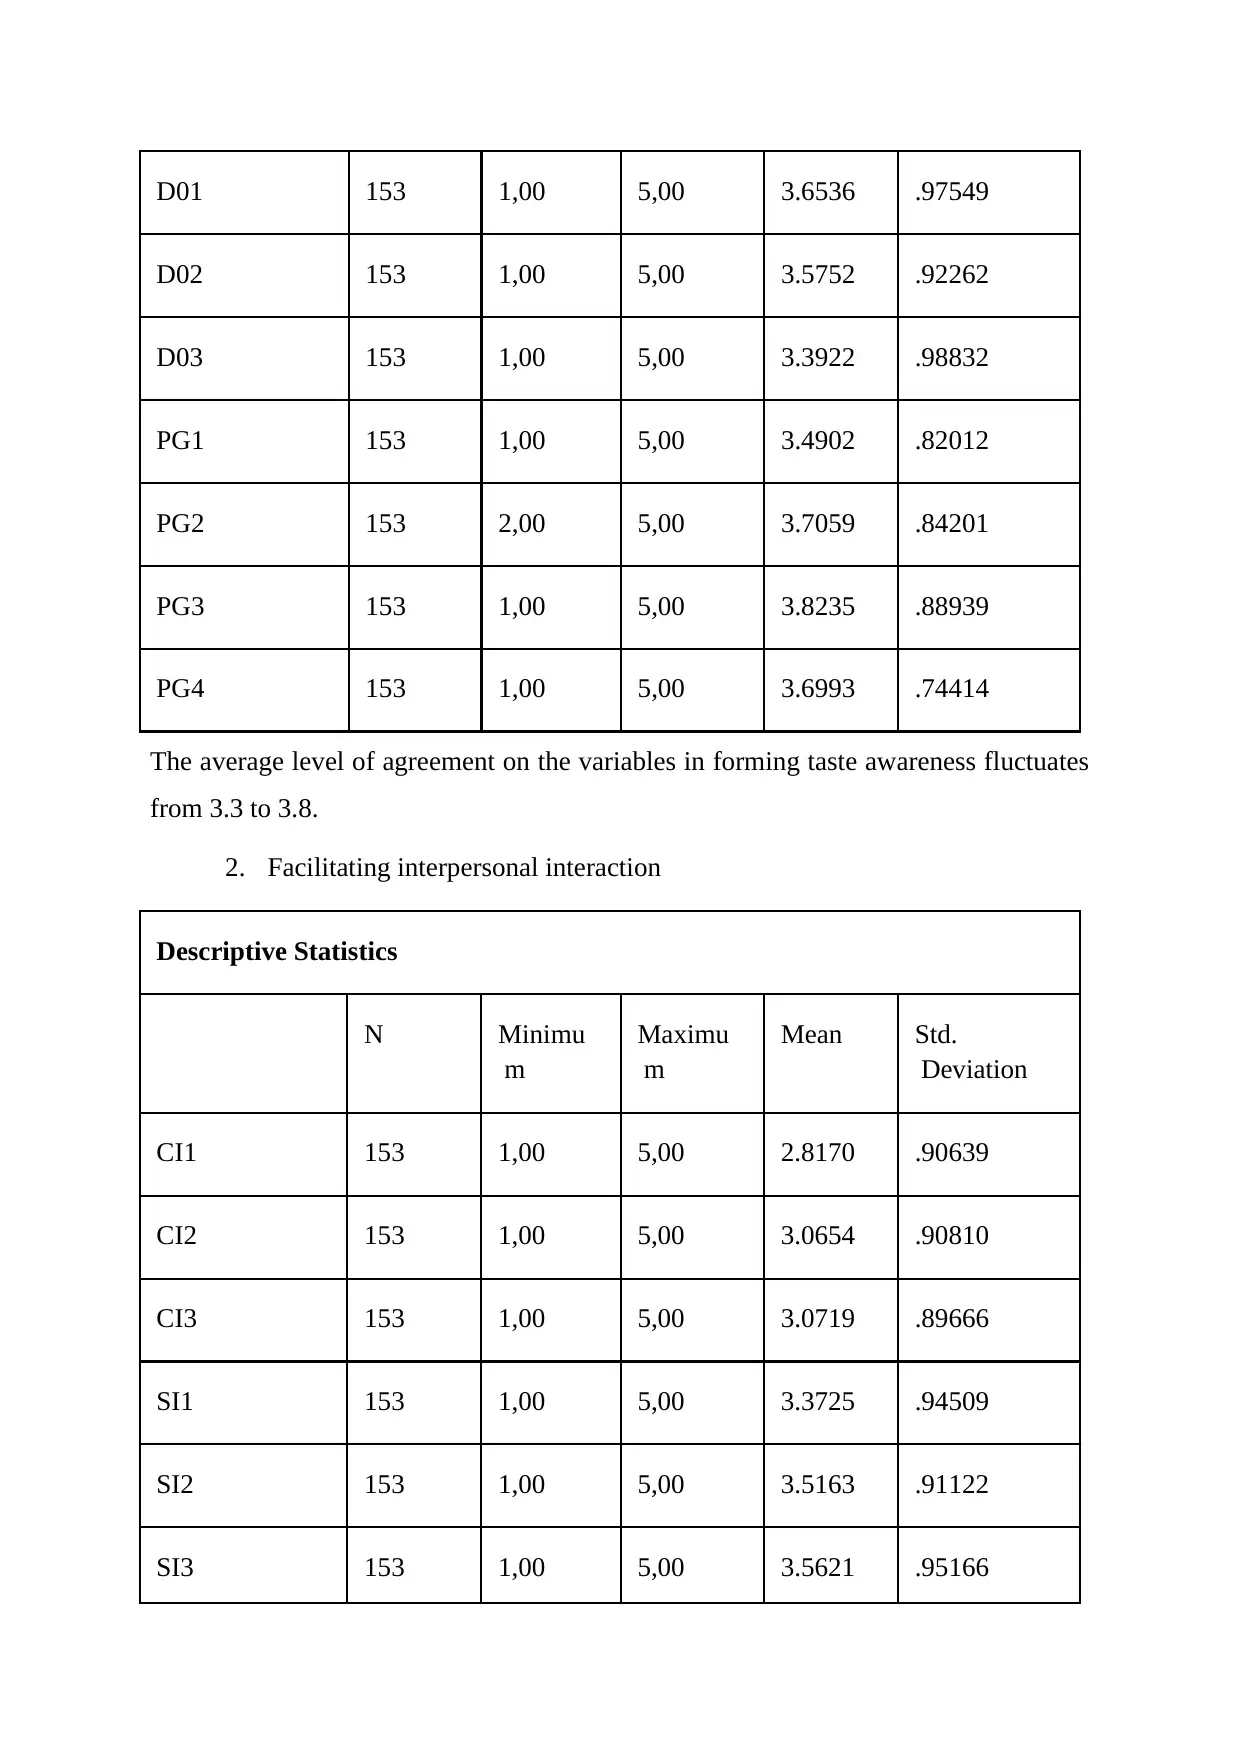
1. Forming taste awareness
Descriptive Statistics
N Minimu
m
Maximu
m
Mean Std.
Deviation
In this statistics, it shows that who food blogger is most popular in students. And the
result is “Ăn sập Sài Gòn” is the most popular food blogger with 21,9%. Followed by
Ninhtito, Hana.foodie and Nothingtoeat with 19,5%, 27,5% and 16,2 % respectively.
The remaining choices are Nofoodphobia, The Panda’s Flavor and other.
MÔ TẢ GIÁ TRỊ TRUNG BÌNH
Với thang đo likert 5 mức độ: 1 : rất không đồng ý và 5 : rất đồng ý, giá trị trung bình
của các biến trong các nhân tố được thể hiện như sau:
1. Inspiring taste desire
Descriptive Statistics
N Minimu
m
Maximu
m
Mean Std.
Deviation
I01 153 1,00 5,00 3.9085 .75533
I02 153 2,00 5,00 3.9608 .75987
I03 153 1,00 5,00 3.6144 .79575
The average level of agreement on the variables in inspiring taste desire fluctuates
from 3.6 to 3.9.
1. Forming taste awareness
Descriptive Statistics
N Minimu
m
Maximu
m
Mean Std.
Deviation
D01 153 1,00 5,00 3.6536 .97549
D02 153 1,00 5,00 3.5752 .92262
D03 153 1,00 5,00 3.3922 .98832
PG1 153 1,00 5,00 3.4902 .82012
PG2 153 2,00 5,00 3.7059 .84201
PG3 153 1,00 5,00 3.8235 .88939
PG4 153 1,00 5,00 3.6993 .74414
The average level of agreement on the variables in forming taste awareness fluctuates
from 3.3 to 3.8.
2. Facilitating interpersonal interaction
Descriptive Statistics
N Minimu
m
Maximu
m
Mean Std.
Deviation
CI1 153 1,00 5,00 2.8170 .90639
CI2 153 1,00 5,00 3.0654 .90810
CI3 153 1,00 5,00 3.0719 .89666
SI1 153 1,00 5,00 3.3725 .94509
SI2 153 1,00 5,00 3.5163 .91122
SI3 153 1,00 5,00 3.5621 .95166
Secure Best Marks with AI Grader
Need help grading? Try our AI Grader for instant feedback on your assignments.
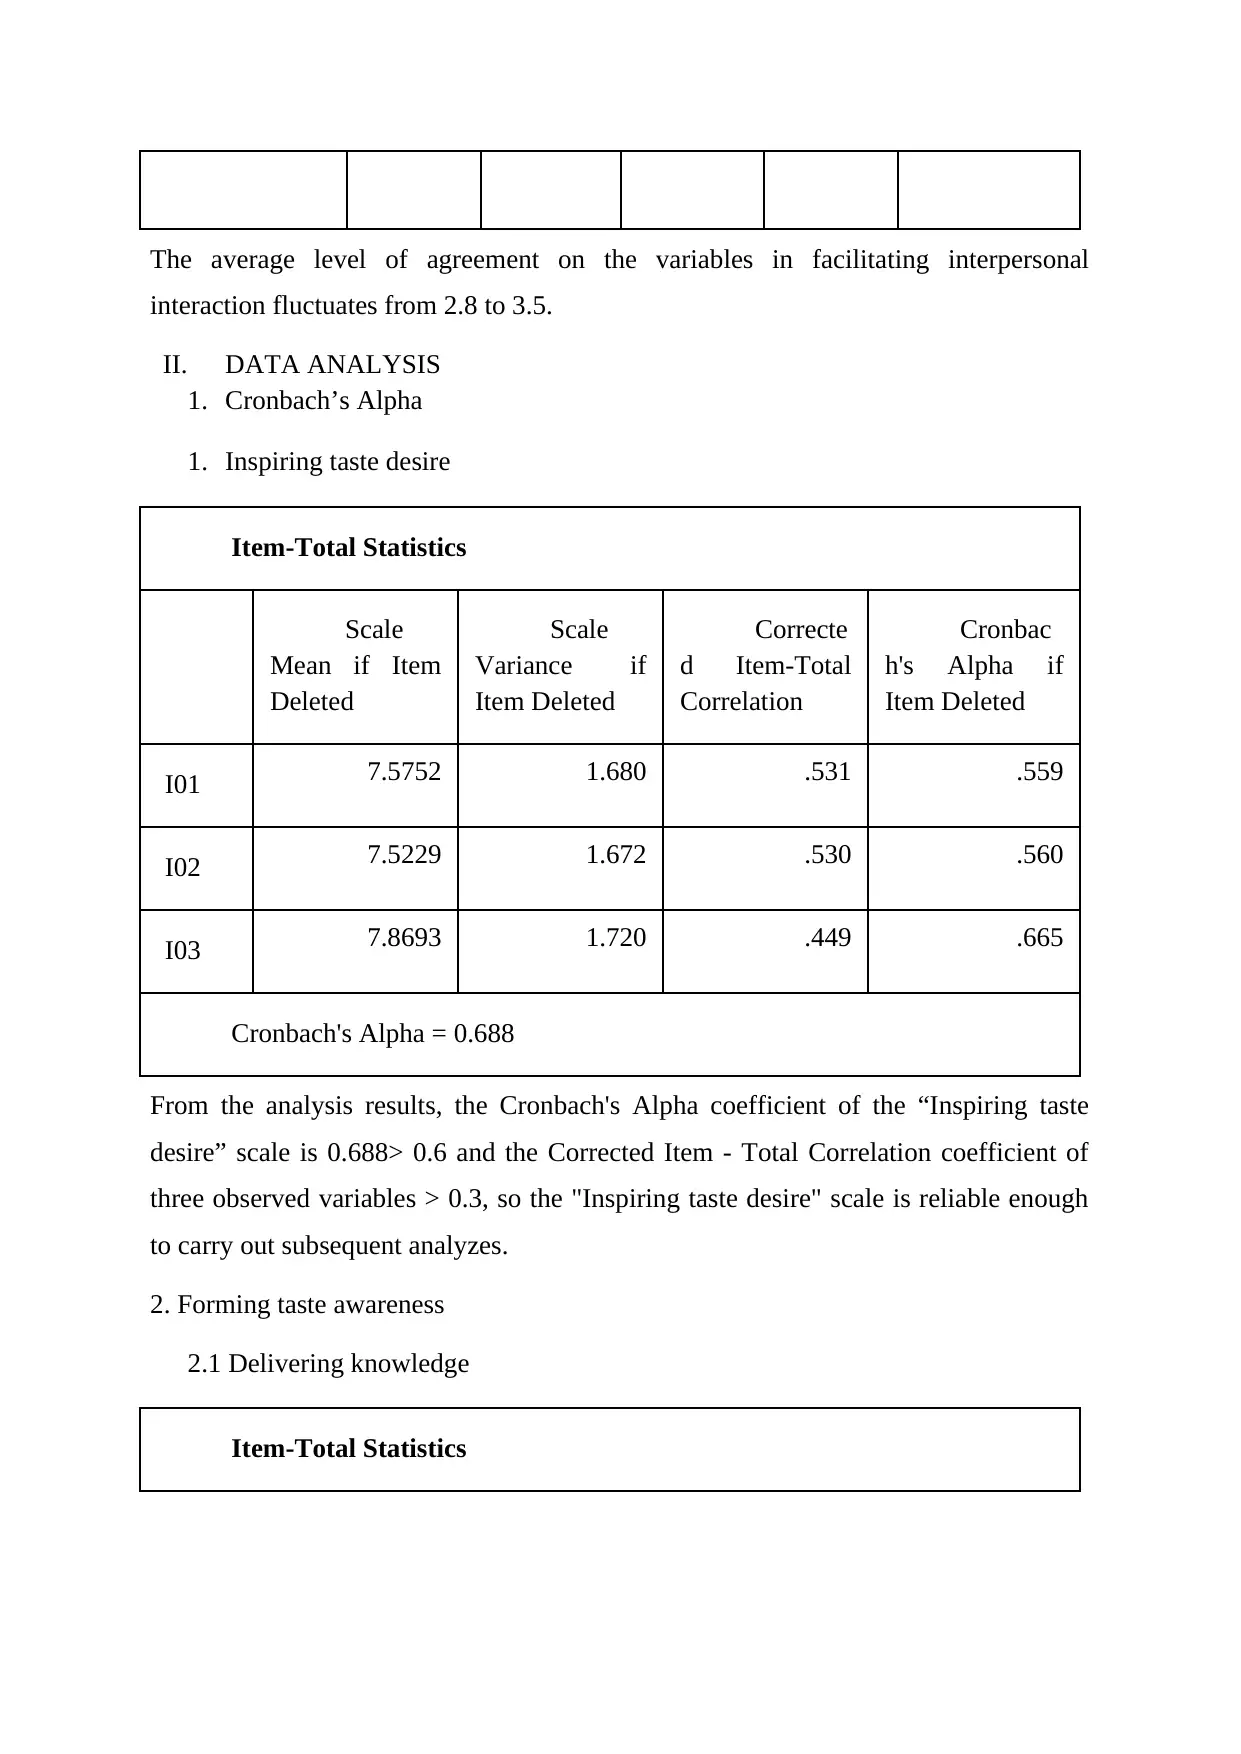
The average level of agreement on the variables in facilitating interpersonal
interaction fluctuates from 2.8 to 3.5.
II. DATA ANALYSIS
1. Cronbach’s Alpha
1. Inspiring taste desire
Item-Total Statistics
Scale
Mean if Item
Deleted
Scale
Variance if
Item Deleted
Correcte
d Item-Total
Correlation
Cronbac
h's Alpha if
Item Deleted
I01 7.5752 1.680 .531 .559
I02 7.5229 1.672 .530 .560
I03 7.8693 1.720 .449 .665
Cronbach's Alpha = 0.688
From the analysis results, the Cronbach's Alpha coefficient of the “Inspiring taste
desire” scale is 0.688> 0.6 and the Corrected Item - Total Correlation coefficient of
three observed variables > 0.3, so the "Inspiring taste desire" scale is reliable enough
to carry out subsequent analyzes.
2. Forming taste awareness
2.1 Delivering knowledge
Item-Total Statistics
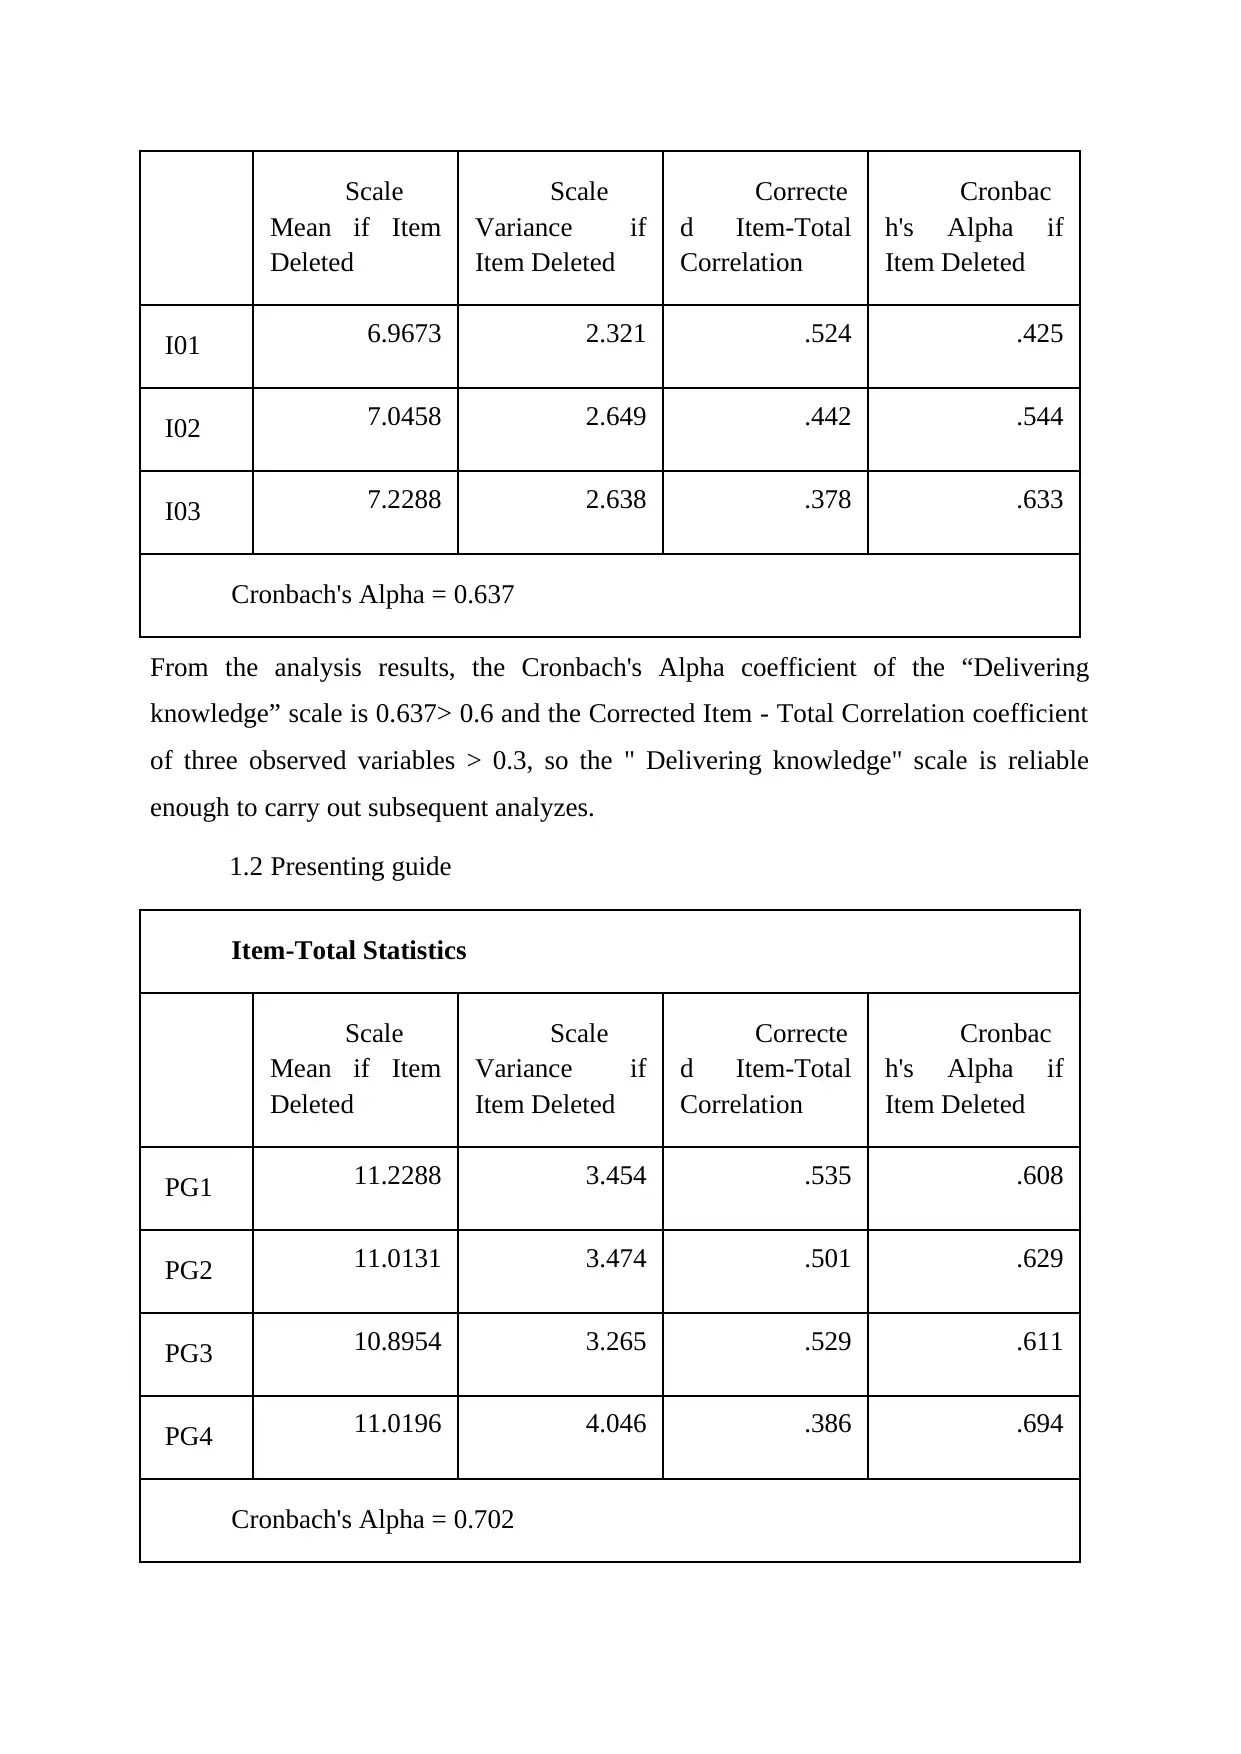
Scale
Mean if Item
Deleted
Scale
Variance if
Item Deleted
Correcte
d Item-Total
Correlation
Cronbac
h's Alpha if
Item Deleted
I01 6.9673 2.321 .524 .425
I02 7.0458 2.649 .442 .544
I03 7.2288 2.638 .378 .633
Cronbach's Alpha = 0.637
From the analysis results, the Cronbach's Alpha coefficient of the “Delivering
knowledge” scale is 0.637> 0.6 and the Corrected Item - Total Correlation coefficient
of three observed variables > 0.3, so the " Delivering knowledge" scale is reliable
enough to carry out subsequent analyzes.
1.2 Presenting guide
Item-Total Statistics
Scale
Mean if Item
Deleted
Scale
Variance if
Item Deleted
Correcte
d Item-Total
Correlation
Cronbac
h's Alpha if
Item Deleted
PG1 11.2288 3.454 .535 .608
PG2 11.0131 3.474 .501 .629
PG3 10.8954 3.265 .529 .611
PG4 11.0196 4.046 .386 .694
Cronbach's Alpha = 0.702
Mean if Item
Deleted
Scale
Variance if
Item Deleted
Correcte
d Item-Total
Correlation
Cronbac
h's Alpha if
Item Deleted
I01 6.9673 2.321 .524 .425
I02 7.0458 2.649 .442 .544
I03 7.2288 2.638 .378 .633
Cronbach's Alpha = 0.637
From the analysis results, the Cronbach's Alpha coefficient of the “Delivering
knowledge” scale is 0.637> 0.6 and the Corrected Item - Total Correlation coefficient
of three observed variables > 0.3, so the " Delivering knowledge" scale is reliable
enough to carry out subsequent analyzes.
1.2 Presenting guide
Item-Total Statistics
Scale
Mean if Item
Deleted
Scale
Variance if
Item Deleted
Correcte
d Item-Total
Correlation
Cronbac
h's Alpha if
Item Deleted
PG1 11.2288 3.454 .535 .608
PG2 11.0131 3.474 .501 .629
PG3 10.8954 3.265 .529 .611
PG4 11.0196 4.046 .386 .694
Cronbach's Alpha = 0.702
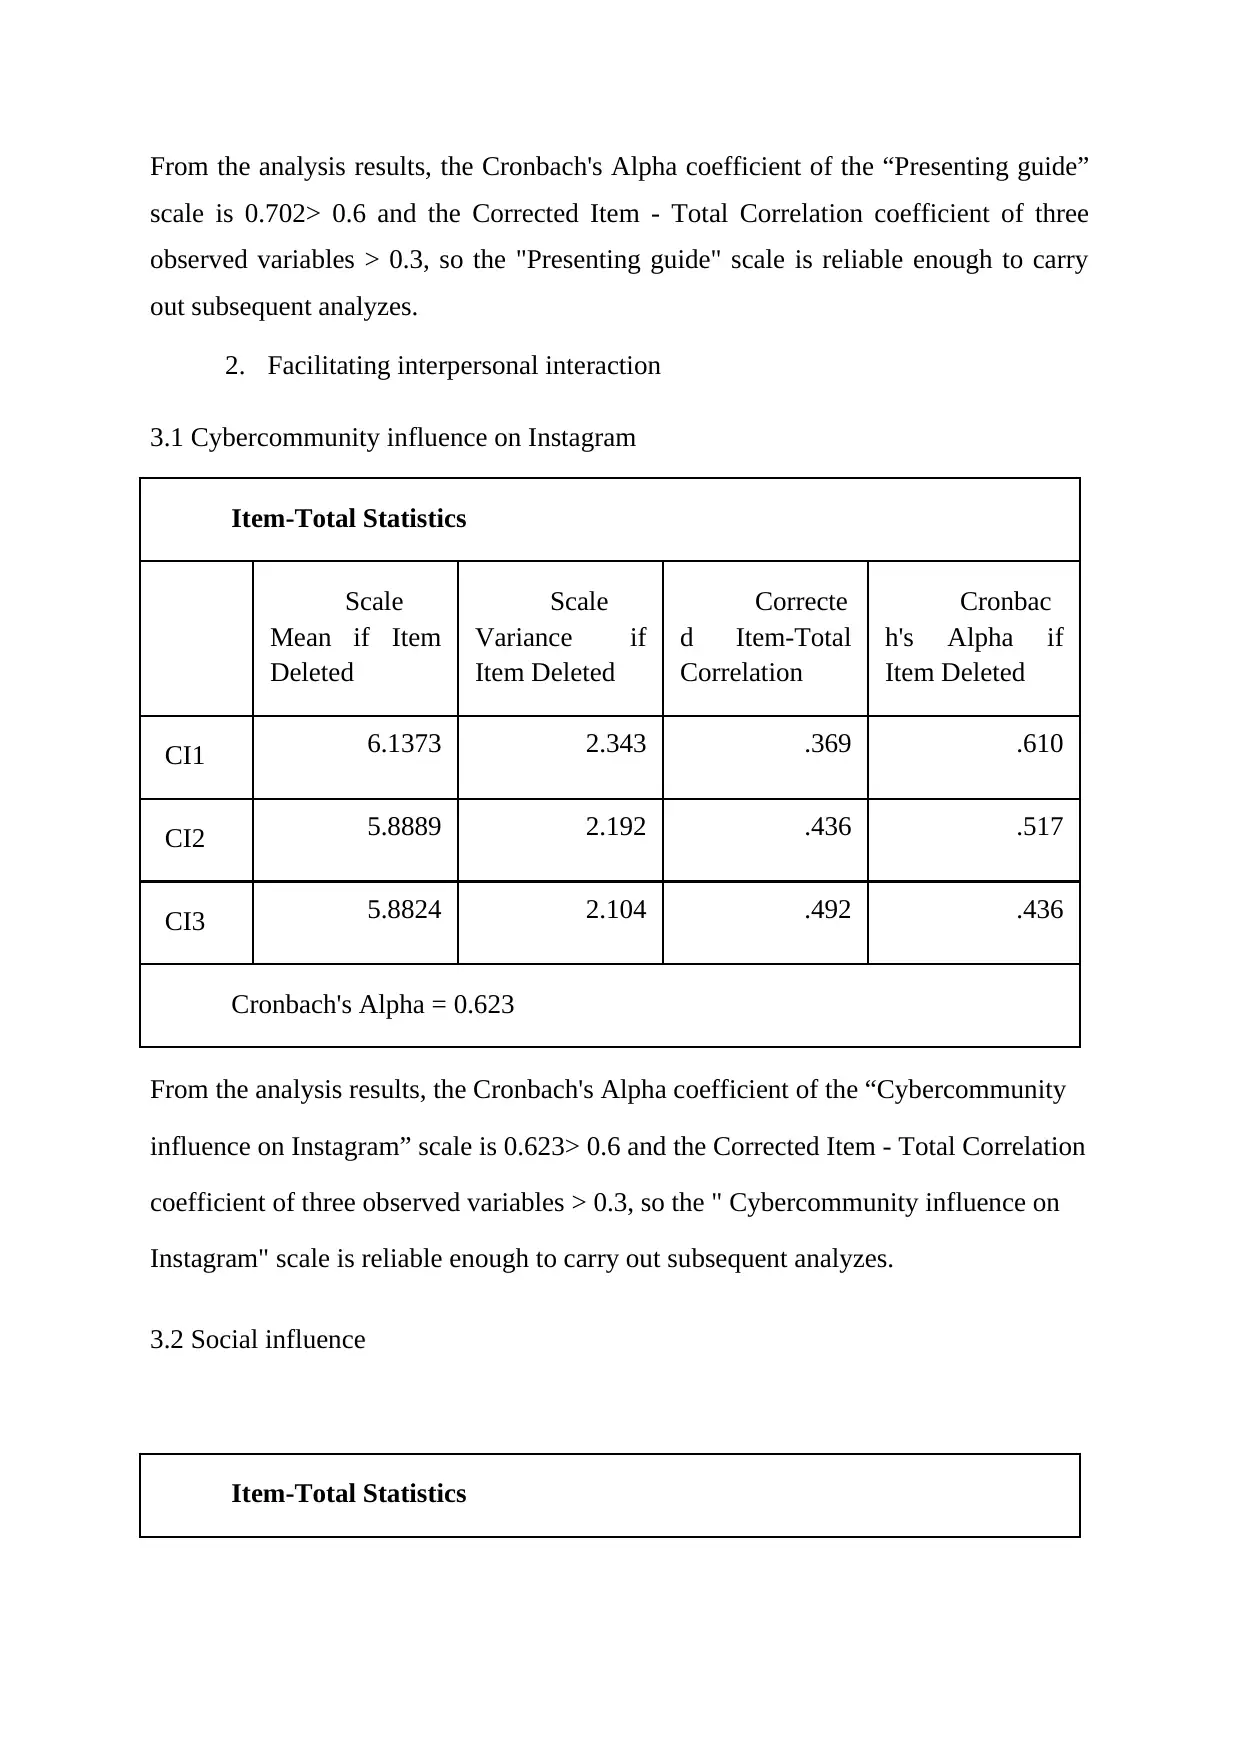
From the analysis results, the Cronbach's Alpha coefficient of the “Presenting guide”
scale is 0.702> 0.6 and the Corrected Item - Total Correlation coefficient of three
observed variables > 0.3, so the "Presenting guide" scale is reliable enough to carry
out subsequent analyzes.
2. Facilitating interpersonal interaction
3.1 Cybercommunity influence on Instagram
Item-Total Statistics
Scale
Mean if Item
Deleted
Scale
Variance if
Item Deleted
Correcte
d Item-Total
Correlation
Cronbac
h's Alpha if
Item Deleted
CI1 6.1373 2.343 .369 .610
CI2 5.8889 2.192 .436 .517
CI3 5.8824 2.104 .492 .436
Cronbach's Alpha = 0.623
From the analysis results, the Cronbach's Alpha coefficient of the “Cybercommunity
influence on Instagram” scale is 0.623> 0.6 and the Corrected Item - Total Correlation
coefficient of three observed variables > 0.3, so the " Cybercommunity influence on
Instagram" scale is reliable enough to carry out subsequent analyzes.
3.2 Social influence
Item-Total Statistics
Paraphrase This Document
Need a fresh take? Get an instant paraphrase of this document with our AI Paraphraser
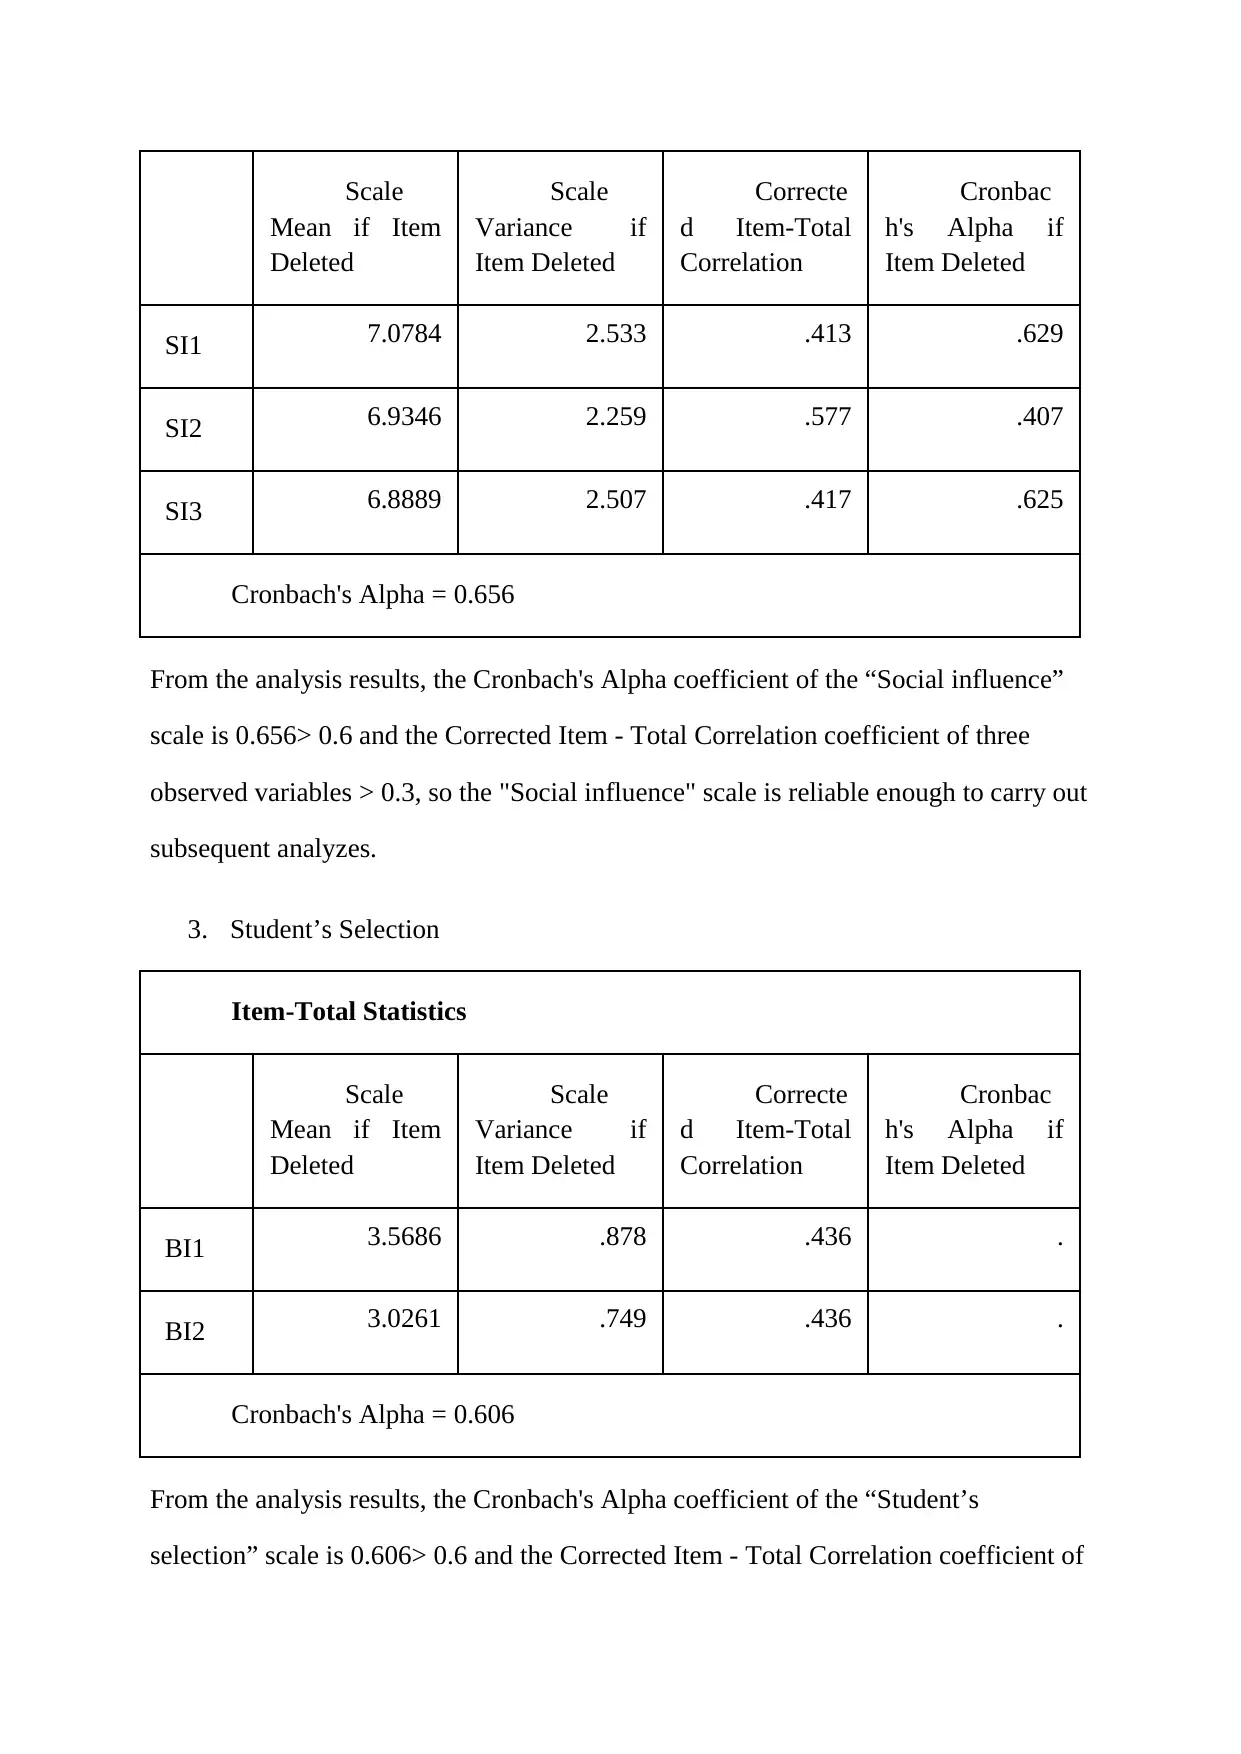
Scale
Mean if Item
Deleted
Scale
Variance if
Item Deleted
Correcte
d Item-Total
Correlation
Cronbac
h's Alpha if
Item Deleted
SI1 7.0784 2.533 .413 .629
SI2 6.9346 2.259 .577 .407
SI3 6.8889 2.507 .417 .625
Cronbach's Alpha = 0.656
From the analysis results, the Cronbach's Alpha coefficient of the “Social influence”
scale is 0.656> 0.6 and the Corrected Item - Total Correlation coefficient of three
observed variables > 0.3, so the "Social influence" scale is reliable enough to carry out
subsequent analyzes.
3. Student’s Selection
Item-Total Statistics
Scale
Mean if Item
Deleted
Scale
Variance if
Item Deleted
Correcte
d Item-Total
Correlation
Cronbac
h's Alpha if
Item Deleted
BI1 3.5686 .878 .436 .
BI2 3.0261 .749 .436 .
Cronbach's Alpha = 0.606
From the analysis results, the Cronbach's Alpha coefficient of the “Student’s
selection” scale is 0.606> 0.6 and the Corrected Item - Total Correlation coefficient of
Mean if Item
Deleted
Scale
Variance if
Item Deleted
Correcte
d Item-Total
Correlation
Cronbac
h's Alpha if
Item Deleted
SI1 7.0784 2.533 .413 .629
SI2 6.9346 2.259 .577 .407
SI3 6.8889 2.507 .417 .625
Cronbach's Alpha = 0.656
From the analysis results, the Cronbach's Alpha coefficient of the “Social influence”
scale is 0.656> 0.6 and the Corrected Item - Total Correlation coefficient of three
observed variables > 0.3, so the "Social influence" scale is reliable enough to carry out
subsequent analyzes.
3. Student’s Selection
Item-Total Statistics
Scale
Mean if Item
Deleted
Scale
Variance if
Item Deleted
Correcte
d Item-Total
Correlation
Cronbac
h's Alpha if
Item Deleted
BI1 3.5686 .878 .436 .
BI2 3.0261 .749 .436 .
Cronbach's Alpha = 0.606
From the analysis results, the Cronbach's Alpha coefficient of the “Student’s
selection” scale is 0.606> 0.6 and the Corrected Item - Total Correlation coefficient of
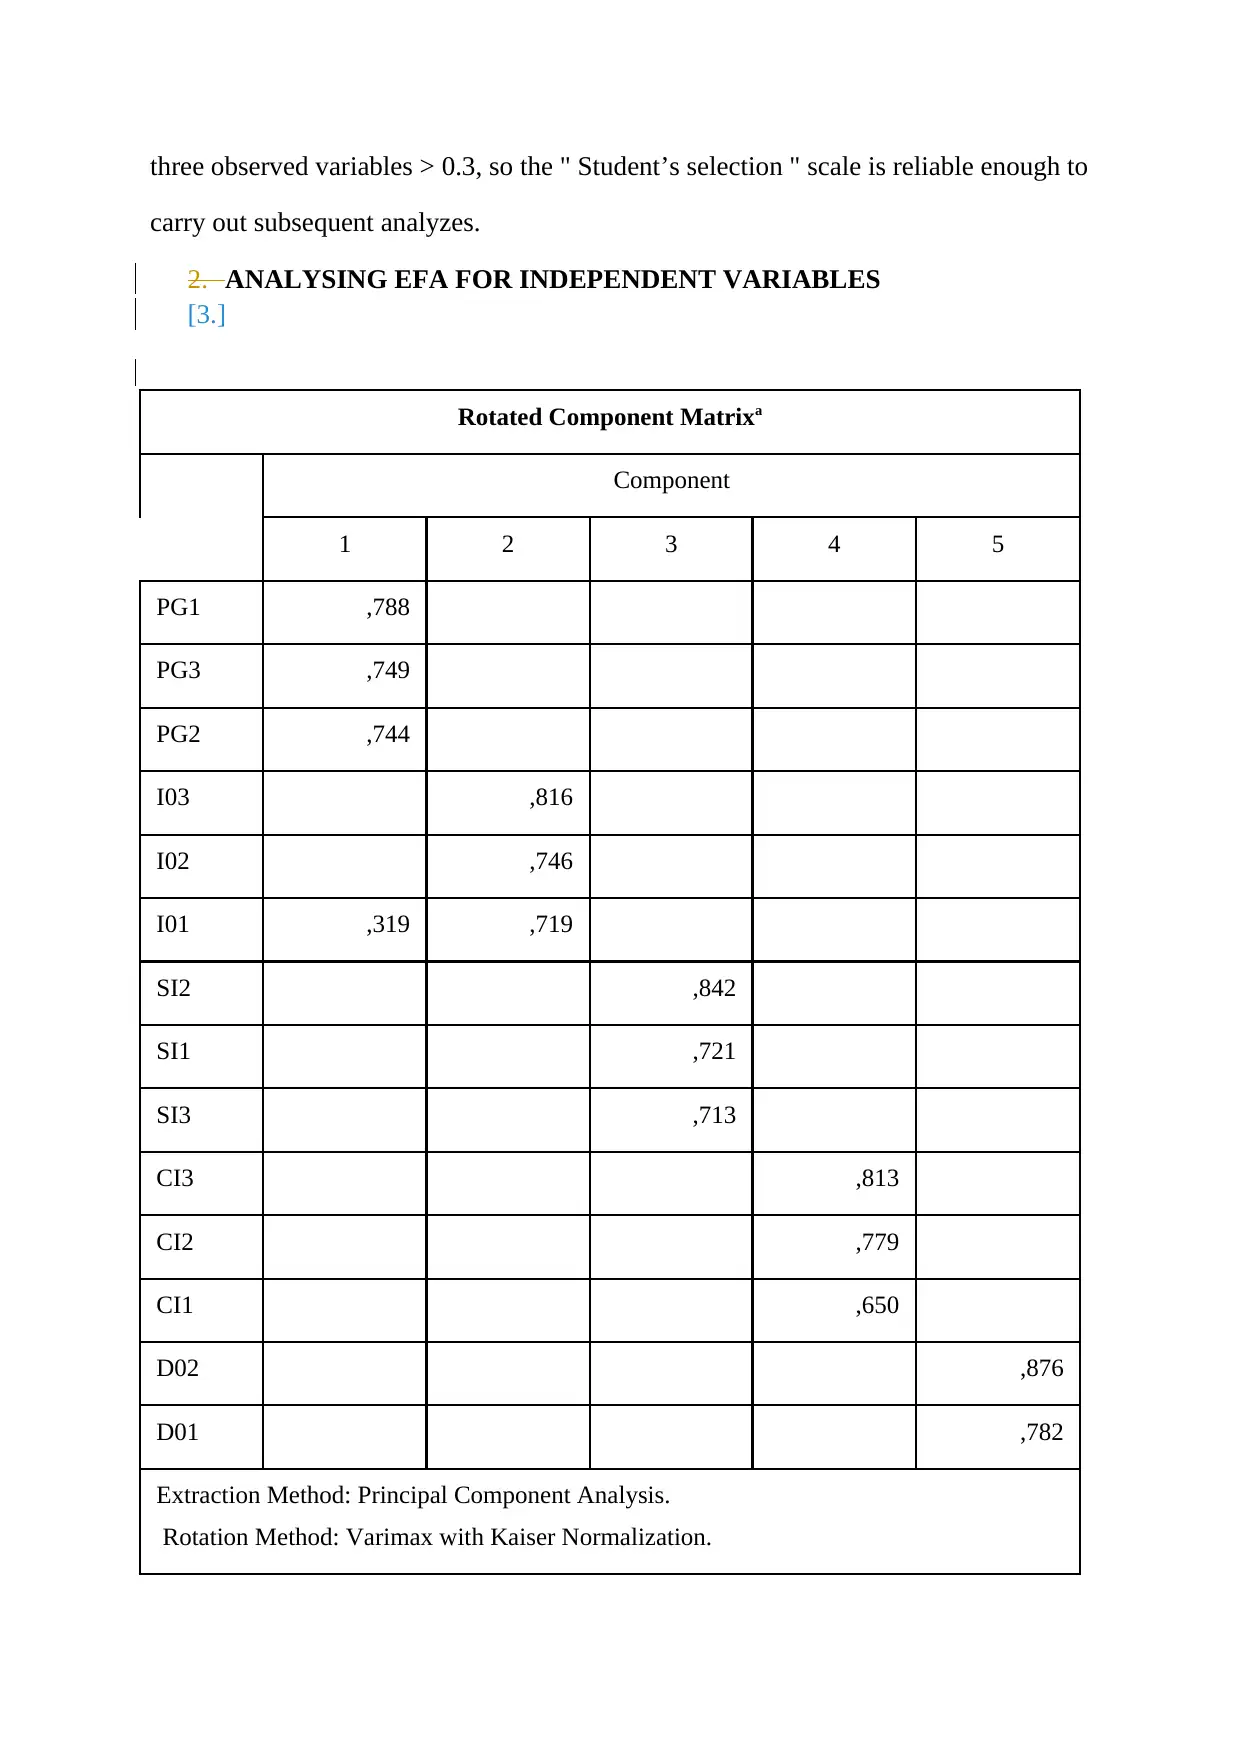
three observed variables > 0.3, so the " Student’s selection " scale is reliable enough to
carry out subsequent analyzes.
2. ANALYSING EFA FOR INDEPENDENT VARIABLES
[3.]
Rotated Component Matrixa
Component
1 2 3 4 5
PG1 ,788
PG3 ,749
PG2 ,744
I03 ,816
I02 ,746
I01 ,319 ,719
SI2 ,842
SI1 ,721
SI3 ,713
CI3 ,813
CI2 ,779
CI1 ,650
D02 ,876
D01 ,782
Extraction Method: Principal Component Analysis.
Rotation Method: Varimax with Kaiser Normalization.
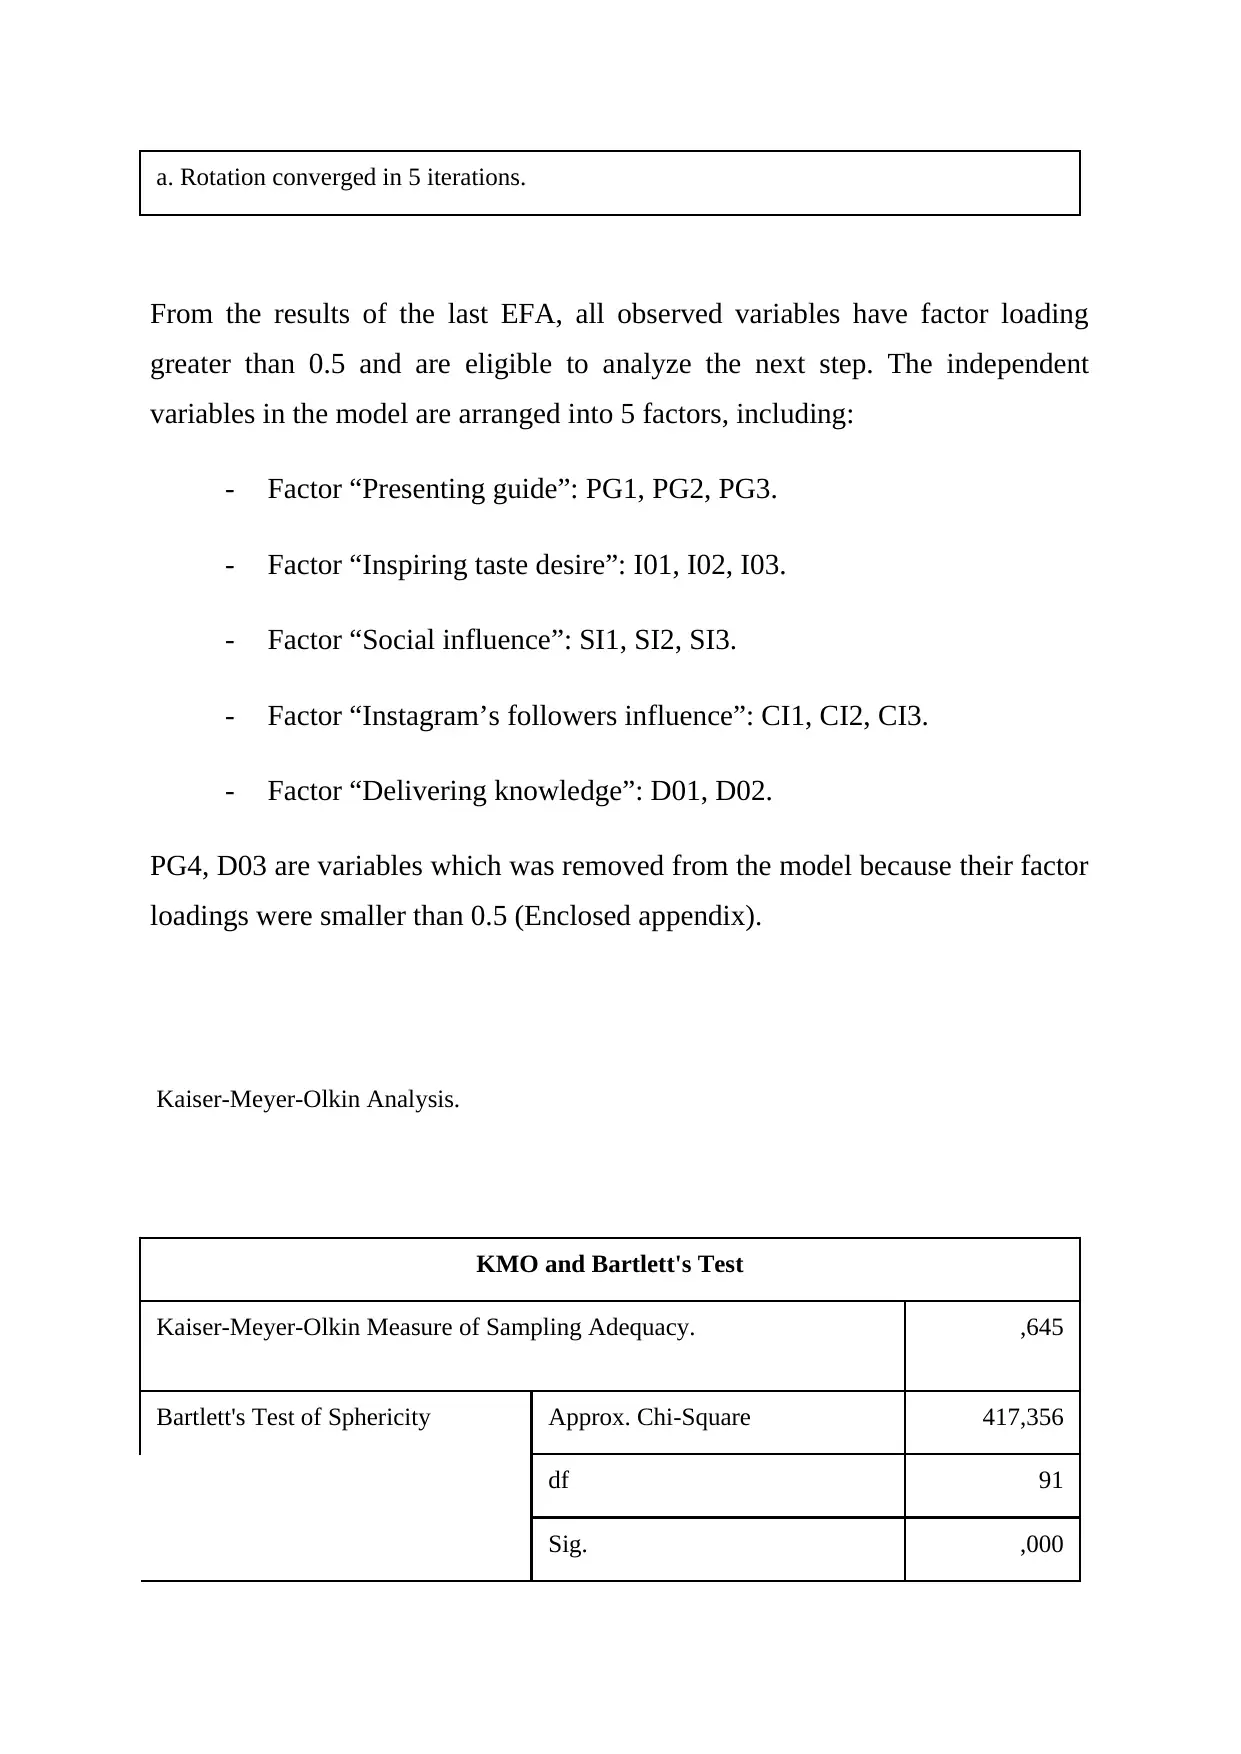
a. Rotation converged in 5 iterations.
From the results of the last EFA, all observed variables have factor loading
greater than 0.5 and are eligible to analyze the next step. The independent
variables in the model are arranged into 5 factors, including:
- Factor “Presenting guide”: PG1, PG2, PG3.
- Factor “Inspiring taste desire”: I01, I02, I03.
- Factor “Social influence”: SI1, SI2, SI3.
- Factor “Instagram’s followers influence”: CI1, CI2, CI3.
- Factor “Delivering knowledge”: D01, D02.
PG4, D03 are variables which was removed from the model because their factor
loadings were smaller than 0.5 (Enclosed appendix).
Kaiser-Meyer-Olkin Analysis.
KMO and Bartlett's Test
Kaiser-Meyer-Olkin Measure of Sampling Adequacy. ,645
Bartlett's Test of Sphericity Approx. Chi-Square 417,356
df 91
Sig. ,000
Secure Best Marks with AI Grader
Need help grading? Try our AI Grader for instant feedback on your assignments.
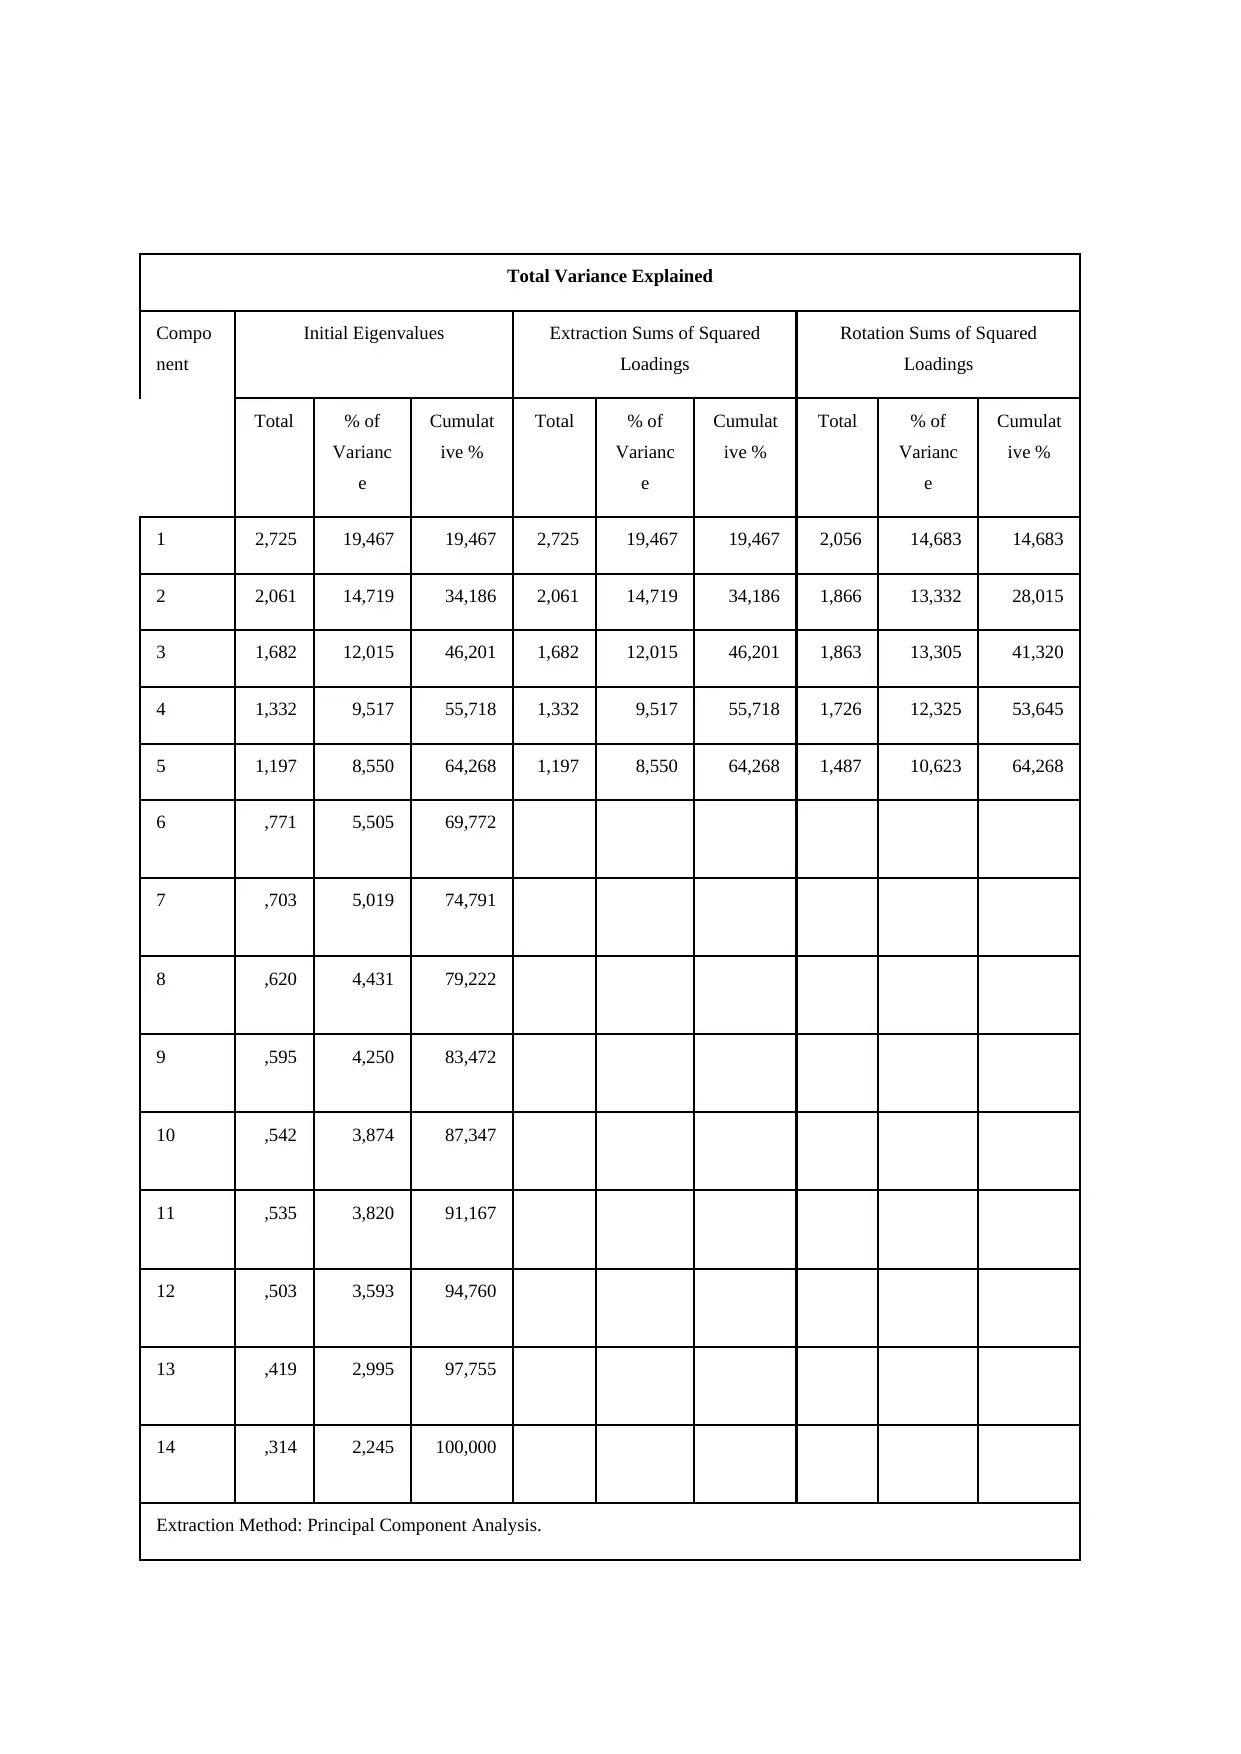
Total Variance Explained
Compo
nent
Initial Eigenvalues Extraction Sums of Squared
Loadings
Rotation Sums of Squared
Loadings
Total % of
Varianc
e
Cumulat
ive %
Total % of
Varianc
e
Cumulat
ive %
Total % of
Varianc
e
Cumulat
ive %
1 2,725 19,467 19,467 2,725 19,467 19,467 2,056 14,683 14,683
2 2,061 14,719 34,186 2,061 14,719 34,186 1,866 13,332 28,015
3 1,682 12,015 46,201 1,682 12,015 46,201 1,863 13,305 41,320
4 1,332 9,517 55,718 1,332 9,517 55,718 1,726 12,325 53,645
5 1,197 8,550 64,268 1,197 8,550 64,268 1,487 10,623 64,268
6 ,771 5,505 69,772
7 ,703 5,019 74,791
8 ,620 4,431 79,222
9 ,595 4,250 83,472
10 ,542 3,874 87,347
11 ,535 3,820 91,167
12 ,503 3,593 94,760
13 ,419 2,995 97,755
14 ,314 2,245 100,000
Extraction Method: Principal Component Analysis.
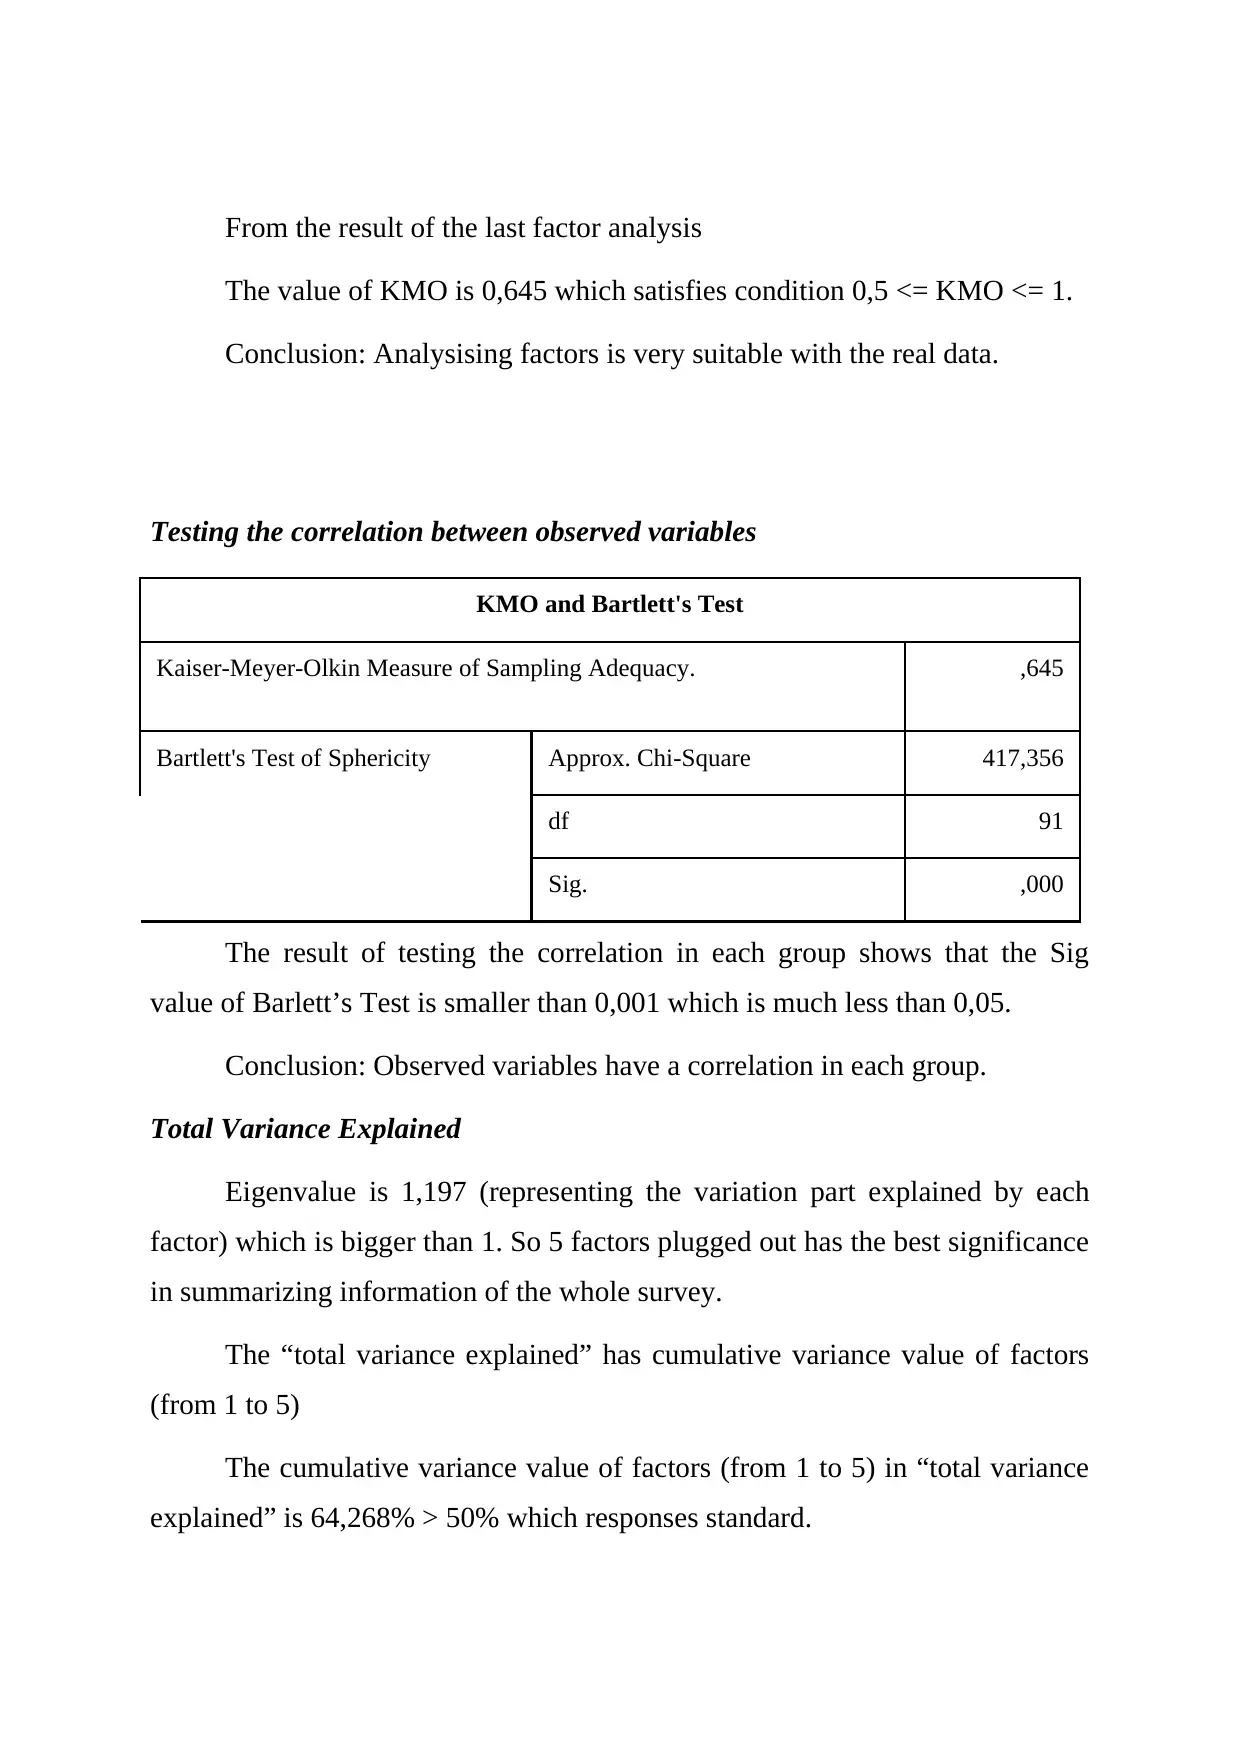
From the result of the last factor analysis
The value of KMO is 0,645 which satisfies condition 0,5 <= KMO <= 1.
Conclusion: Analysising factors is very suitable with the real data.
Testing the correlation between observed variables
KMO and Bartlett's Test
Kaiser-Meyer-Olkin Measure of Sampling Adequacy. ,645
Bartlett's Test of Sphericity Approx. Chi-Square 417,356
df 91
Sig. ,000
The result of testing the correlation in each group shows that the Sig
value of Barlett’s Test is smaller than 0,001 which is much less than 0,05.
Conclusion: Observed variables have a correlation in each group.
Total Variance Explained
Eigenvalue is 1,197 (representing the variation part explained by each
factor) which is bigger than 1. So 5 factors plugged out has the best significance
in summarizing information of the whole survey.
The “total variance explained” has cumulative variance value of factors
(from 1 to 5)
The cumulative variance value of factors (from 1 to 5) in “total variance
explained” is 64,268% > 50% which responses standard.
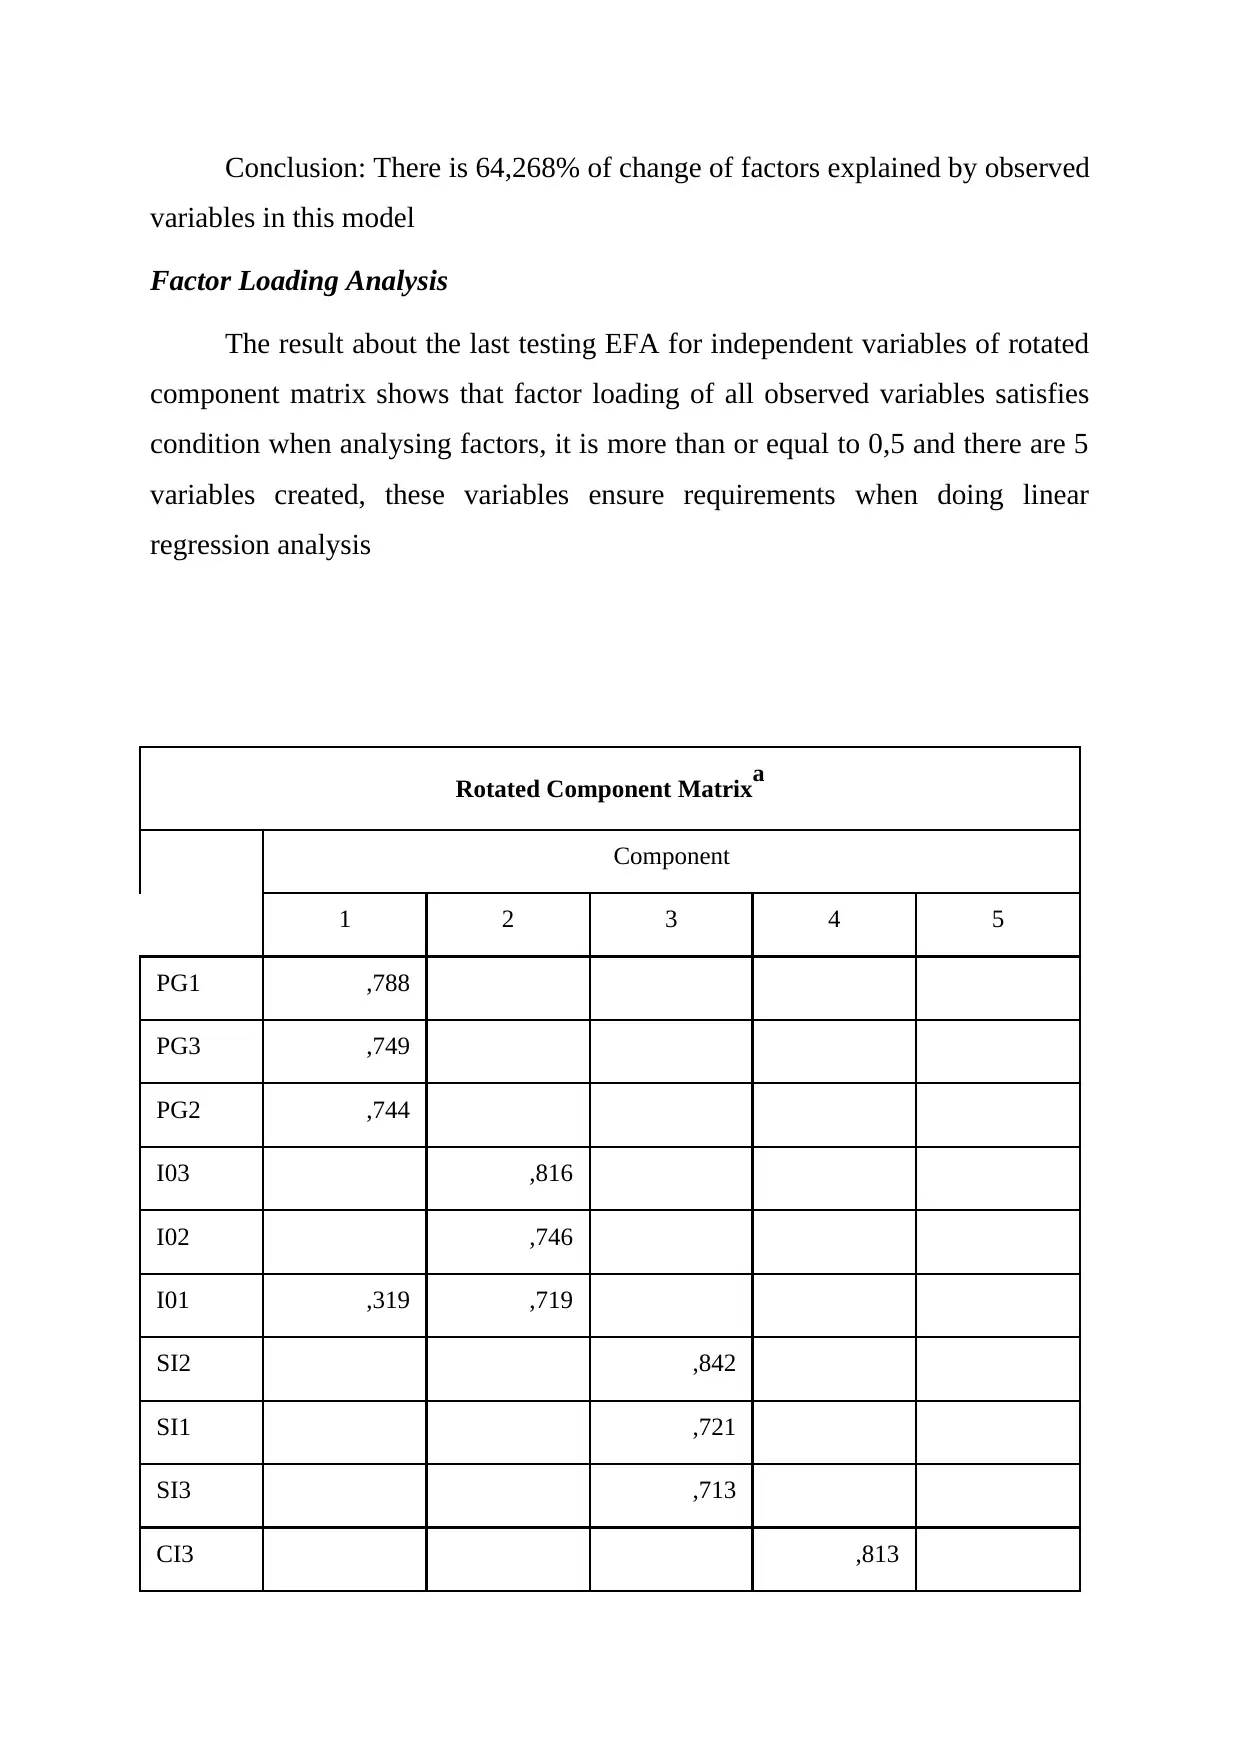
Conclusion: There is 64,268% of change of factors explained by observed
variables in this model
Factor Loading Analysis
The result about the last testing EFA for independent variables of rotated
component matrix shows that factor loading of all observed variables satisfies
condition when analysing factors, it is more than or equal to 0,5 and there are 5
variables created, these variables ensure requirements when doing linear
regression analysis
Rotated Component Matrixa
Component
1 2 3 4 5
PG1 ,788
PG3 ,749
PG2 ,744
I03 ,816
I02 ,746
I01 ,319 ,719
SI2 ,842
SI1 ,721
SI3 ,713
CI3 ,813
Paraphrase This Document
Need a fresh take? Get an instant paraphrase of this document with our AI Paraphraser
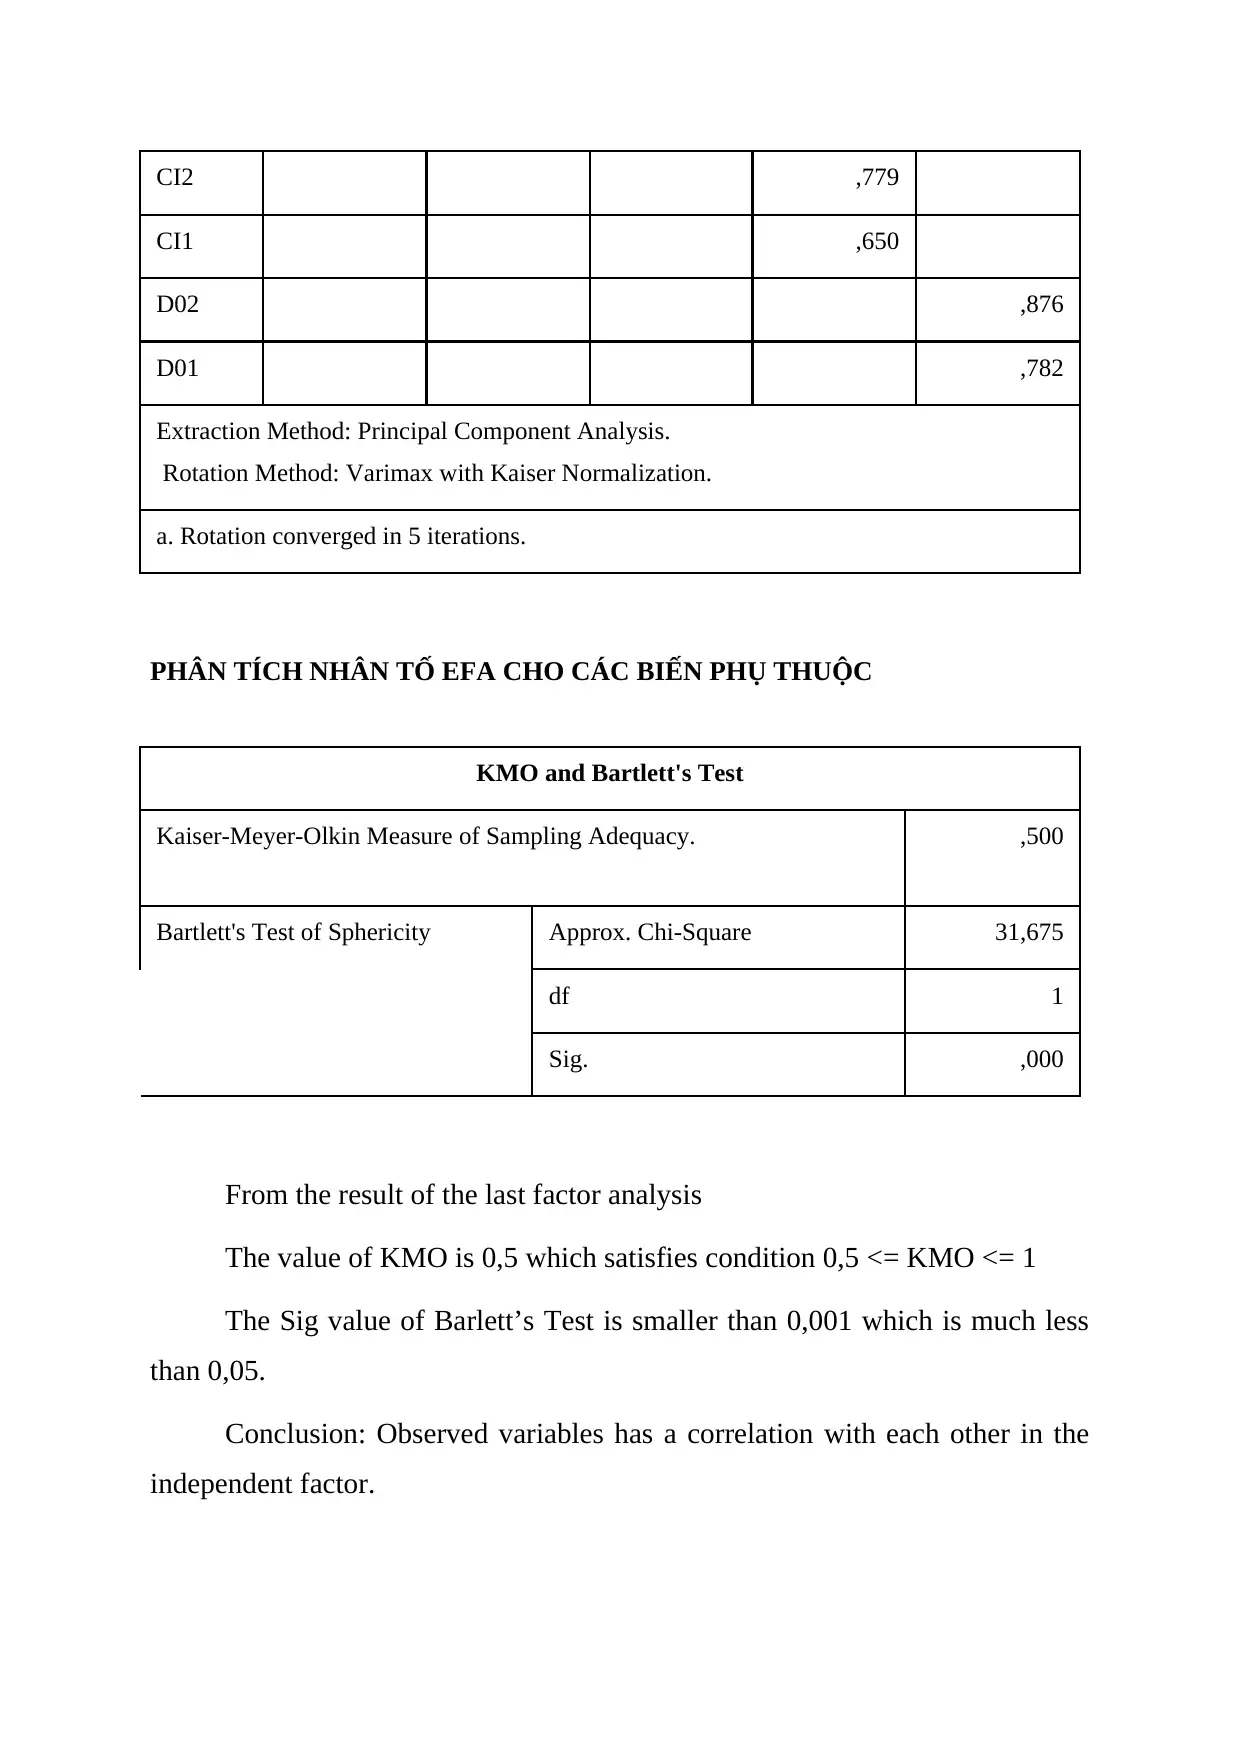
CI2 ,779
CI1 ,650
D02 ,876
D01 ,782
Extraction Method: Principal Component Analysis.
Rotation Method: Varimax with Kaiser Normalization.
a. Rotation converged in 5 iterations.
PHÂN TÍCH NHÂN TỐ EFA CHO CÁC BIẾN PHỤ THUỘC
KMO and Bartlett's Test
Kaiser-Meyer-Olkin Measure of Sampling Adequacy. ,500
Bartlett's Test of Sphericity Approx. Chi-Square 31,675
df 1
Sig. ,000
From the result of the last factor analysis
The value of KMO is 0,5 which satisfies condition 0,5 <= KMO <= 1
The Sig value of Barlett’s Test is smaller than 0,001 which is much less
than 0,05.
Conclusion: Observed variables has a correlation with each other in the
independent factor.
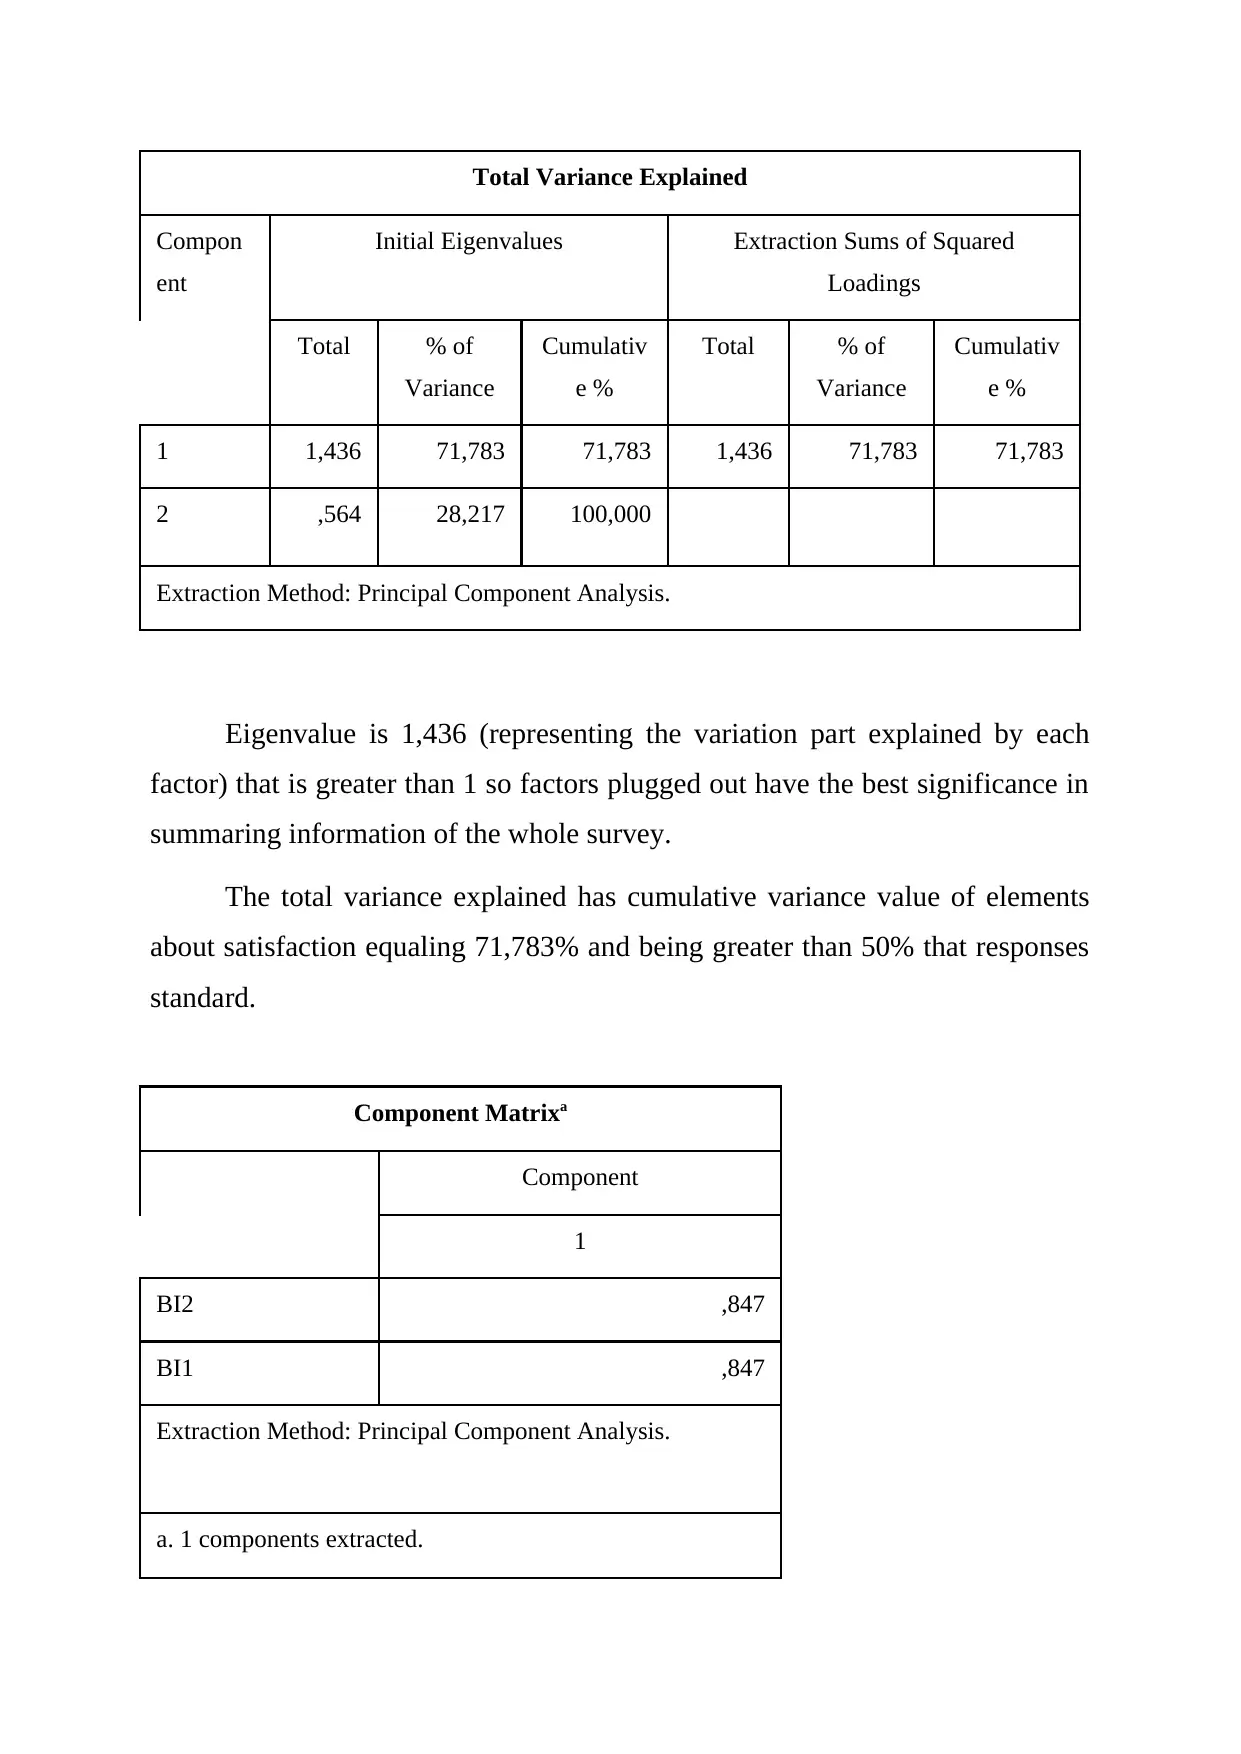
Total Variance Explained
Compon
ent
Initial Eigenvalues Extraction Sums of Squared
Loadings
Total % of
Variance
Cumulativ
e %
Total % of
Variance
Cumulativ
e %
1 1,436 71,783 71,783 1,436 71,783 71,783
2 ,564 28,217 100,000
Extraction Method: Principal Component Analysis.
Eigenvalue is 1,436 (representing the variation part explained by each
factor) that is greater than 1 so factors plugged out have the best significance in
summaring information of the whole survey.
The total variance explained has cumulative variance value of elements
about satisfaction equaling 71,783% and being greater than 50% that responses
standard.
Component Matrixa
Component
1
BI2 ,847
BI1 ,847
Extraction Method: Principal Component Analysis.
a. 1 components extracted.
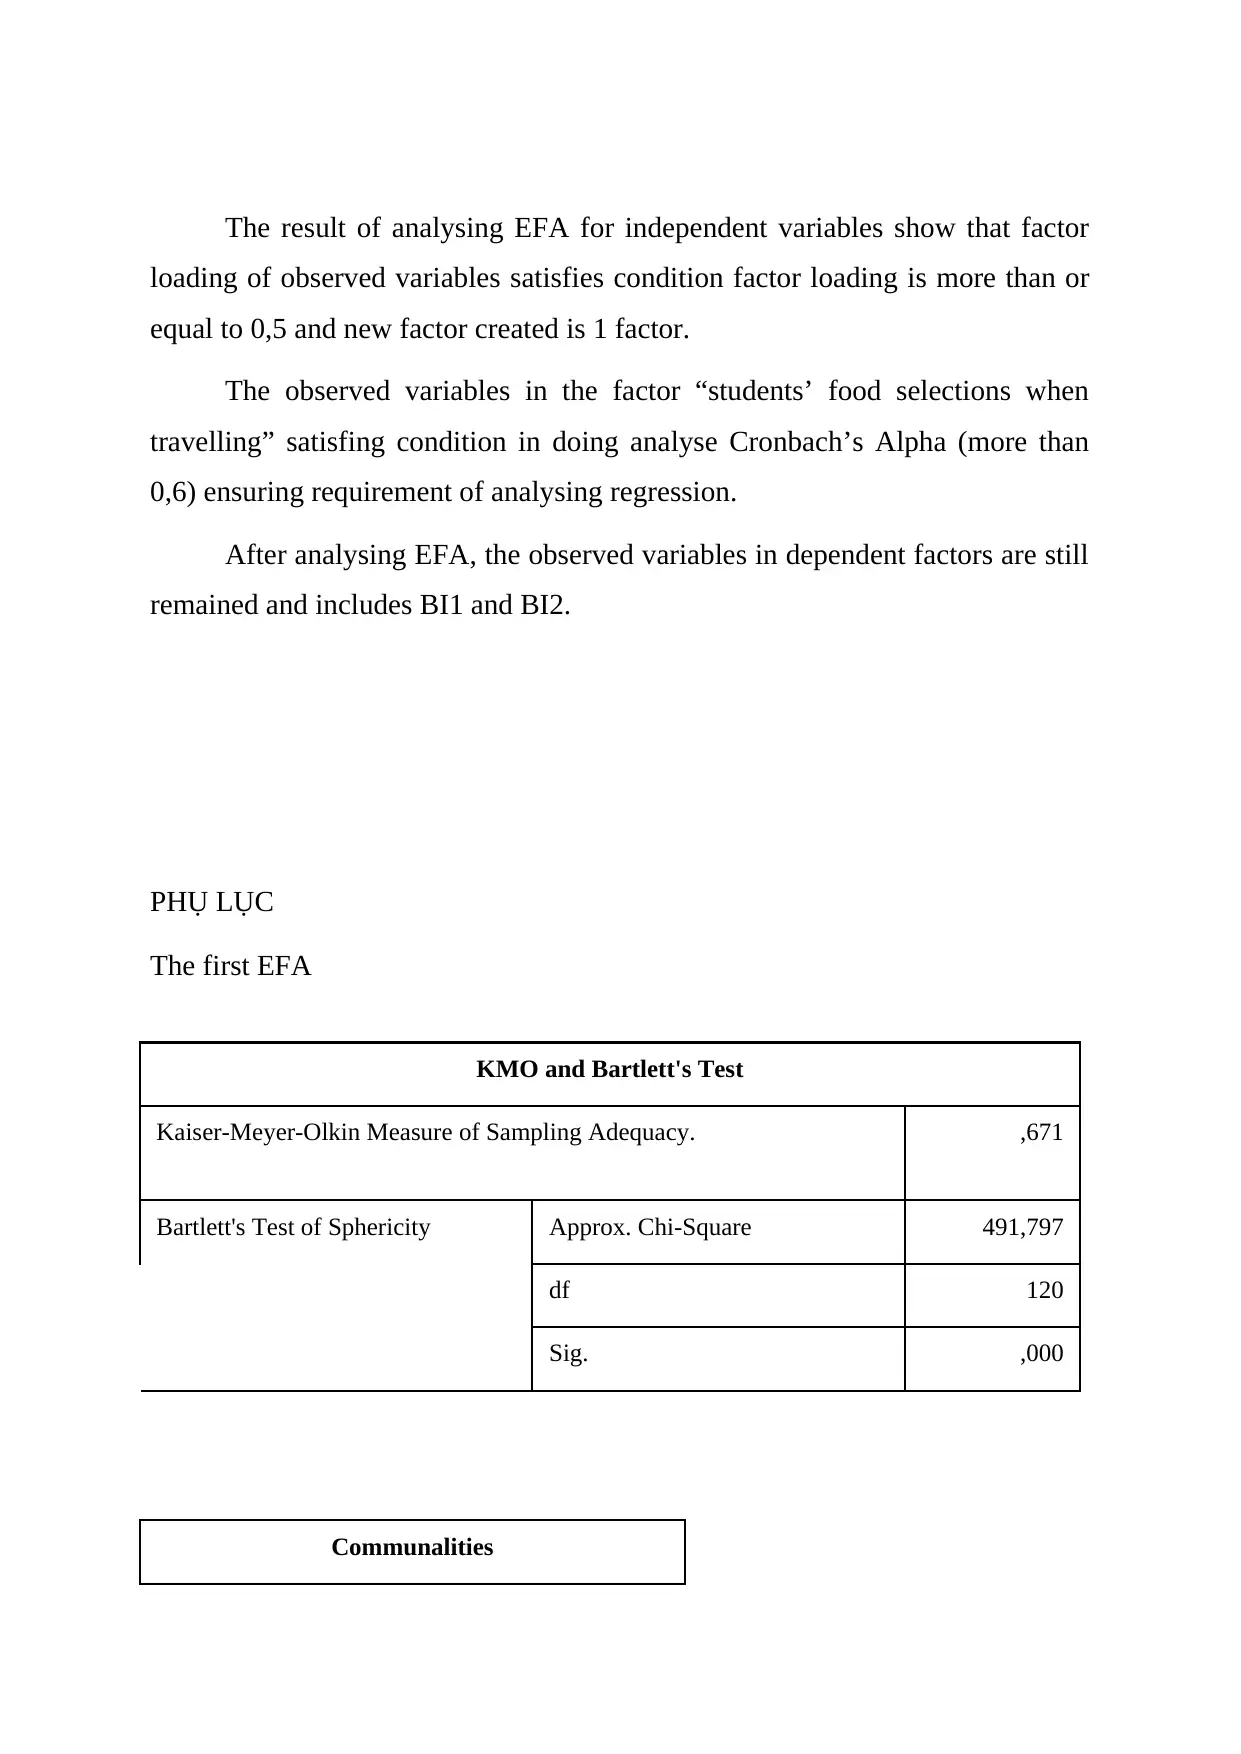
The result of analysing EFA for independent variables show that factor
loading of observed variables satisfies condition factor loading is more than or
equal to 0,5 and new factor created is 1 factor.
The observed variables in the factor “students’ food selections when
travelling” satisfing condition in doing analyse Cronbach’s Alpha (more than
0,6) ensuring requirement of analysing regression.
After analysing EFA, the observed variables in dependent factors are still
remained and includes BI1 and BI2.
PHỤ LỤC
The first EFA
KMO and Bartlett's Test
Kaiser-Meyer-Olkin Measure of Sampling Adequacy. ,671
Bartlett's Test of Sphericity Approx. Chi-Square 491,797
df 120
Sig. ,000
Communalities
Secure Best Marks with AI Grader
Need help grading? Try our AI Grader for instant feedback on your assignments.
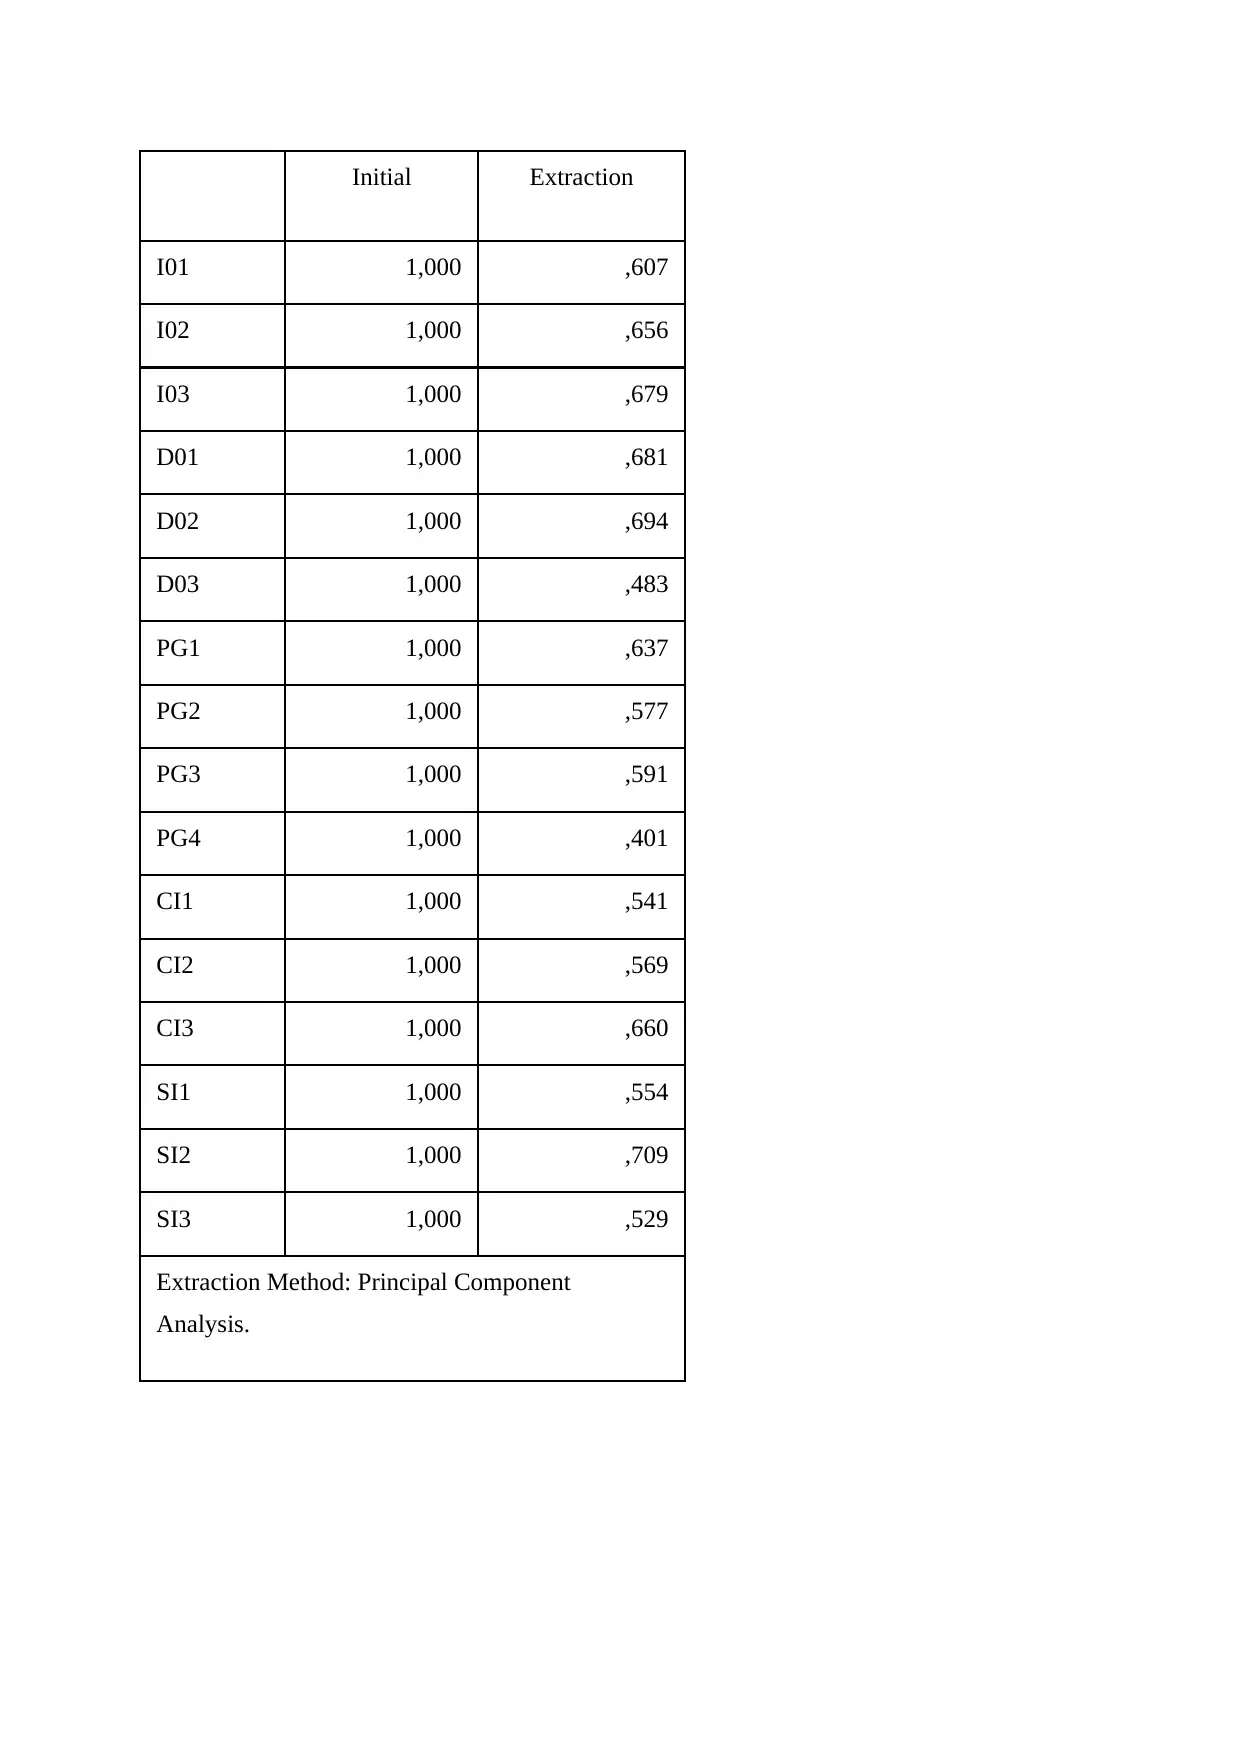
Initial Extraction
I01 1,000 ,607
I02 1,000 ,656
I03 1,000 ,679
D01 1,000 ,681
D02 1,000 ,694
D03 1,000 ,483
PG1 1,000 ,637
PG2 1,000 ,577
PG3 1,000 ,591
PG4 1,000 ,401
CI1 1,000 ,541
CI2 1,000 ,569
CI3 1,000 ,660
SI1 1,000 ,554
SI2 1,000 ,709
SI3 1,000 ,529
Extraction Method: Principal Component
Analysis.
I01 1,000 ,607
I02 1,000 ,656
I03 1,000 ,679
D01 1,000 ,681
D02 1,000 ,694
D03 1,000 ,483
PG1 1,000 ,637
PG2 1,000 ,577
PG3 1,000 ,591
PG4 1,000 ,401
CI1 1,000 ,541
CI2 1,000 ,569
CI3 1,000 ,660
SI1 1,000 ,554
SI2 1,000 ,709
SI3 1,000 ,529
Extraction Method: Principal Component
Analysis.
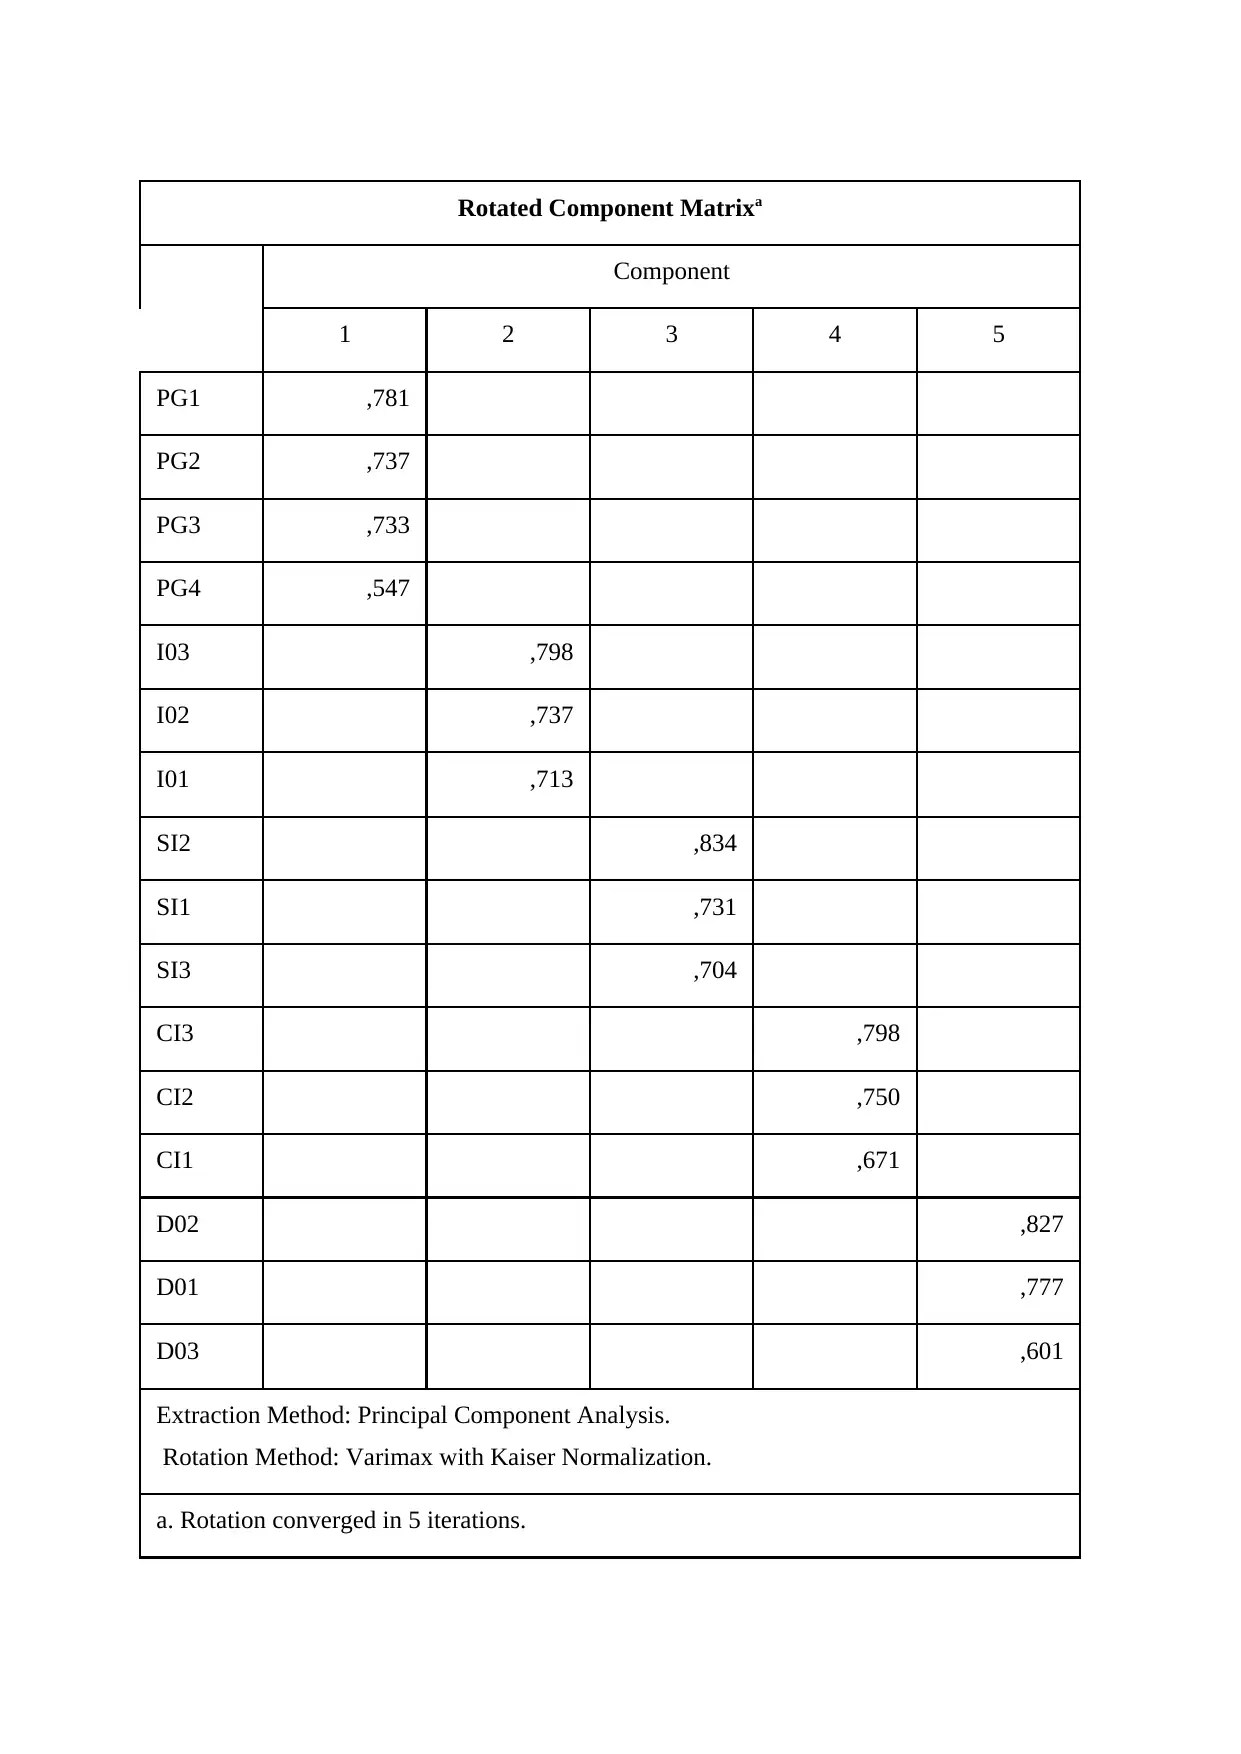
Rotated Component Matrixa
Component
1 2 3 4 5
PG1 ,781
PG2 ,737
PG3 ,733
PG4 ,547
I03 ,798
I02 ,737
I01 ,713
SI2 ,834
SI1 ,731
SI3 ,704
CI3 ,798
CI2 ,750
CI1 ,671
D02 ,827
D01 ,777
D03 ,601
Extraction Method: Principal Component Analysis.
Rotation Method: Varimax with Kaiser Normalization.
a. Rotation converged in 5 iterations.
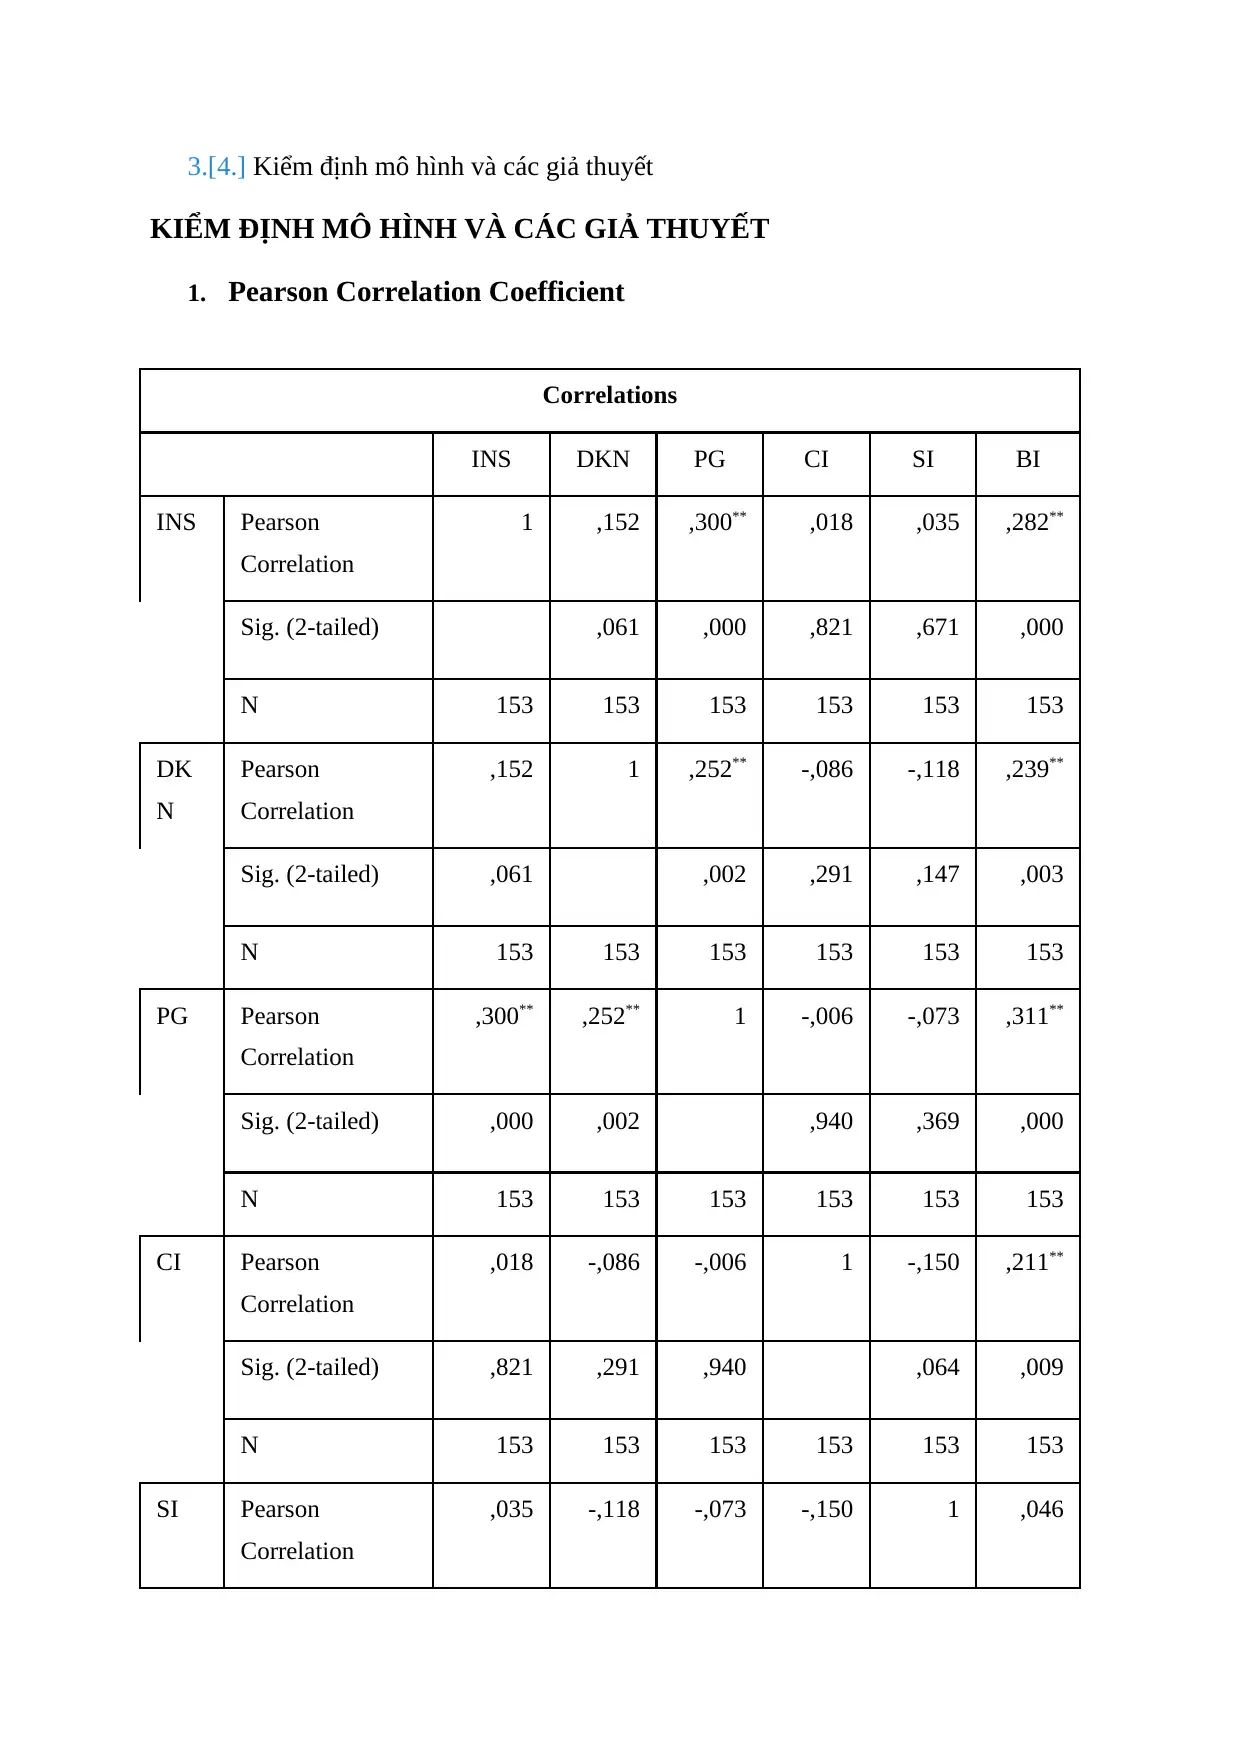
3.[4.] Kiểm định mô hình và các giả thuyết
KIỂM ĐỊNH MÔ HÌNH VÀ CÁC GIẢ THUYẾT
1. Pearson Correlation Coefficient
Correlations
INS DKN PG CI SI BI
INS Pearson
Correlation
1 ,152 ,300** ,018 ,035 ,282**
Sig. (2-tailed) ,061 ,000 ,821 ,671 ,000
N 153 153 153 153 153 153
DK
N
Pearson
Correlation
,152 1 ,252** -,086 -,118 ,239**
Sig. (2-tailed) ,061 ,002 ,291 ,147 ,003
N 153 153 153 153 153 153
PG Pearson
Correlation
,300** ,252** 1 -,006 -,073 ,311**
Sig. (2-tailed) ,000 ,002 ,940 ,369 ,000
N 153 153 153 153 153 153
CI Pearson
Correlation
,018 -,086 -,006 1 -,150 ,211**
Sig. (2-tailed) ,821 ,291 ,940 ,064 ,009
N 153 153 153 153 153 153
SI Pearson
Correlation
,035 -,118 -,073 -,150 1 ,046
Paraphrase This Document
Need a fresh take? Get an instant paraphrase of this document with our AI Paraphraser
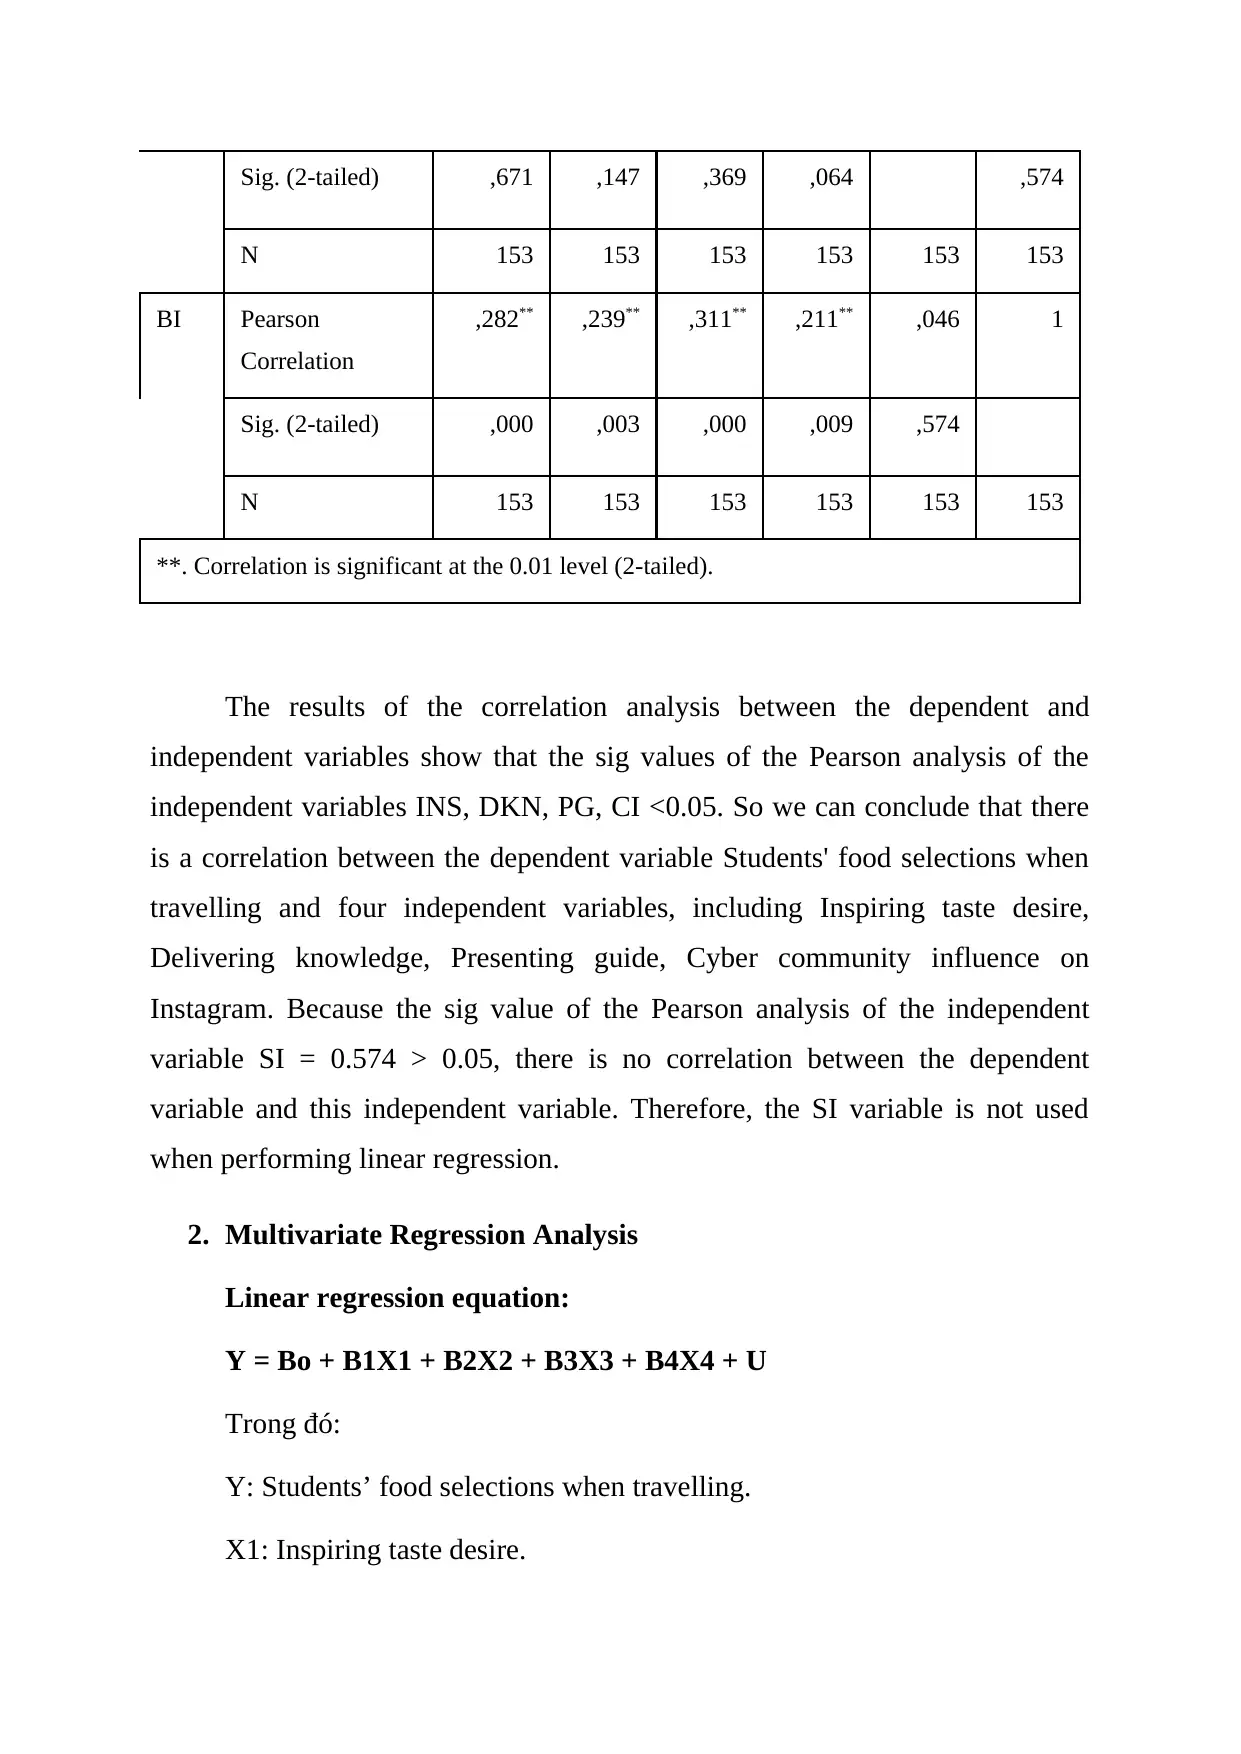
Sig. (2-tailed) ,671 ,147 ,369 ,064 ,574
N 153 153 153 153 153 153
BI Pearson
Correlation
,282** ,239** ,311** ,211** ,046 1
Sig. (2-tailed) ,000 ,003 ,000 ,009 ,574
N 153 153 153 153 153 153
**. Correlation is significant at the 0.01 level (2-tailed).
The results of the correlation analysis between the dependent and
independent variables show that the sig values of the Pearson analysis of the
independent variables INS, DKN, PG, CI <0.05. So we can conclude that there
is a correlation between the dependent variable Students' food selections when
travelling and four independent variables, including Inspiring taste desire,
Delivering knowledge, Presenting guide, Cyber community influence on
Instagram. Because the sig value of the Pearson analysis of the independent
variable SI = 0.574 > 0.05, there is no correlation between the dependent
variable and this independent variable. Therefore, the SI variable is not used
when performing linear regression.
2. Multivariate Regression Analysis
Linear regression equation:
Y = Bo + B1X1 + B2X2 + B3X3 + B4X4 + U
Trong đó:
Y: Students’ food selections when travelling.
X1: Inspiring taste desire.
N 153 153 153 153 153 153
BI Pearson
Correlation
,282** ,239** ,311** ,211** ,046 1
Sig. (2-tailed) ,000 ,003 ,000 ,009 ,574
N 153 153 153 153 153 153
**. Correlation is significant at the 0.01 level (2-tailed).
The results of the correlation analysis between the dependent and
independent variables show that the sig values of the Pearson analysis of the
independent variables INS, DKN, PG, CI <0.05. So we can conclude that there
is a correlation between the dependent variable Students' food selections when
travelling and four independent variables, including Inspiring taste desire,
Delivering knowledge, Presenting guide, Cyber community influence on
Instagram. Because the sig value of the Pearson analysis of the independent
variable SI = 0.574 > 0.05, there is no correlation between the dependent
variable and this independent variable. Therefore, the SI variable is not used
when performing linear regression.
2. Multivariate Regression Analysis
Linear regression equation:
Y = Bo + B1X1 + B2X2 + B3X3 + B4X4 + U
Trong đó:
Y: Students’ food selections when travelling.
X1: Inspiring taste desire.
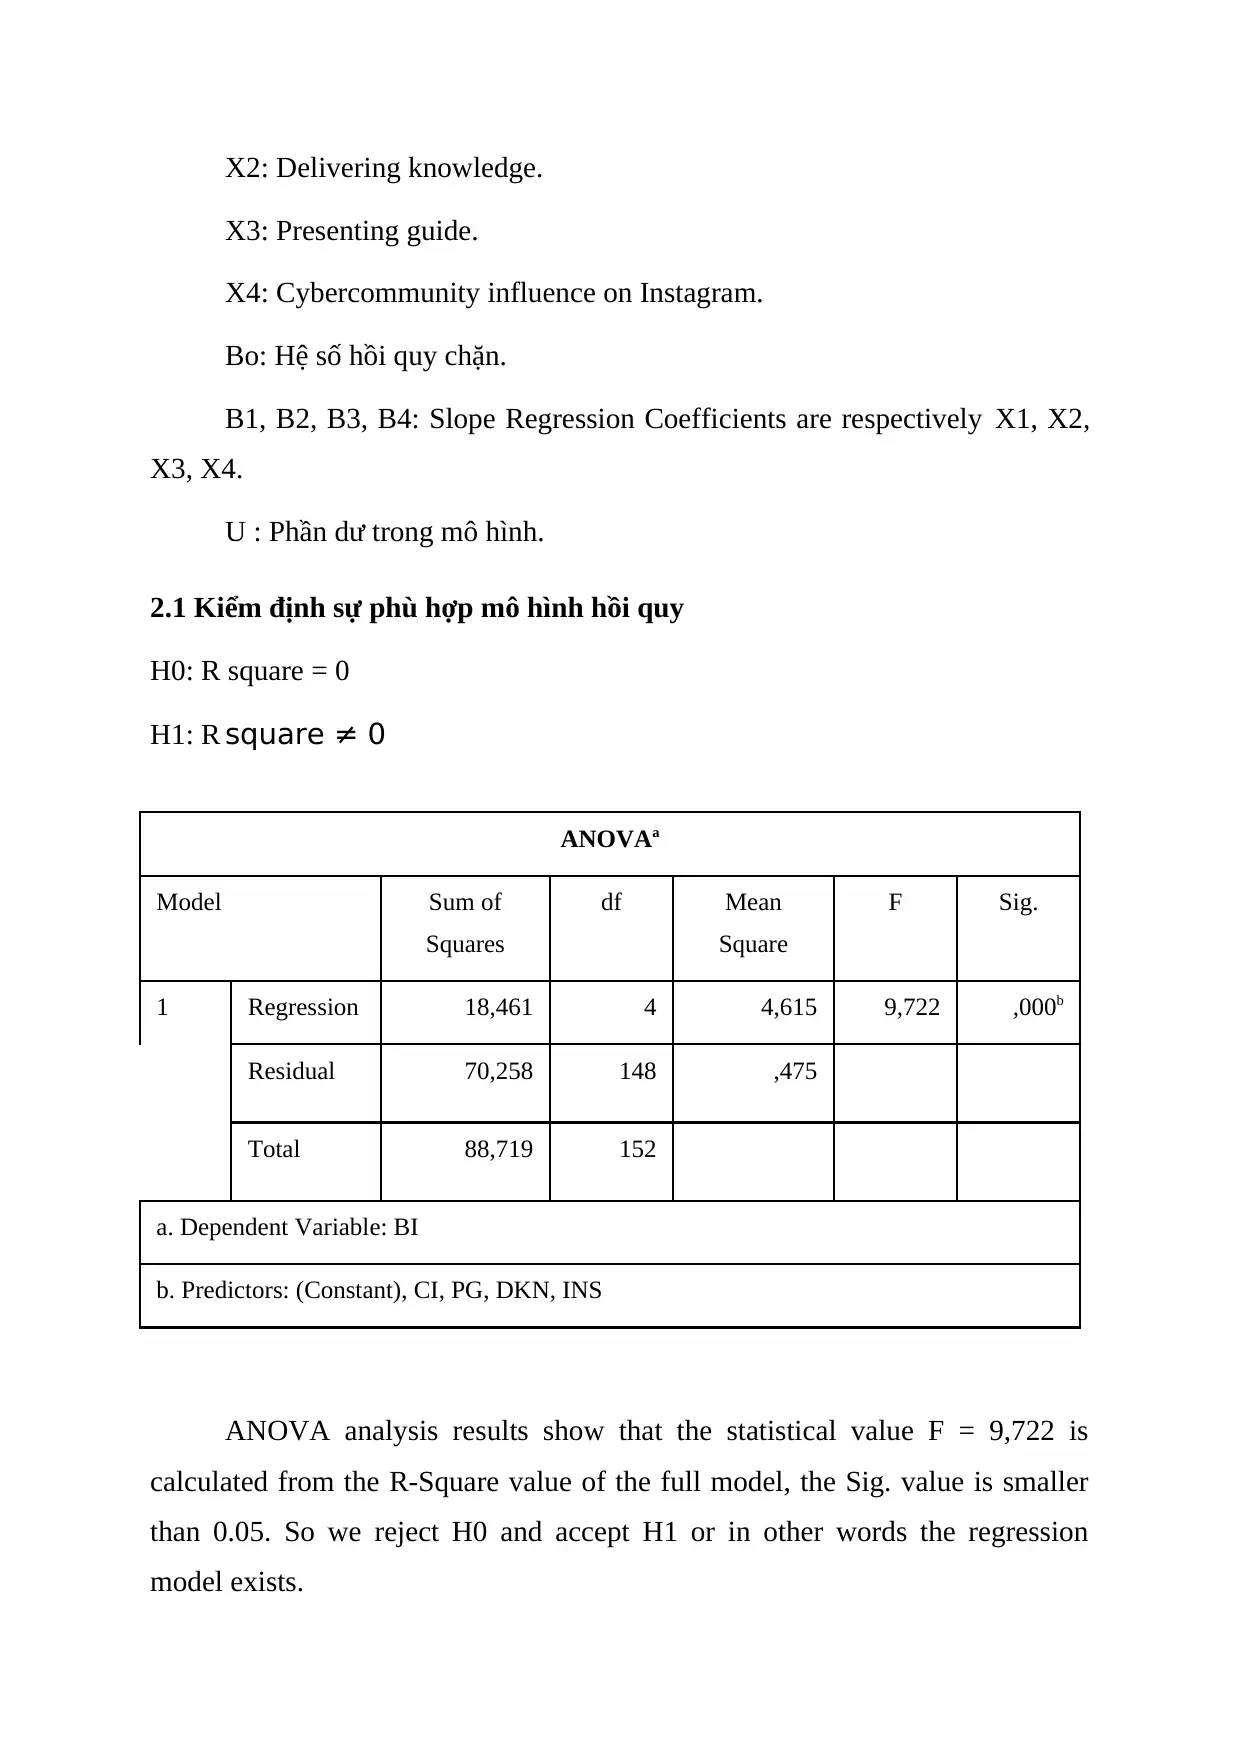
X2: Delivering knowledge.
X3: Presenting guide.
X4: Cybercommunity influence on Instagram.
Bo: Hệ số hồi quy chặn.
B1, B2, B3, B4: Slope Regression Coefficients are respectively X1, X2,
X3, X4.
U : Phần dư trong mô hình.
2.1 Kiểm định sự phù hợp mô hình hồi quy
H0: R square = 0
H1: R square ≠ 0
ANOVAa
Model Sum of
Squares
df Mean
Square
F Sig.
1 Regression 18,461 4 4,615 9,722 ,000b
Residual 70,258 148 ,475
Total 88,719 152
a. Dependent Variable: BI
b. Predictors: (Constant), CI, PG, DKN, INS
ANOVA analysis results show that the statistical value F = 9,722 is
calculated from the R-Square value of the full model, the Sig. value is smaller
than 0.05. So we reject H0 and accept H1 or in other words the regression
model exists.
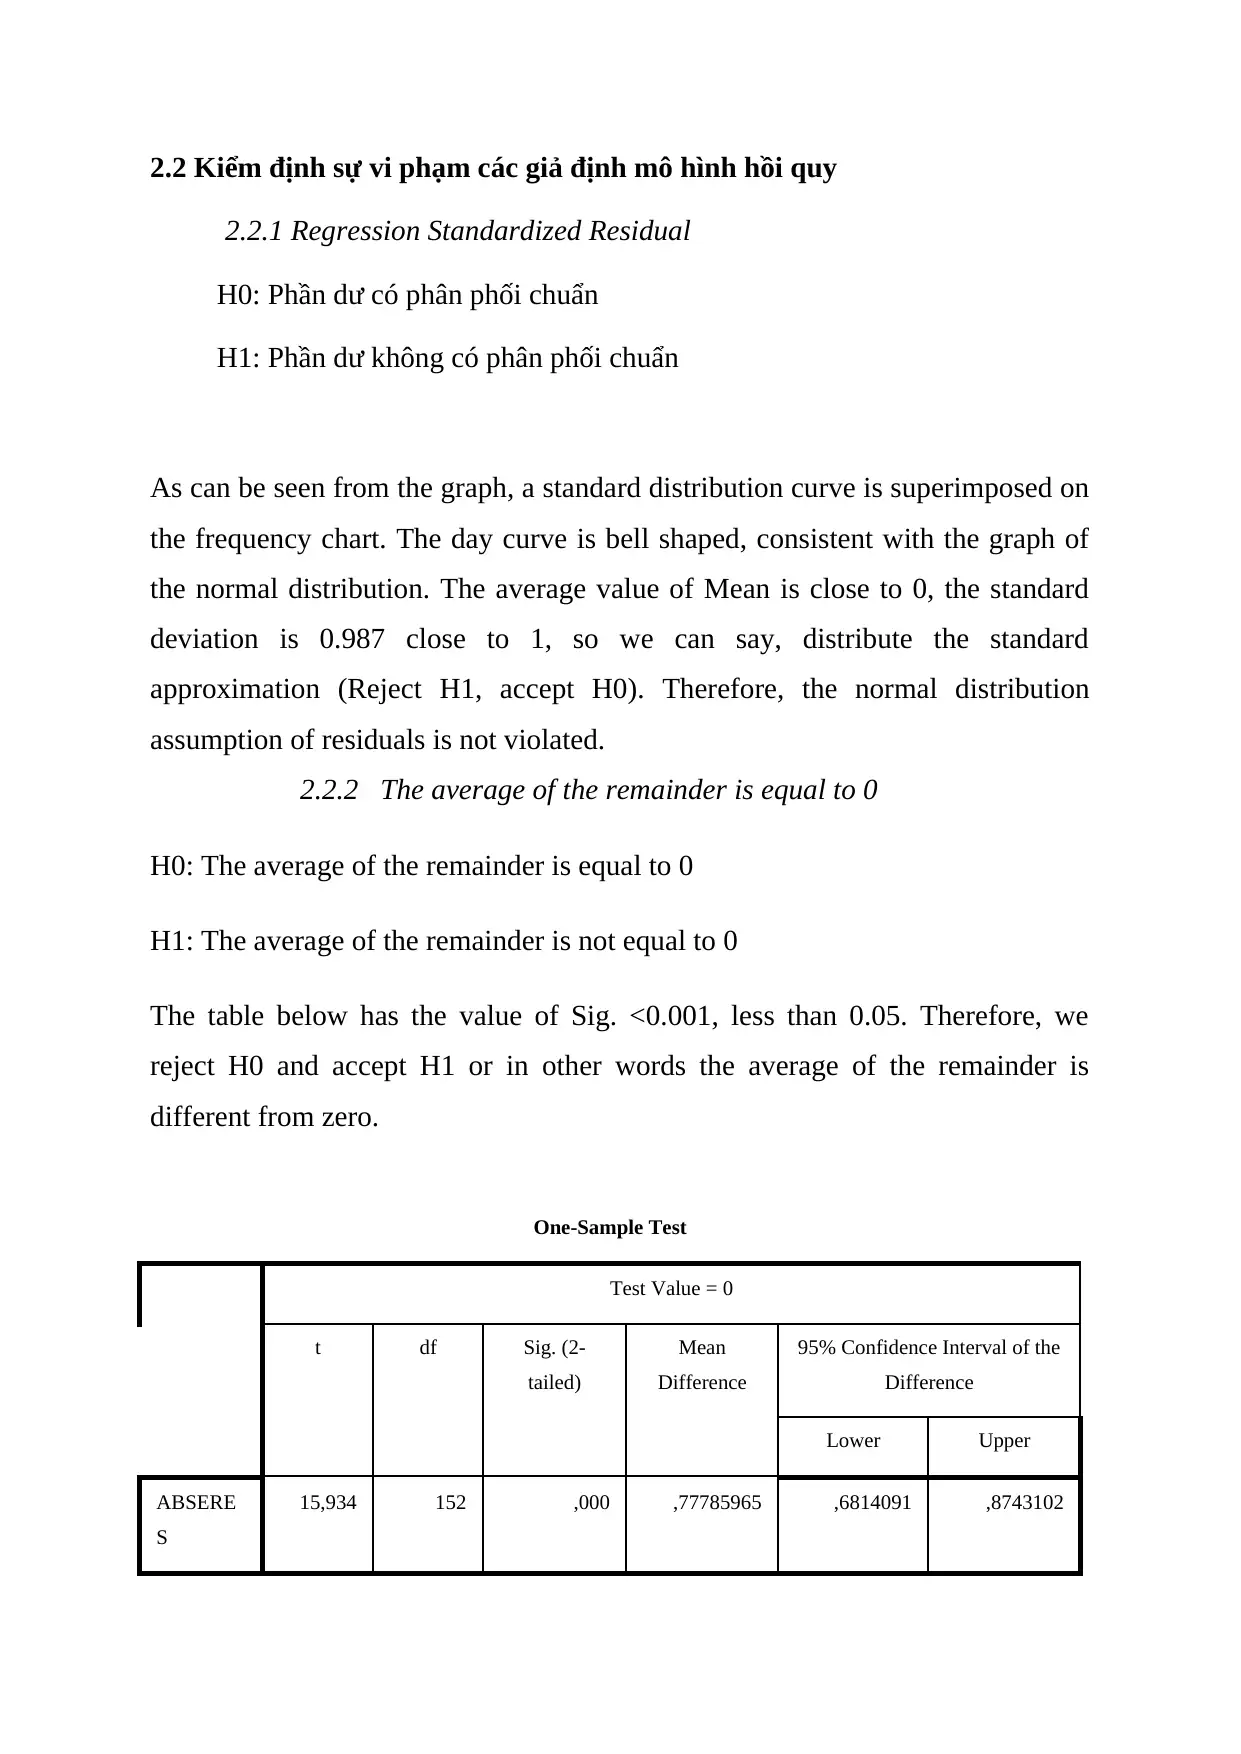
2.2 Kiểm định sự vi phạm các giả định mô hình hồi quy
2.2.1 Regression Standardized Residual
H0: Phần dư có phân phối chuẩn
H1: Phần dư không có phân phối chuẩn
As can be seen from the graph, a standard distribution curve is superimposed on
the frequency chart. The day curve is bell shaped, consistent with the graph of
the normal distribution. The average value of Mean is close to 0, the standard
deviation is 0.987 close to 1, so we can say, distribute the standard
approximation (Reject H1, accept H0). Therefore, the normal distribution
assumption of residuals is not violated.
2.2.2 The average of the remainder is equal to 0
H0: The average of the remainder is equal to 0
H1: The average of the remainder is not equal to 0
The table below has the value of Sig. <0.001, less than 0.05. Therefore, we
reject H0 and accept H1 or in other words the average of the remainder is
different from zero.
One-Sample Test
Test Value = 0
t df Sig. (2-
tailed)
Mean
Difference
95% Confidence Interval of the
Difference
Lower Upper
ABSERE
S
15,934 152 ,000 ,77785965 ,6814091 ,8743102
Secure Best Marks with AI Grader
Need help grading? Try our AI Grader for instant feedback on your assignments.
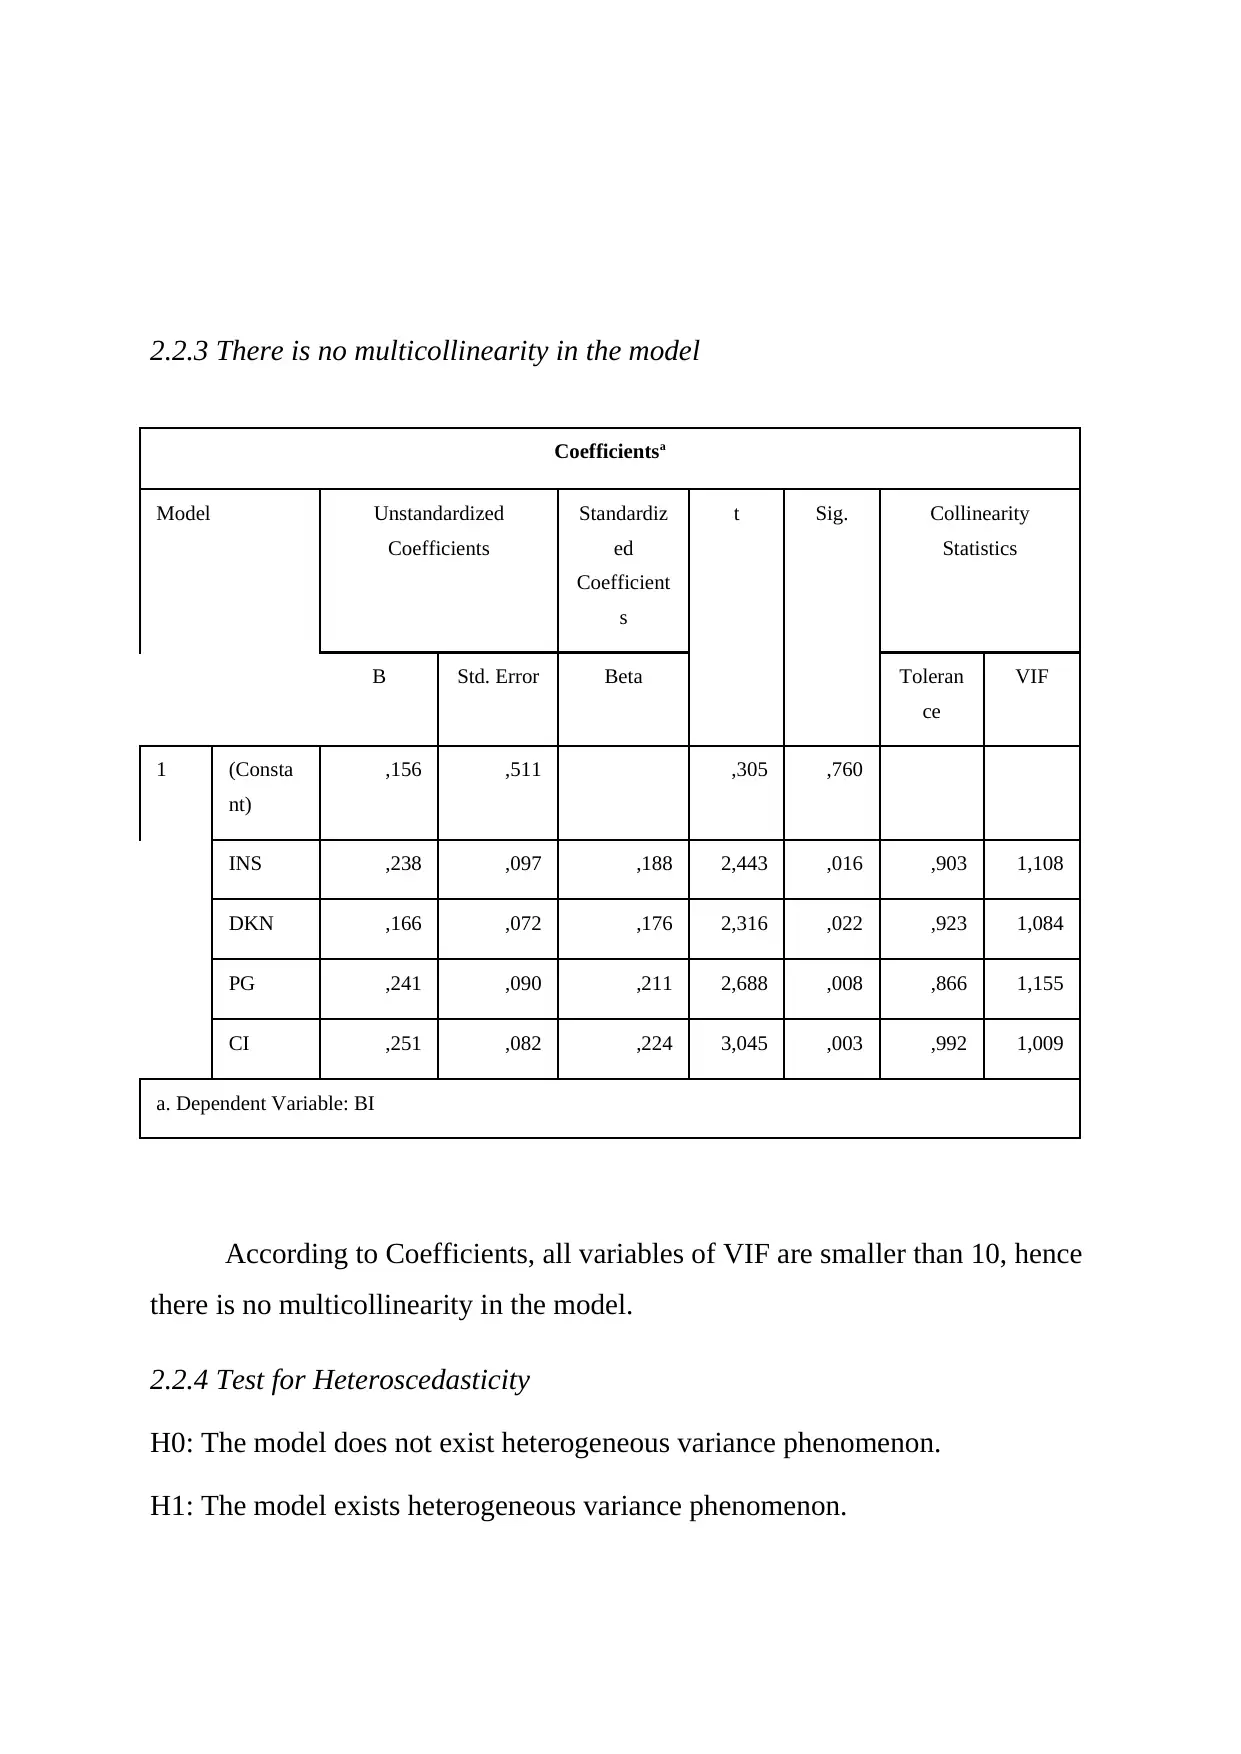
2.2.3 There is no multicollinearity in the model
Coefficientsa
Model Unstandardized
Coefficients
Standardiz
ed
Coefficient
s
t Sig. Collinearity
Statistics
B Std. Error Beta Toleran
ce
VIF
1 (Consta
nt)
,156 ,511 ,305 ,760
INS ,238 ,097 ,188 2,443 ,016 ,903 1,108
DKN ,166 ,072 ,176 2,316 ,022 ,923 1,084
PG ,241 ,090 ,211 2,688 ,008 ,866 1,155
CI ,251 ,082 ,224 3,045 ,003 ,992 1,009
a. Dependent Variable: BI
According to Coefficients, all variables of VIF are smaller than 10, hence
there is no multicollinearity in the model.
2.2.4 Test for Heteroscedasticity
H0: The model does not exist heterogeneous variance phenomenon.
H1: The model exists heterogeneous variance phenomenon.
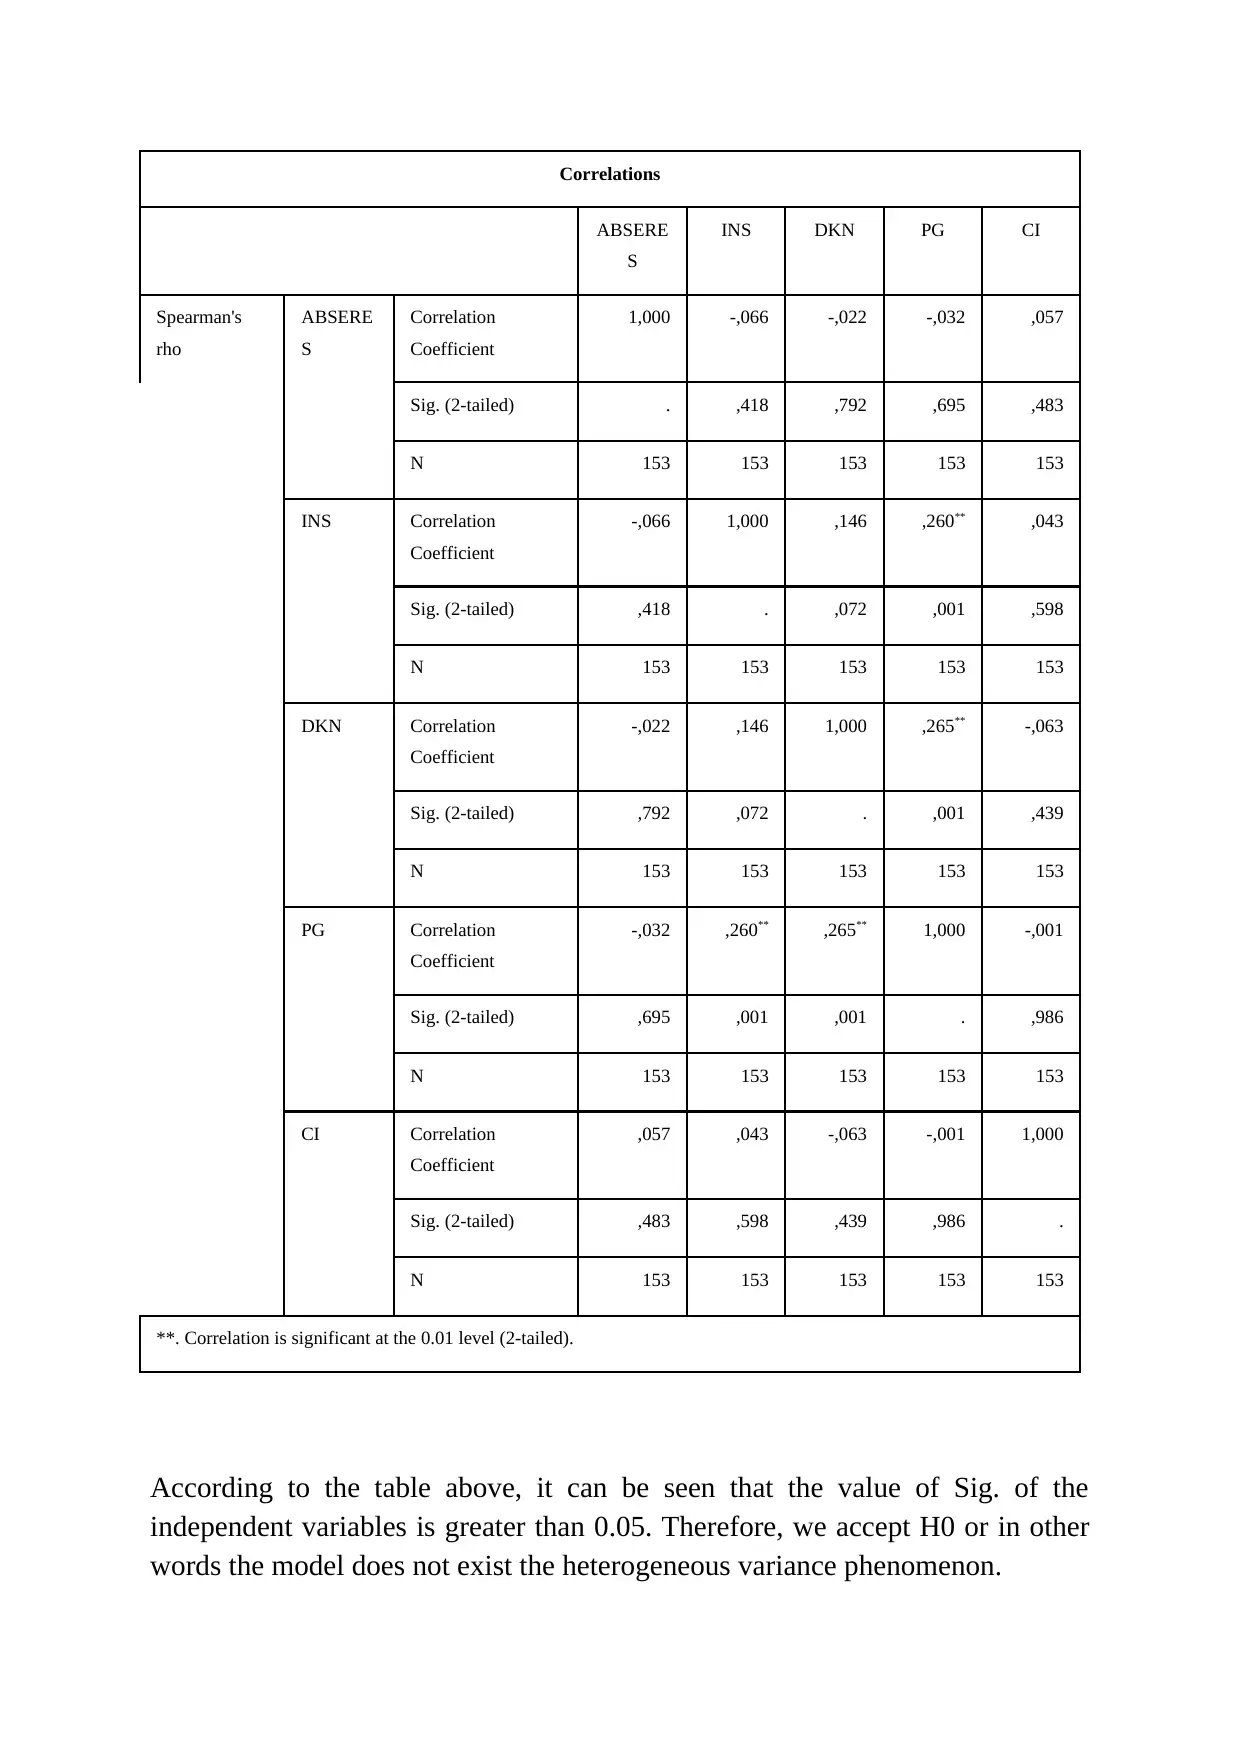
Correlations
ABSERE
S
INS DKN PG CI
Spearman's
rho
ABSERE
S
Correlation
Coefficient
1,000 -,066 -,022 -,032 ,057
Sig. (2-tailed) . ,418 ,792 ,695 ,483
N 153 153 153 153 153
INS Correlation
Coefficient
-,066 1,000 ,146 ,260** ,043
Sig. (2-tailed) ,418 . ,072 ,001 ,598
N 153 153 153 153 153
DKN Correlation
Coefficient
-,022 ,146 1,000 ,265** -,063
Sig. (2-tailed) ,792 ,072 . ,001 ,439
N 153 153 153 153 153
PG Correlation
Coefficient
-,032 ,260** ,265** 1,000 -,001
Sig. (2-tailed) ,695 ,001 ,001 . ,986
N 153 153 153 153 153
CI Correlation
Coefficient
,057 ,043 -,063 -,001 1,000
Sig. (2-tailed) ,483 ,598 ,439 ,986 .
N 153 153 153 153 153
**. Correlation is significant at the 0.01 level (2-tailed).
According to the table above, it can be seen that the value of Sig. of the
independent variables is greater than 0.05. Therefore, we accept H0 or in other
words the model does not exist the heterogeneous variance phenomenon.
ABSERE
S
INS DKN PG CI
Spearman's
rho
ABSERE
S
Correlation
Coefficient
1,000 -,066 -,022 -,032 ,057
Sig. (2-tailed) . ,418 ,792 ,695 ,483
N 153 153 153 153 153
INS Correlation
Coefficient
-,066 1,000 ,146 ,260** ,043
Sig. (2-tailed) ,418 . ,072 ,001 ,598
N 153 153 153 153 153
DKN Correlation
Coefficient
-,022 ,146 1,000 ,265** -,063
Sig. (2-tailed) ,792 ,072 . ,001 ,439
N 153 153 153 153 153
PG Correlation
Coefficient
-,032 ,260** ,265** 1,000 -,001
Sig. (2-tailed) ,695 ,001 ,001 . ,986
N 153 153 153 153 153
CI Correlation
Coefficient
,057 ,043 -,063 -,001 1,000
Sig. (2-tailed) ,483 ,598 ,439 ,986 .
N 153 153 153 153 153
**. Correlation is significant at the 0.01 level (2-tailed).
According to the table above, it can be seen that the value of Sig. of the
independent variables is greater than 0.05. Therefore, we accept H0 or in other
words the model does not exist the heterogeneous variance phenomenon.
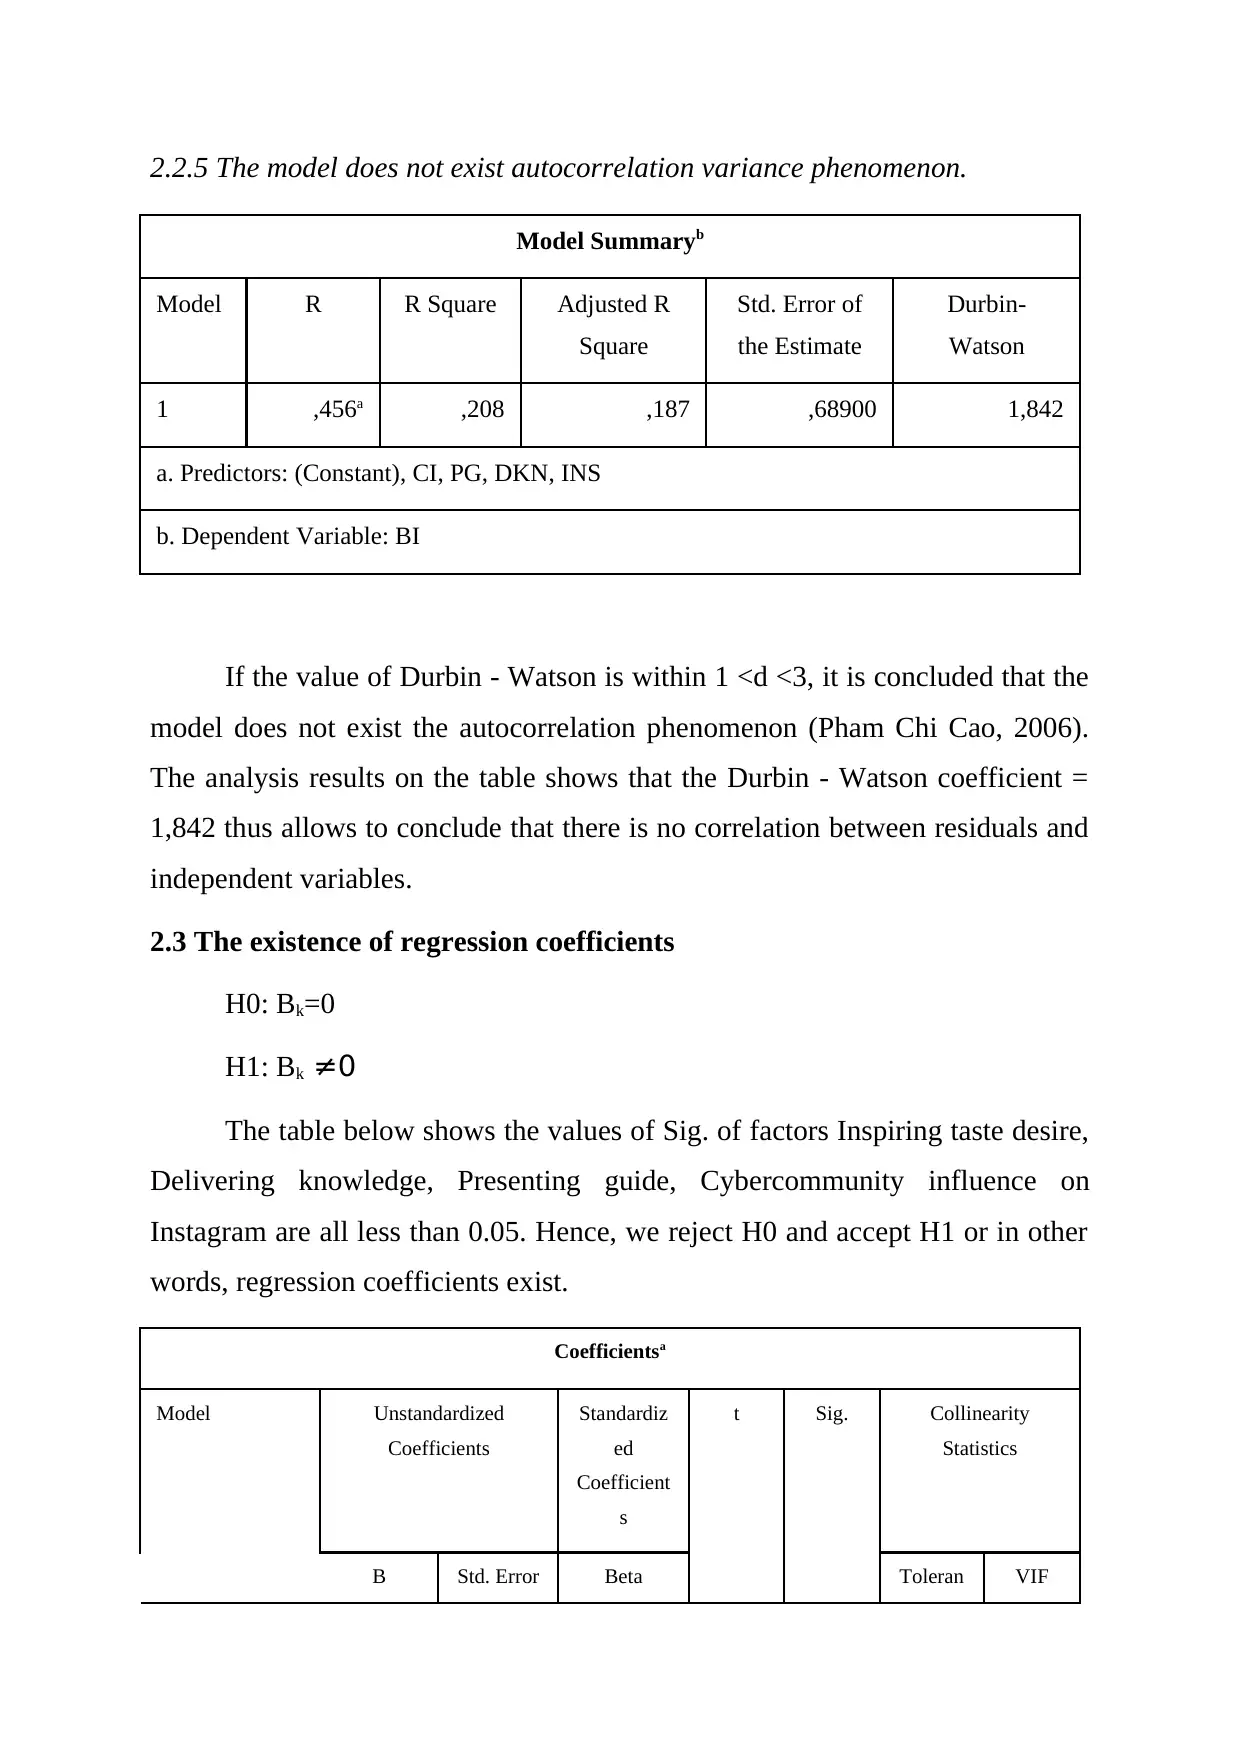
2.2.5 The model does not exist autocorrelation variance phenomenon.
Model Summaryb
Model R R Square Adjusted R
Square
Std. Error of
the Estimate
Durbin-
Watson
1 ,456a ,208 ,187 ,68900 1,842
a. Predictors: (Constant), CI, PG, DKN, INS
b. Dependent Variable: BI
If the value of Durbin - Watson is within 1 <d <3, it is concluded that the
model does not exist the autocorrelation phenomenon (Pham Chi Cao, 2006).
The analysis results on the table shows that the Durbin - Watson coefficient =
1,842 thus allows to conclude that there is no correlation between residuals and
independent variables.
2.3 The existence of regression coefficients
H0: Bk=0
H1: Bk ≠0
The table below shows the values of Sig. of factors Inspiring taste desire,
Delivering knowledge, Presenting guide, Cybercommunity influence on
Instagram are all less than 0.05. Hence, we reject H0 and accept H1 or in other
words, regression coefficients exist.
Coefficientsa
Model Unstandardized
Coefficients
Standardiz
ed
Coefficient
s
t Sig. Collinearity
Statistics
B Std. Error Beta Toleran VIF
Paraphrase This Document
Need a fresh take? Get an instant paraphrase of this document with our AI Paraphraser
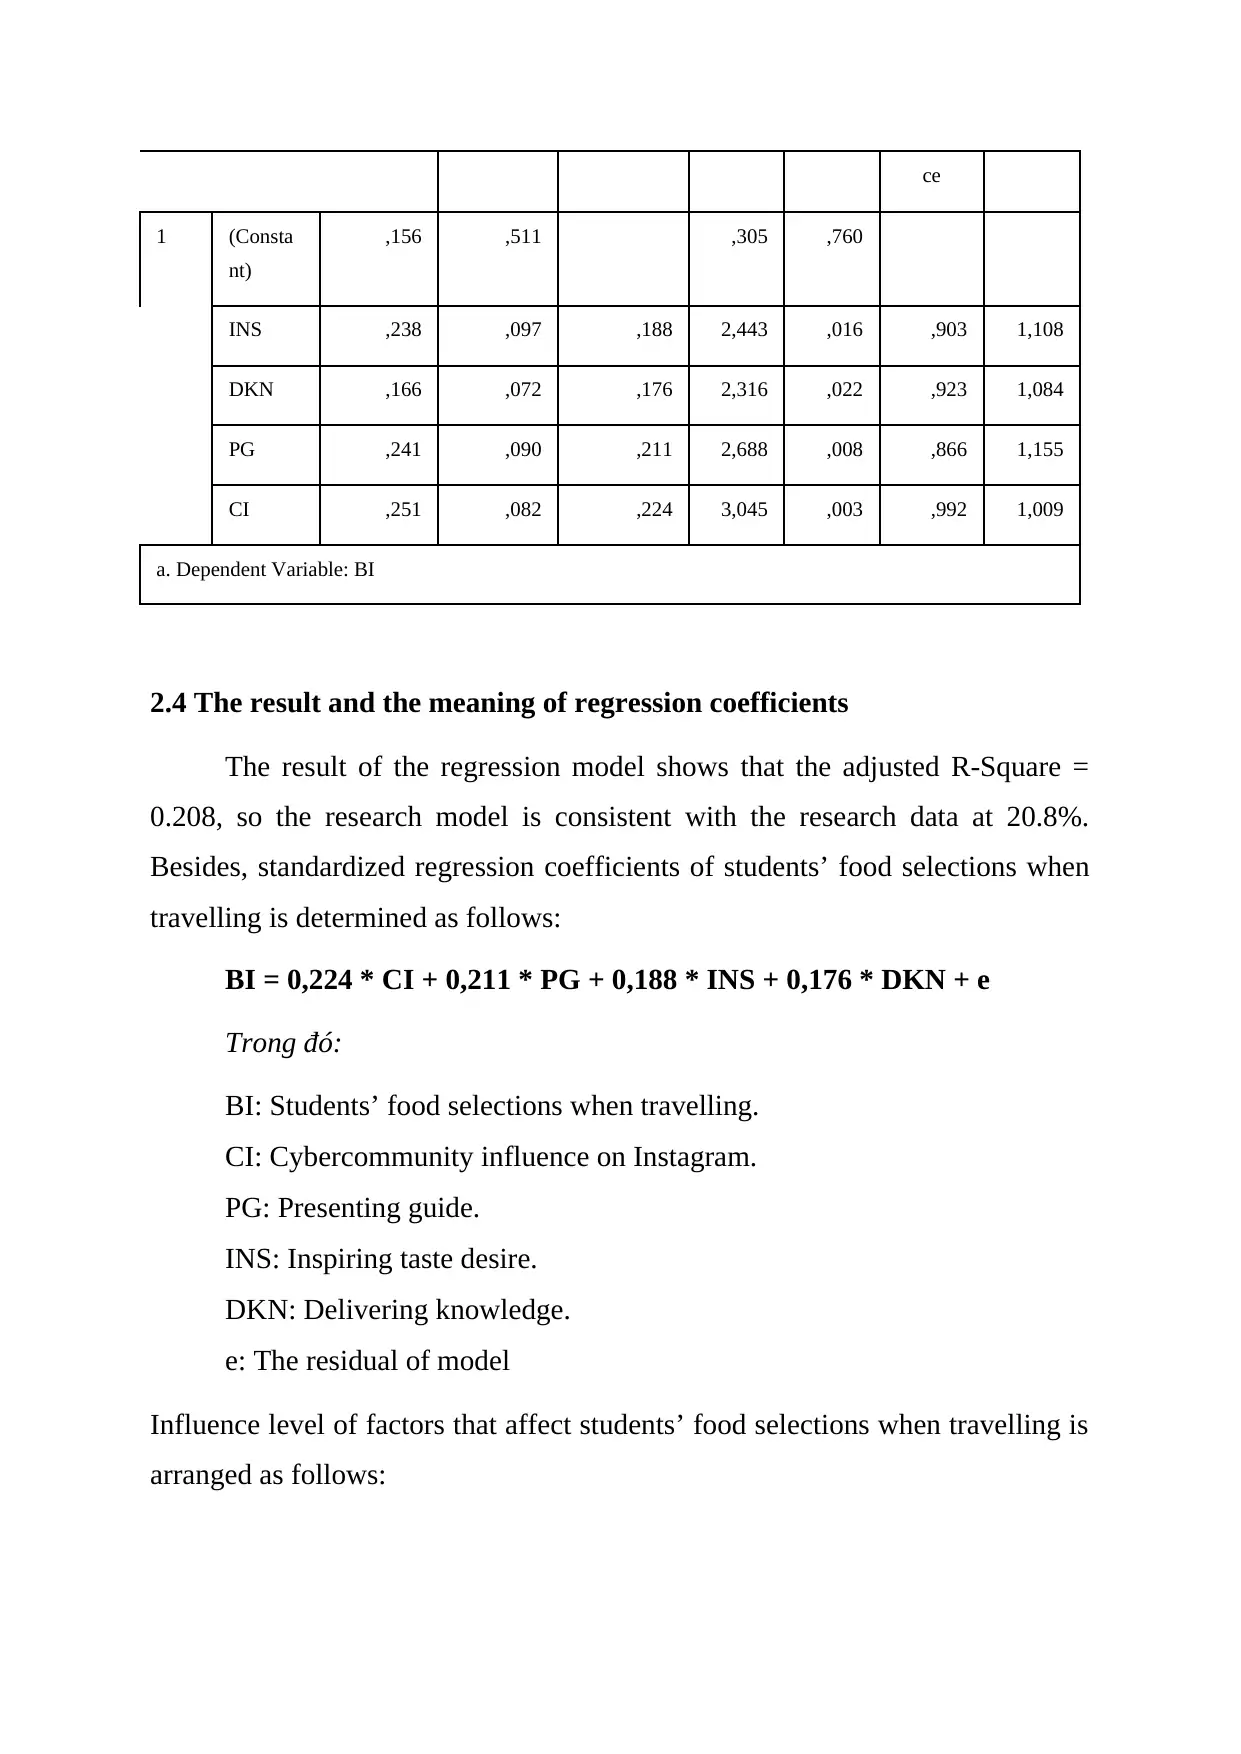
ce
1 (Consta
nt)
,156 ,511 ,305 ,760
INS ,238 ,097 ,188 2,443 ,016 ,903 1,108
DKN ,166 ,072 ,176 2,316 ,022 ,923 1,084
PG ,241 ,090 ,211 2,688 ,008 ,866 1,155
CI ,251 ,082 ,224 3,045 ,003 ,992 1,009
a. Dependent Variable: BI
2.4 The result and the meaning of regression coefficients
The result of the regression model shows that the adjusted R-Square =
0.208, so the research model is consistent with the research data at 20.8%.
Besides, standardized regression coefficients of students’ food selections when
travelling is determined as follows:
BI = 0,224 * CI + 0,211 * PG + 0,188 * INS + 0,176 * DKN + e
Trong đó:
BI: Students’ food selections when travelling.
CI: Cybercommunity influence on Instagram.
PG: Presenting guide.
INS: Inspiring taste desire.
DKN: Delivering knowledge.
e: The residual of model
Influence level of factors that affect students’ food selections when travelling is
arranged as follows:
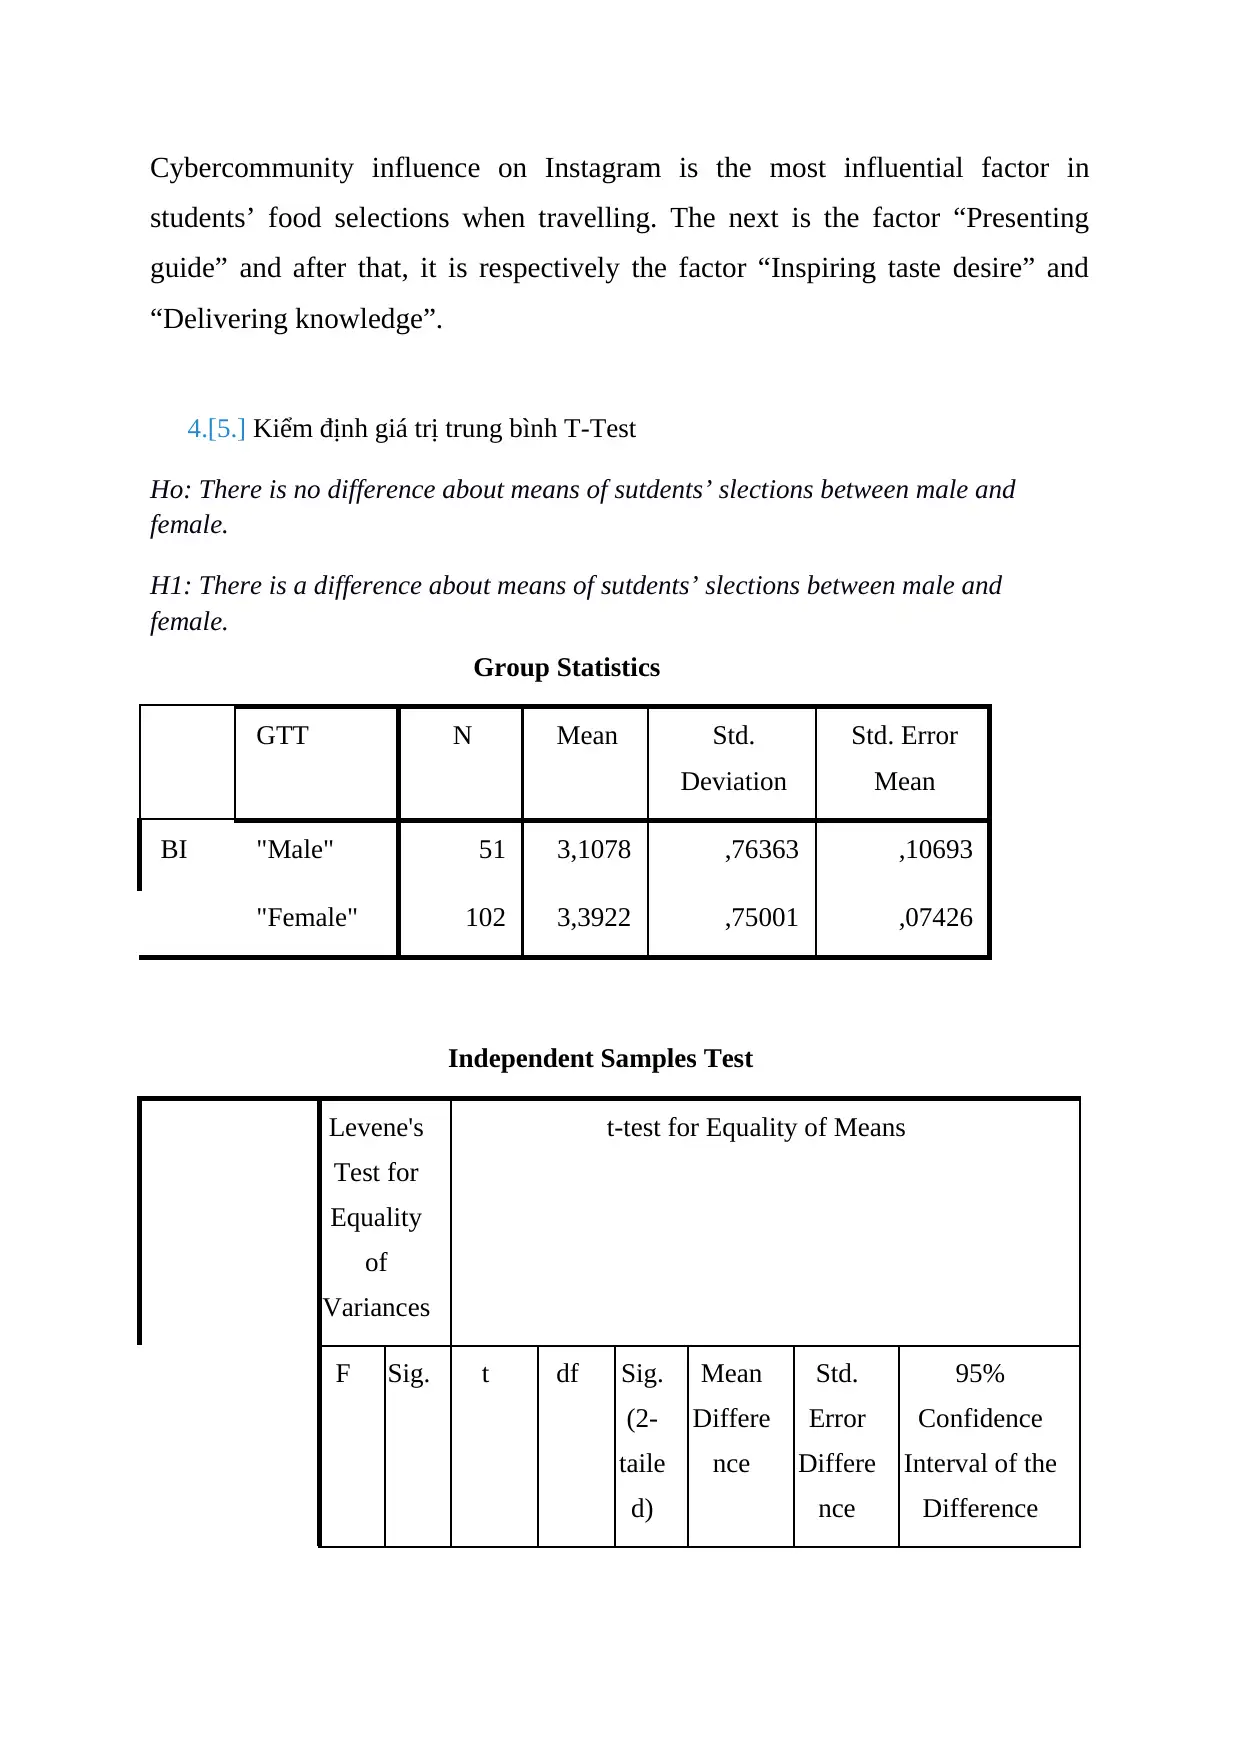
Cybercommunity influence on Instagram is the most influential factor in
students’ food selections when travelling. The next is the factor “Presenting
guide” and after that, it is respectively the factor “Inspiring taste desire” and
“Delivering knowledge”.
4.[5.] Kiểm định giá trị trung bình T-Test
Ho: There is no difference about means of sutdents’ slections between male and
female.
H1: There is a difference about means of sutdents’ slections between male and
female.
Group Statistics
GTT N Mean Std.
Deviation
Std. Error
Mean
BI "Male" 51 3,1078 ,76363 ,10693
"Female" 102 3,3922 ,75001 ,07426
Independent Samples Test
Levene's
Test for
Equality
of
Variances
t-test for Equality of Means
F Sig. t df Sig.
(2-
taile
d)
Mean
Differe
nce
Std.
Error
Differe
nce
95%
Confidence
Interval of the
Difference
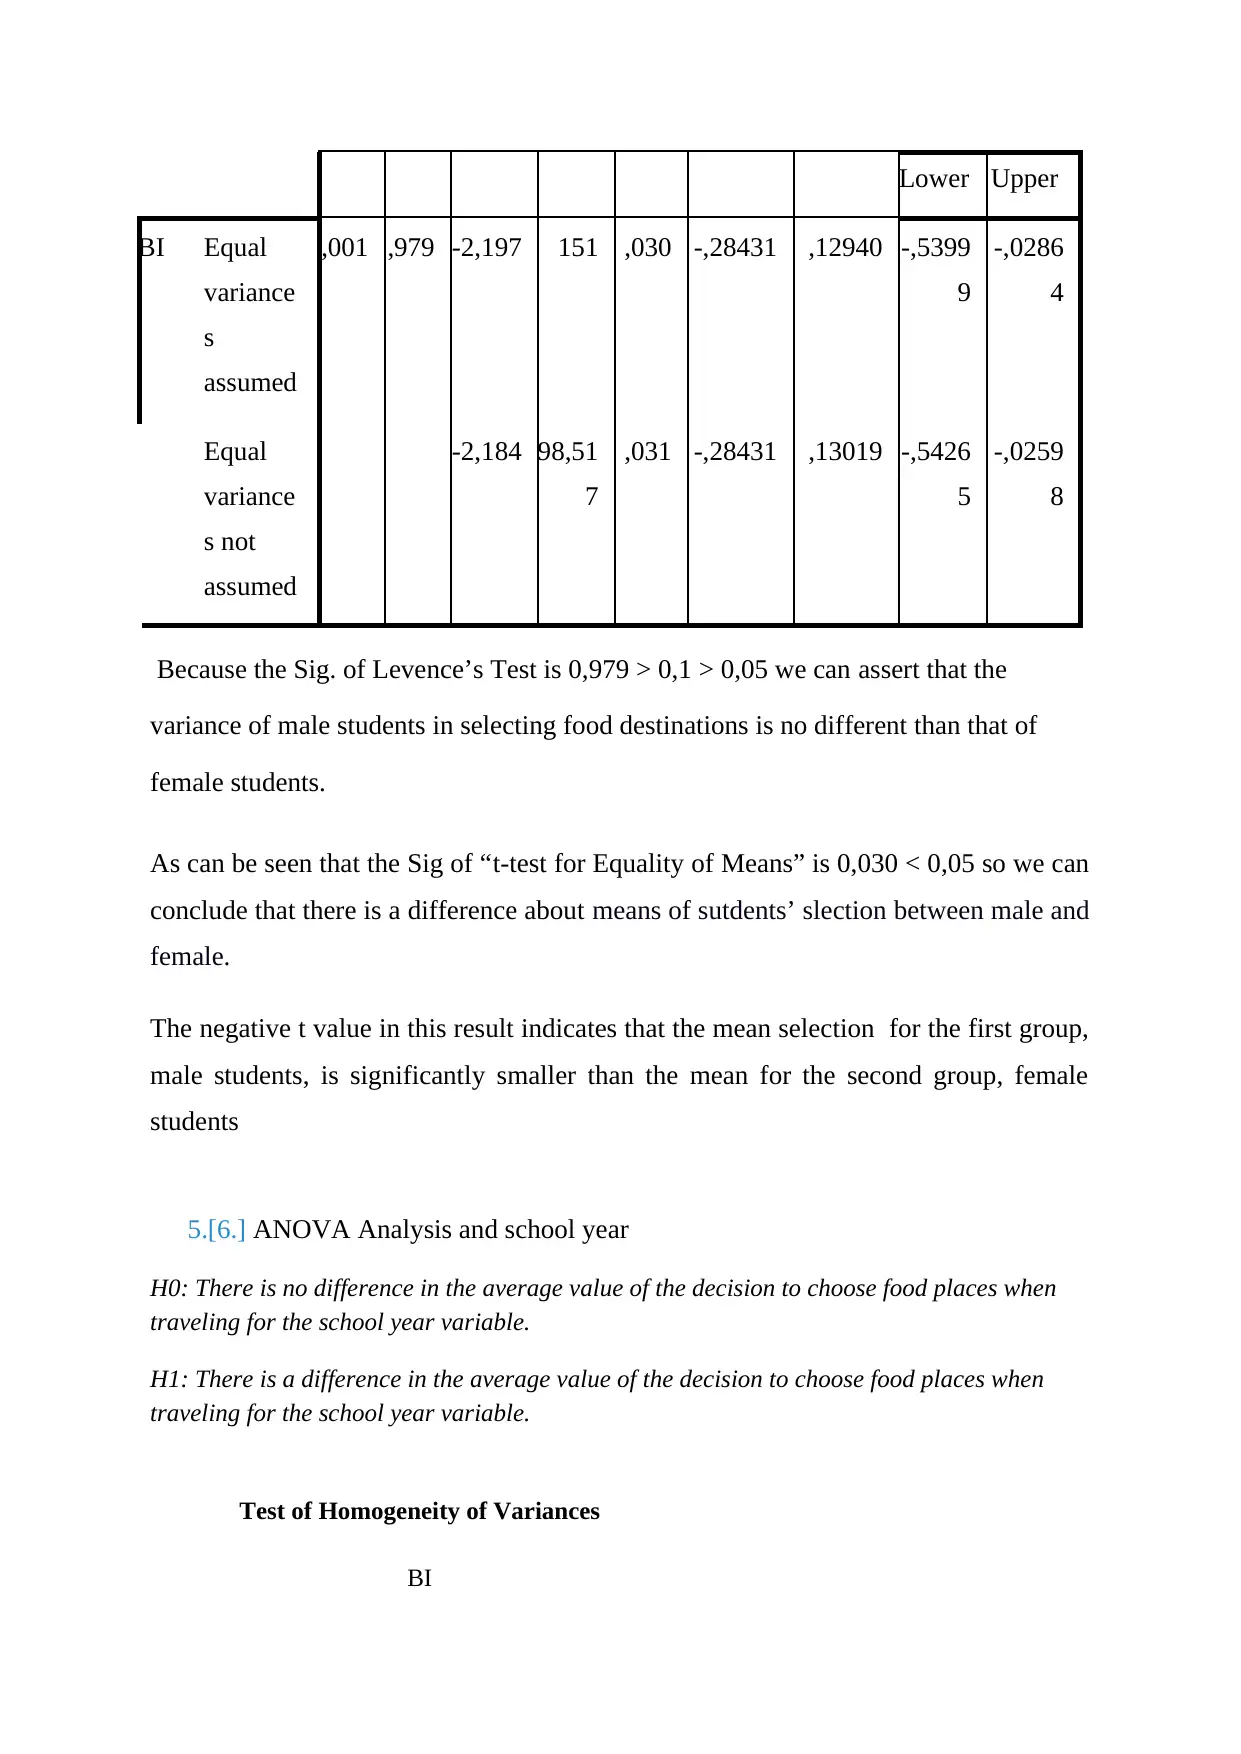
Lower Upper
BI Equal
variance
s
assumed
,001 ,979 -2,197 151 ,030 -,28431 ,12940 -,5399
9
-,0286
4
Equal
variance
s not
assumed
-2,184 98,51
7
,031 -,28431 ,13019 -,5426
5
-,0259
8
Because the Sig. of Levence’s Test is 0,979 > 0,1 > 0,05 we can assert that the
variance of male students in selecting food destinations is no different than that of
female students.
As can be seen that the Sig of “t-test for Equality of Means” is 0,030 < 0,05 so we can
conclude that there is a difference about means of sutdents’ slection between male and
female.
The negative t value in this result indicates that the mean selection for the first group,
male students, is significantly smaller than the mean for the second group, female
students
5.[6.] ANOVA Analysis and school year
H0: There is no difference in the average value of the decision to choose food places when
traveling for the school year variable.
H1: There is a difference in the average value of the decision to choose food places when
traveling for the school year variable.
Test of Homogeneity of Variances
BI
Secure Best Marks with AI Grader
Need help grading? Try our AI Grader for instant feedback on your assignments.
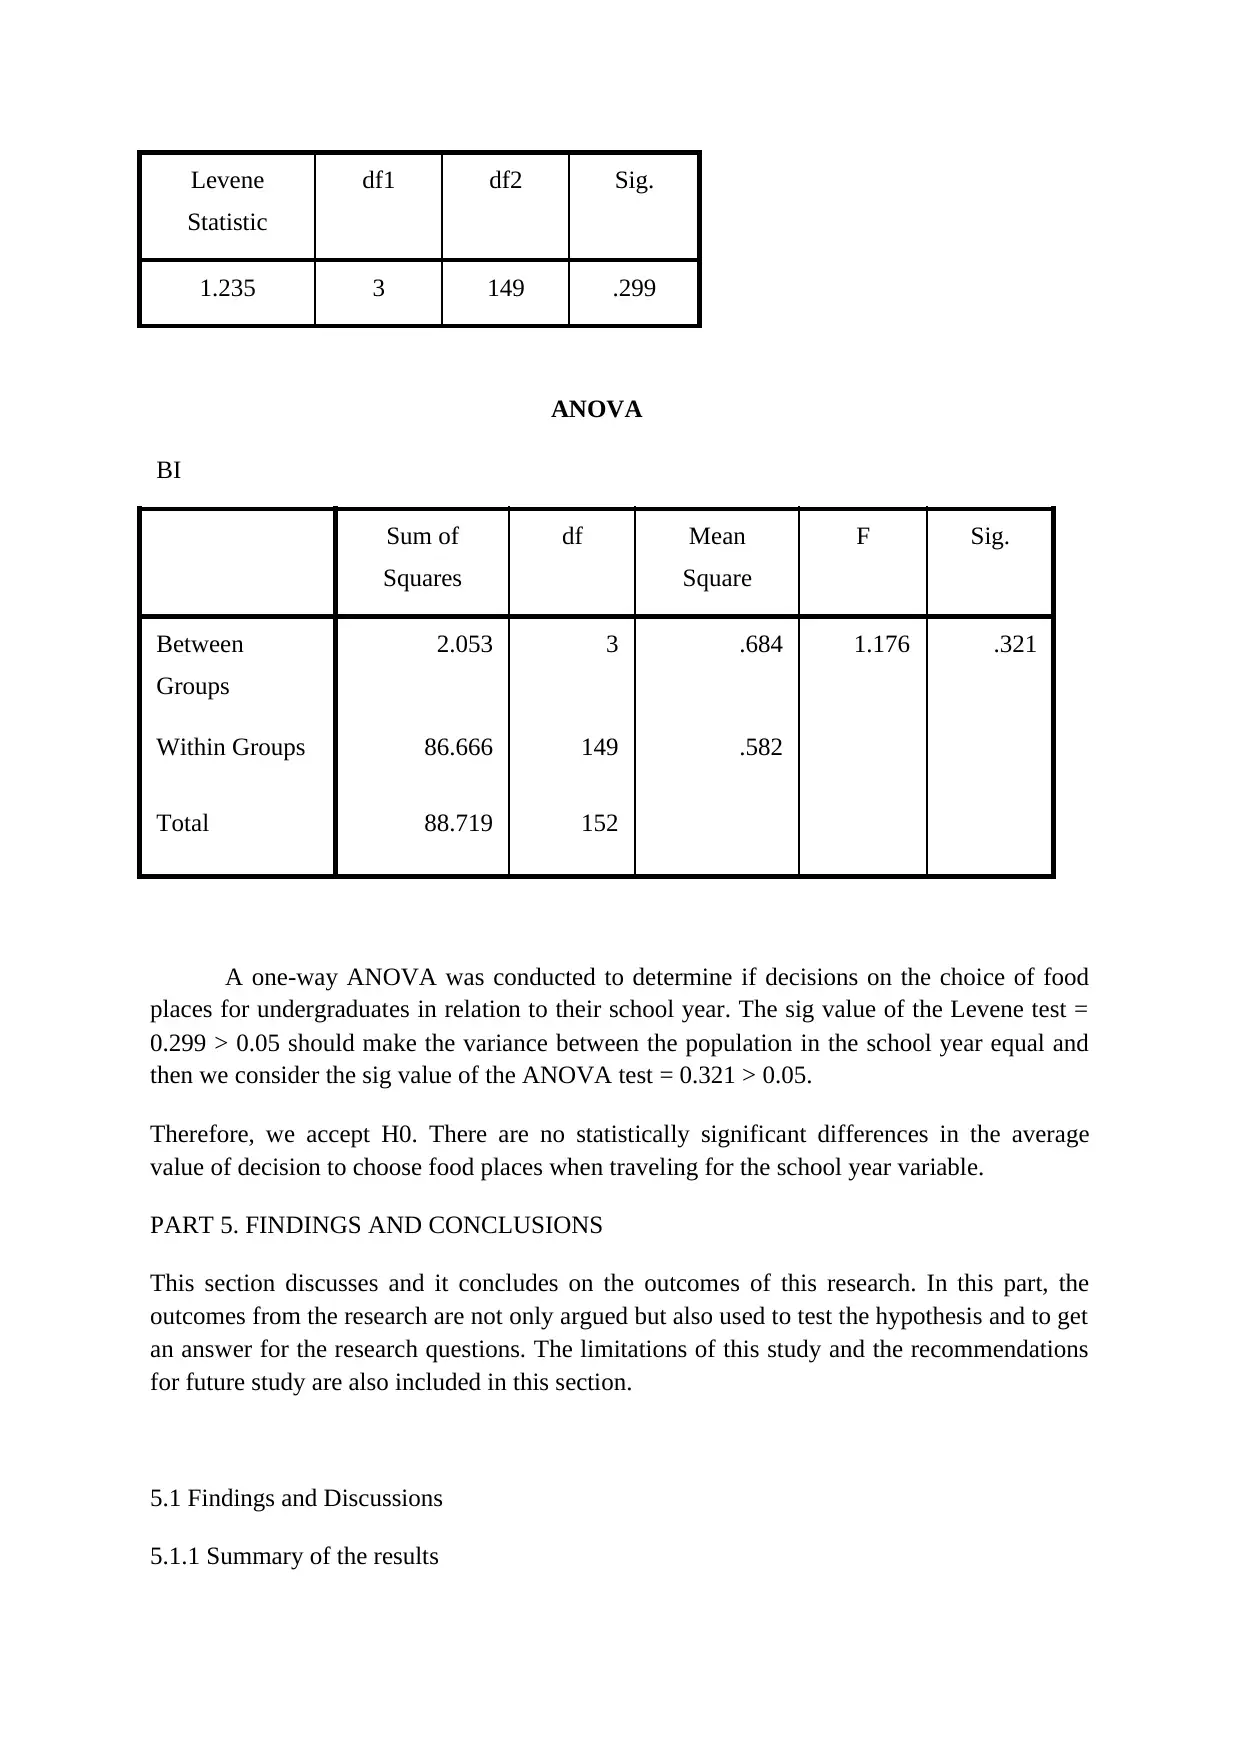
Levene
Statistic
df1 df2 Sig.
1.235 3 149 .299
ANOVA
BI
Sum of
Squares
df Mean
Square
F Sig.
Between
Groups
2.053 3 .684 1.176 .321
Within Groups 86.666 149 .582
Total 88.719 152
A one-way ANOVA was conducted to determine if decisions on the choice of food
places for undergraduates in relation to their school year. The sig value of the Levene test =
0.299 > 0.05 should make the variance between the population in the school year equal and
then we consider the sig value of the ANOVA test = 0.321 > 0.05.
Therefore, we accept H0. There are no statistically significant differences in the average
value of decision to choose food places when traveling for the school year variable.
PART 5. FINDINGS AND CONCLUSIONS
This section discusses and it concludes on the outcomes of this research. In this part, the
outcomes from the research are not only argued but also used to test the hypothesis and to get
an answer for the research questions. The limitations of this study and the recommendations
for future study are also included in this section.
5.1 Findings and Discussions
5.1.1 Summary of the results
1 out of 53

Your All-in-One AI-Powered Toolkit for Academic Success.
+13062052269
info@desklib.com
Available 24*7 on WhatsApp / Email
![[object Object]](/_next/static/media/star-bottom.7253800d.svg)
Unlock your academic potential
© 2024 | Zucol Services PVT LTD | All rights reserved.