Office Sales Data Analysis: A Report on Profit Maximization
VerifiedAdded on 2023/01/20
|13
|1924
|28
Report
AI Summary
This report analyzes office sales data to identify strategies for profit maximization. The analysis includes a memorandum to the Board of Directors, detailing the company's current financial standing and the importance of data-driven decision-making in a competitive online market. The report examines the contributions of different categories, subcategories, and regions to overall profit, highlighting the technology category and copiers as key drivers of revenue. It also includes visualizations and statistical analysis using R code to support the findings. The report concludes with recommendations to reduce operational costs, invest in high-demand products, and improve customer experience to increase profitability. The analysis provides a comprehensive overview of the data, offering insights into the business's performance and actionable strategies for improvement.
Contents
Memorandum.............................................................................................................................ii
Introduction................................................................................................................................ii
Featured Output from the Data.................................................................................................iii
Comparison of the Average Profit against the Subcategories..............................................iii
Comparison of the Average Profit Against the Categories...................................................iii
Comparison of the Average Profit Against the Regions.......................................................iv
Comparison of the Average Profit Against the Regions.......................................................iv
Summary and Conclusion..........................................................................................................v
References.................................................................................................................................vi
Appendix.................................................................................................................................viii
Paraphrase This Document
Need a fresh take? Get an instant paraphrase of this document with our AI Paraphraser
[Insert Your Last Name] ii
Memorandum
TO: Board of Directors
FROM:
DATE: April 21st, 2019
SUBJECT: Profit Maximization
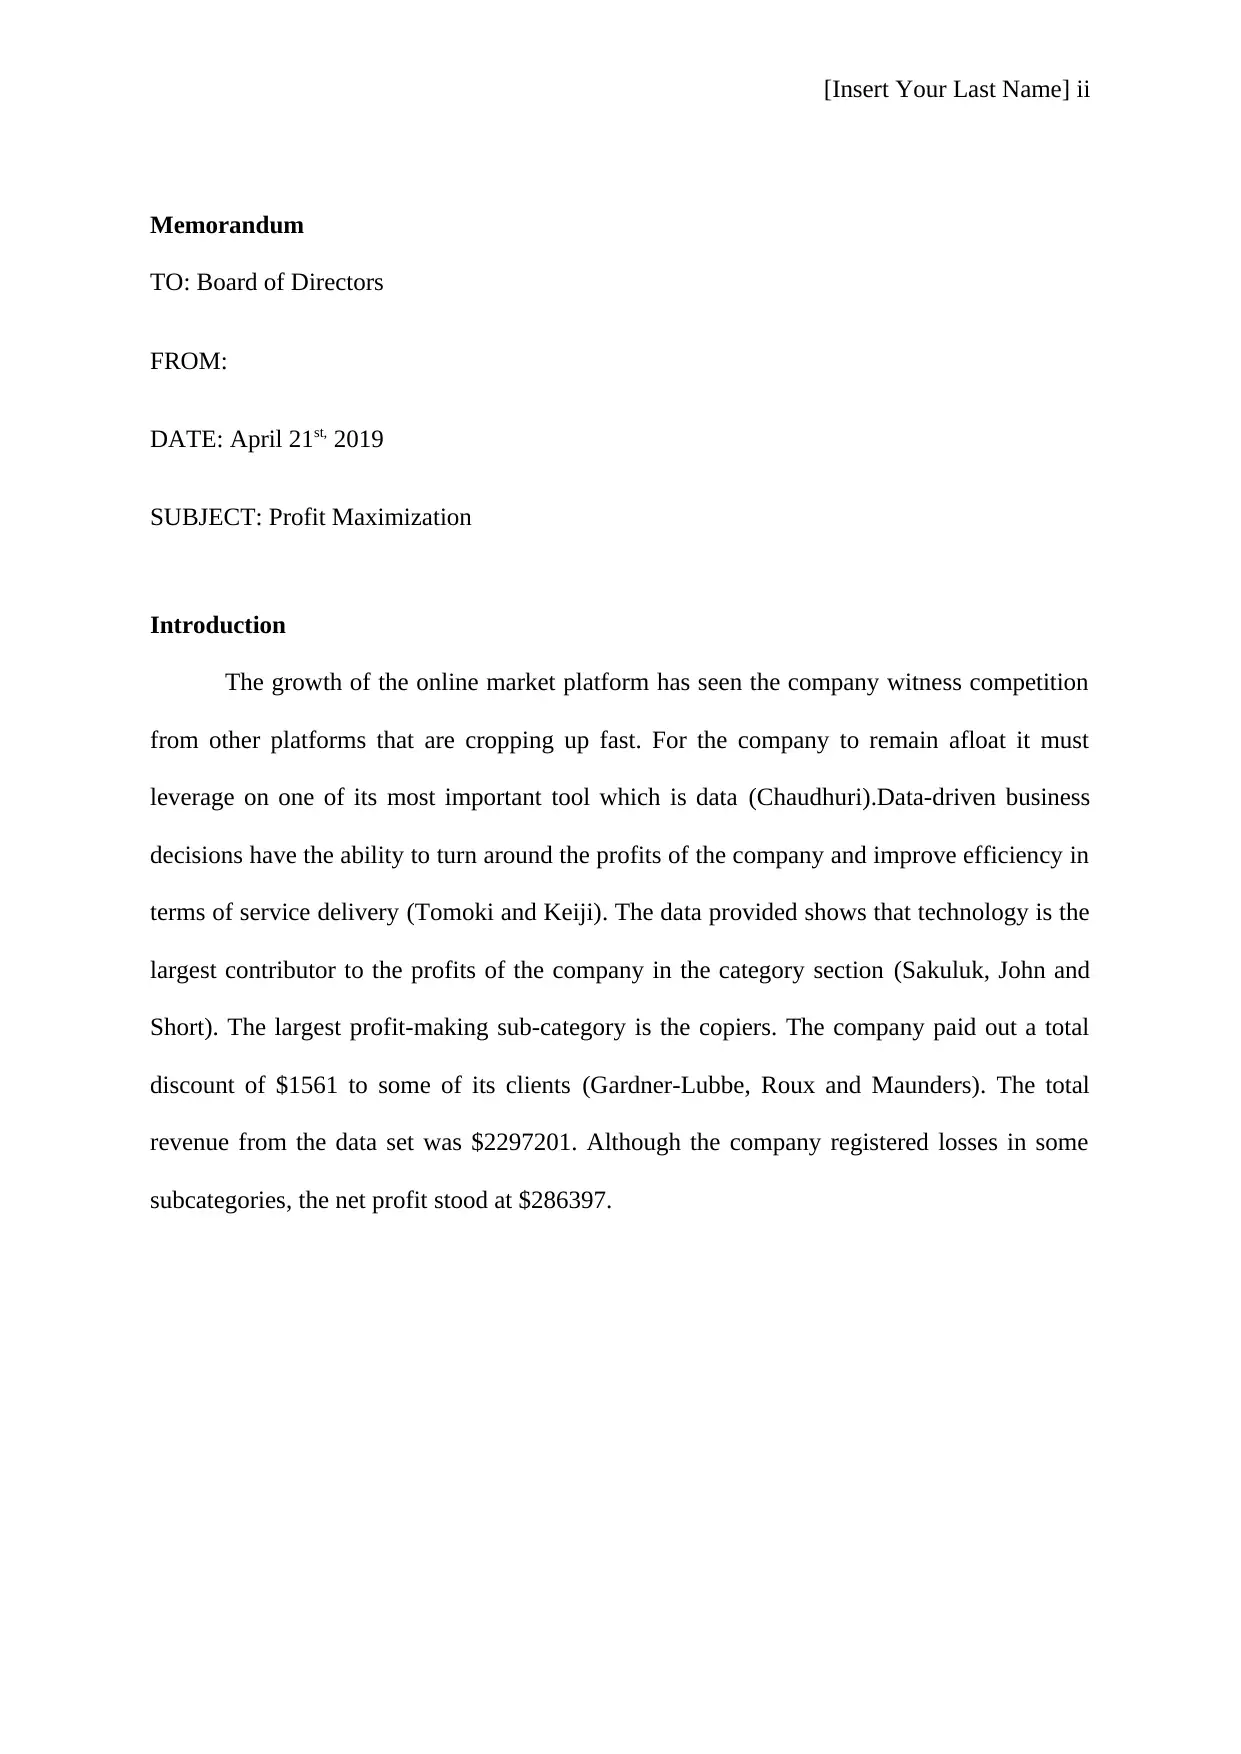
Introduction
The growth of the online market platform has seen the company witness competition
from other platforms that are cropping up fast. For the company to remain afloat it must
leverage on one of its most important tool which is data (Chaudhuri).Data-driven business
decisions have the ability to turn around the profits of the company and improve efficiency in
terms of service delivery (Tomoki and Keiji). The data provided shows that technology is the
largest contributor to the profits of the company in the category section (Sakuluk, John and
Short). The largest profit-making sub-category is the copiers. The company paid out a total
discount of $1561 to some of its clients (Gardner-Lubbe, Roux and Maunders). The total
revenue from the data set was $2297201. Although the company registered losses in some
subcategories, the net profit stood at $286397.
Memorandum
TO: Board of Directors
FROM:
DATE: April 21st, 2019
SUBJECT: Profit Maximization
Introduction
The growth of the online market platform has seen the company witness competition
from other platforms that are cropping up fast. For the company to remain afloat it must
leverage on one of its most important tool which is data (Chaudhuri).Data-driven business
decisions have the ability to turn around the profits of the company and improve efficiency in
terms of service delivery (Tomoki and Keiji). The data provided shows that technology is the
largest contributor to the profits of the company in the category section (Sakuluk, John and
Short). The largest profit-making sub-category is the copiers. The company paid out a total
discount of $1561 to some of its clients (Gardner-Lubbe, Roux and Maunders). The total
revenue from the data set was $2297201. Although the company registered losses in some
subcategories, the net profit stood at $286397.
[Insert Your Last Name] iii
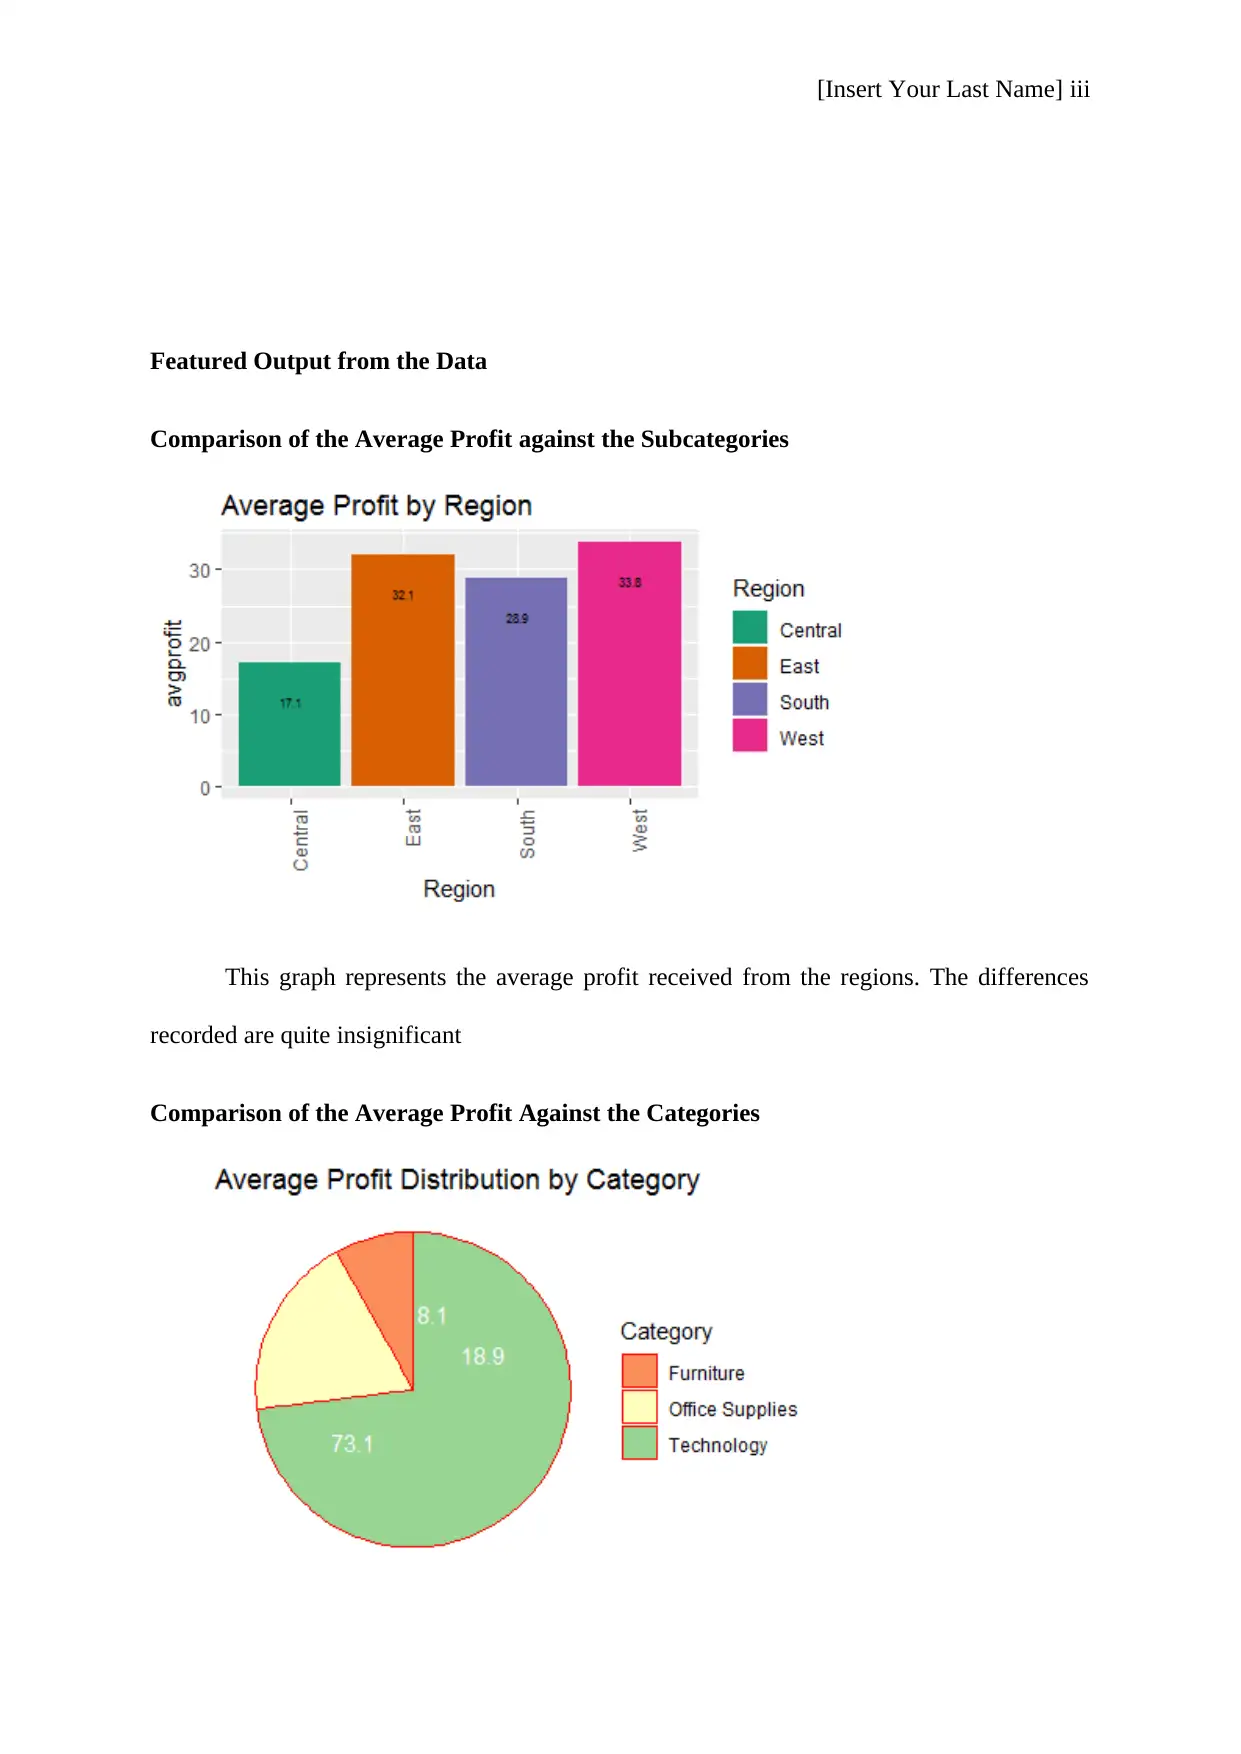
Featured Output from the Data
Comparison of the Average Profit against the Subcategories
This graph represents the average profit received from the regions. The differences
recorded are quite insignificant
Comparison of the Average Profit Against the Categories
Featured Output from the Data
Comparison of the Average Profit against the Subcategories
This graph represents the average profit received from the regions. The differences
recorded are quite insignificant
Comparison of the Average Profit Against the Categories
⊘ This is a preview!⊘
Do you want full access?
Subscribe today to unlock all pages.
Trusted by 1+ million students worldwide
[Insert Your Last Name] iv
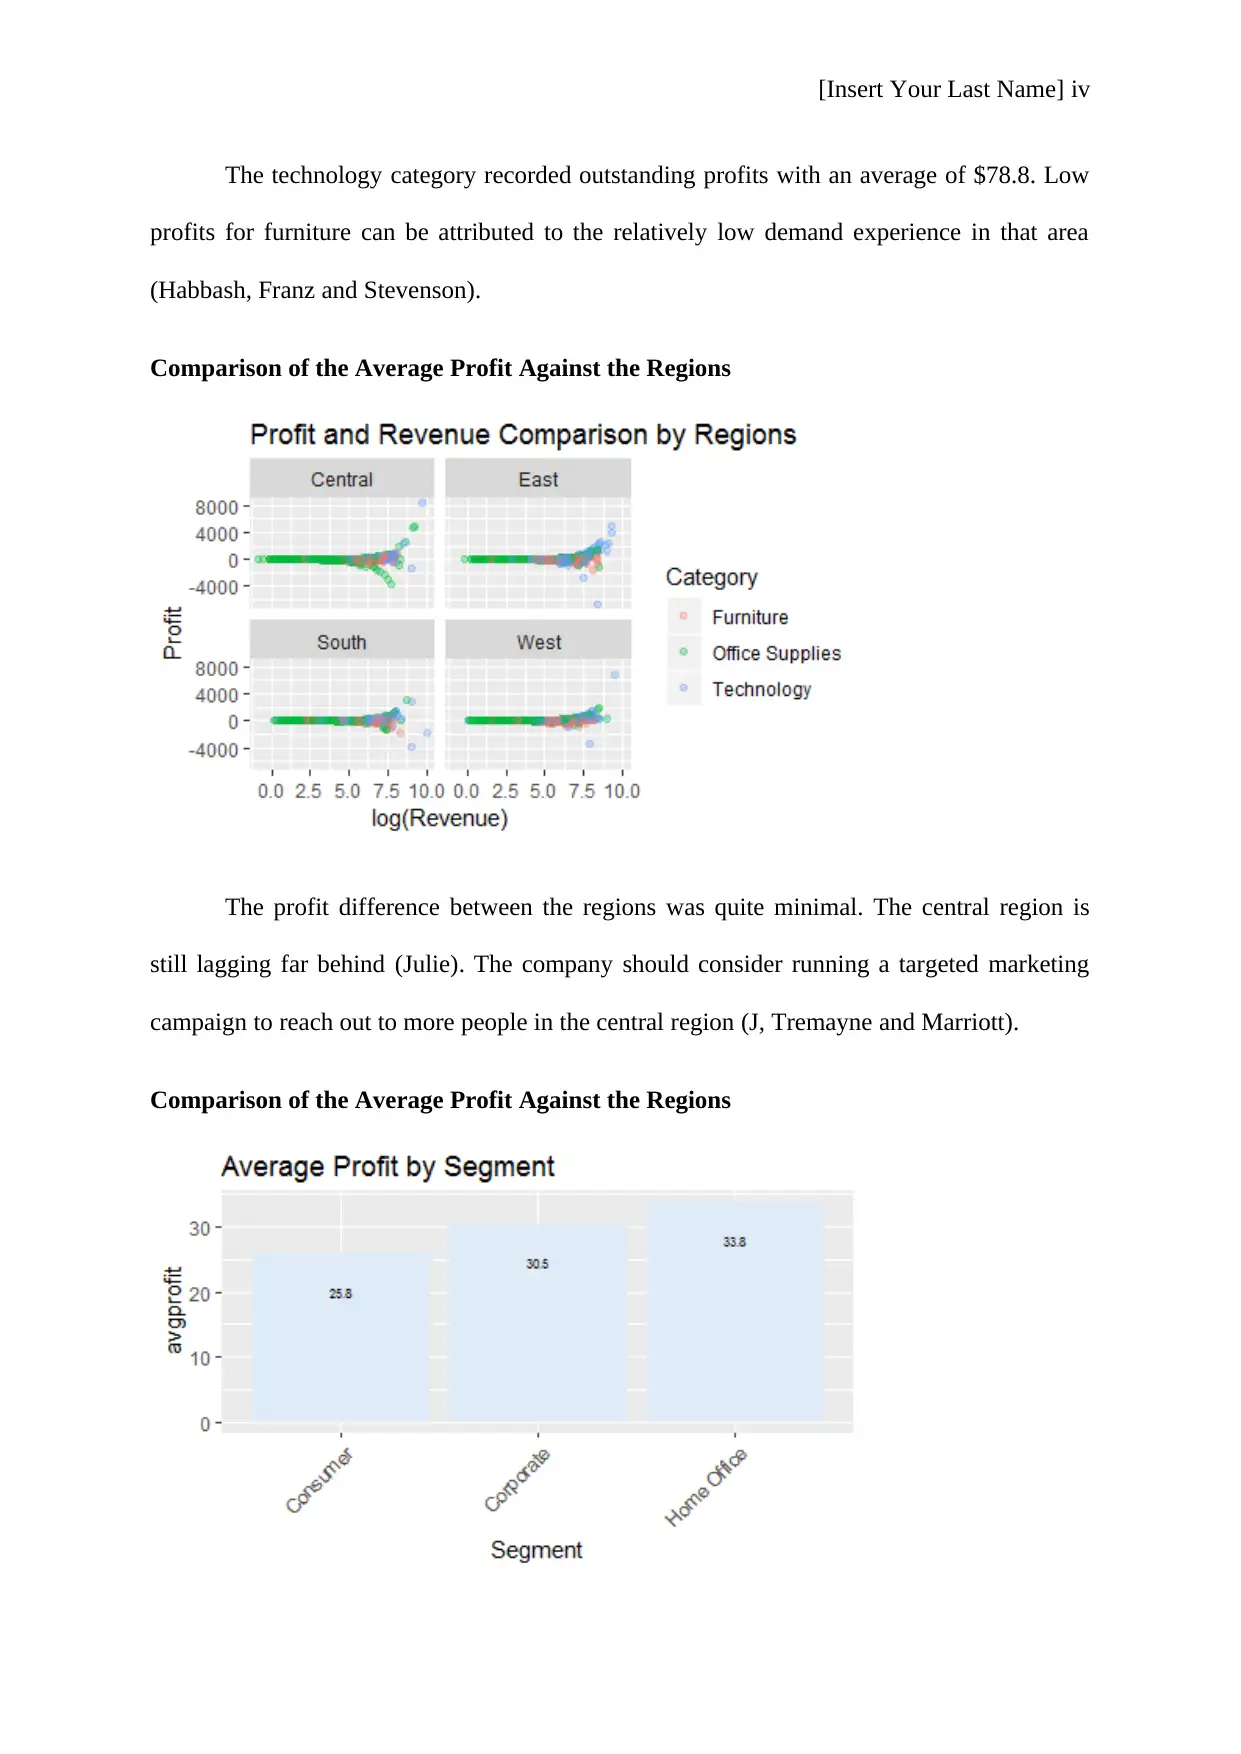
The technology category recorded outstanding profits with an average of $78.8. Low
profits for furniture can be attributed to the relatively low demand experience in that area
(Habbash, Franz and Stevenson).
Comparison of the Average Profit Against the Regions
The profit difference between the regions was quite minimal. The central region is
still lagging far behind (Julie). The company should consider running a targeted marketing
campaign to reach out to more people in the central region (J, Tremayne and Marriott).
Comparison of the Average Profit Against the Regions
Paraphrase This Document
Need a fresh take? Get an instant paraphrase of this document with our AI Paraphraser
[Insert Your Last Name] v
Variations within the segments were also quite insignificant. Though the data shows
the home offices registered the highest profits (Yuko and Shusaku).
Summary and Conclusion
The demand for items categorized as technology is high and this is attributed to the
advancement of technology in its entirety. Individuals are always trying to be at par with the
recent trends in the mobile and computing in the mobile and computing industry (Stephan).
The causal effect for the demand for copiers is yet to be established but clearly business is
booming in that area. Of concern to the business is the percentage of profit when compared to
the revenue. The profit stands at 12.46% of the revenue which is arguably a good margin to
the business. The recommendation to increase the profitability of the company from this data
set lies in; reducing the operational costs of the business by streamlining the operations
within the value chain; further, the company should invest more in products that are in the
technology category as the demand is projected to keep rising in the next few years; lastly,
the company should invest in improving the customer experience through mechanisms like
discounts and vouchers to loyal clients.
[Insert Your Last Name] vi
References
Chaudhuri, Surajit. “An Overview Of Business Intelligence Technology.” Communications
Of The ACM (2019): 2-9. Association For Computing Machinery (ACM.
Gardner-Lubbe, S, et al. “Biplot methodology in exploratory analysis of microarray data.”
The Journal of Statistical Analysis and Data Mining (2009): 6. Documnent.
Habbash, L Krause, A Franz and A Stevenson. “On the application of Exploratory Data
Analysis for characterization of space weather data sets.” Advances in Space
Research (2011): 1-9. Document.
J, C Naylor, A.R. Tremayne and J.M Marriott. “Exploratory data analysis and model
criticism with posterior plots.” Computational Statistics & Data Analysis (2010): 2-
14. Document.
Julie, Cidell. “Content clouds as exploratory qualitative data analysis.” The Journal of Area
(2010): 8. Document.
Morrison and A David. “Phylogenetic networks: a new form of multivariate data summary
for data mining and exploratory data analysis.” Wiley Interdisciplinary Reviews: Data
Mining and Knowledge Discovery (2014): 2-10. Document.
Sakuluk, et al. “A Methodological Review of Exploratory Factor Analysis in Sexuality
Research: Used Practices, Best Practices, and Data Analysis Resources.” The Journal
of Sex Research (2016): 6. Document.
Stephan, Morgenthaler. “Exploratory data analysis.” Wiley Interdisciplinary Reviews:
Computational Statistics (2009): 6. Document.
⊘ This is a preview!⊘
Do you want full access?
Subscribe today to unlock all pages.
Trusted by 1+ million students worldwide

[Insert Your Last Name] vii
Tomoki, Nakaya and Yano Keiji. “Visualising Crime Clusters in a Space-time Cube: An
Exploratory Data-analysis Approach Using Space-time Kernel Density Estimation
and Scan Statistics.” Transactions in GIS (2010): 9. Document.
Yuko, Tsumato and Tsumoto Shusaku. “Exploratory Univariate Analysis on the
Characterization of a University Hospital: A Preliminary Step to Data-Mining-Based
Hospital Management Using an Exploratory Univariate Analysis of a University
Hospital.” The Review of Socionetwork Strategies (2009): 7. Document.
Paraphrase This Document
Need a fresh take? Get an instant paraphrase of this document with our AI Paraphraser
[Insert Your Last Name] viii
Appendix
R Code
#loading the data
data<-read.csv("Office_Sales_Data (1).csv")
summary(data)
install.packages("tidyverse")
install.packages("DataExplorer")
library(DataExplorer)
library(tidyverse)
#check the type of variables in the data
plot_str(data)
#check missing data
plot_missing(data)
#check the distribution of the categorical variables within the data set
plot_bar(data)
data%>%
select(Ship.Mode,Segment, Quantity,Revenue,Discount,Profit)%>%
group_by(Segment)%>%

[Insert Your Last Name] ix
summarise(avgprofit=mean(Profit))
by_segment<-group_by(data, Segment)
summarise(by_segment, avg=mean(Profit))
hist(data$Profit)
library(RColorBrewer)
myColors<-brewer.pal(3,"Set1")
#data visualization
by_shipmode<-data%>%
select(Ship.Mode,Profit)%>%
group_by(Ship.Mode)%>%
summarise(avgprofit=mean(Profit))
ggplot(by_shipmode,aes(Ship.Mode,avgprofit,label=avgprofit,fill="color"))+
geom_bar(stat="identity",position = "dodge")+geom_text(size=2,vjust=4)+
ggtitle("Average Profit by Mode of Shipment")+
theme(axis.text.x = element_text(angle=45,vjust=1,hjust=1))+
scale_fill_brewer("Dark2",1)
display.brewer.all()
by_shipmode$avgprofit<-round(by_shipmode$avgprofit,1)
?scale_color_brewer
summarise(avgprofit=mean(Profit))
by_segment<-group_by(data, Segment)
summarise(by_segment, avg=mean(Profit))
hist(data$Profit)
library(RColorBrewer)
myColors<-brewer.pal(3,"Set1")
#data visualization
by_shipmode<-data%>%
select(Ship.Mode,Profit)%>%
group_by(Ship.Mode)%>%
summarise(avgprofit=mean(Profit))
ggplot(by_shipmode,aes(Ship.Mode,avgprofit,label=avgprofit,fill="color"))+
geom_bar(stat="identity",position = "dodge")+geom_text(size=2,vjust=4)+
ggtitle("Average Profit by Mode of Shipment")+
theme(axis.text.x = element_text(angle=45,vjust=1,hjust=1))+
scale_fill_brewer("Dark2",1)
display.brewer.all()
by_shipmode$avgprofit<-round(by_shipmode$avgprofit,1)
?scale_color_brewer
⊘ This is a preview!⊘
Do you want full access?
Subscribe today to unlock all pages.
Trusted by 1+ million students worldwide

[Insert Your Last Name] x
by_region<-data%>%
select(Region,Profit)%>%
group_by(Region)%>%
summarise(avgprofit=mean(Profit))
ggplot(by_region,aes(Region,avgprofit,label=avgprofit))+
geom_bar(stat="identity")+geom_text(size=2,vjust=4)
by_region$avgprofit<-round(by_region$avgprofit,1)
by_segment<-data%>%
select(Segment,Profit)%>%
group_by(Segment)%>%
summarise(avgprofit=mean(Profit))
by_segment$avgprofit<-round(by_segment$avgprofit,1)
ggplot(by_segment,aes(Segment,avgprofit,label=avgprofit,fill="color"))+
geom_bar(stat="identity",position = "dodge")+geom_text(size=2,vjust=4)+
ggtitle("Average Profit by Segment")+
theme(axis.text.x = element_text(angle=45,vjust=1,hjust=1))+
scale_fill_brewer(palette = "Dark2",1)
by_category<-data%>%
Paraphrase This Document
Need a fresh take? Get an instant paraphrase of this document with our AI Paraphraser
[Insert Your Last Name] xi
select(Category,Profit)%>%
group_by(Category)%>%
summarise(avgprofit=mean(Profit))%>%
by_category$avgprofit<-round(by_category$avgprofit,1)
sum(by_category$avgprofit)
prop<-round((c(by_category$avgprofit)/sum(by_category$avgprofit))*100,1)
sum(prop)
by_category%>%
mutate(lab.ypos=cumsum(prop)-0.5*prop)
by_category
pie<-ggplot(by_category,aes("",prop,label="Category",fill="Category"))+
geom_bar(width=1,stat="identity",color="White")
pie+coord_polar("y",start=0)+
geom_text(aes(y=(cumsum(prop)-0.5*prop), label=Category),color="white")+
theme_void()+
scale_fill_brewer(palette = "Spectral")+
ggtitle("Average Profit Distribution by Category")
[Insert Your Last Name] xii
by_subcategory<-data%>%
select(Sub.Category,Profit)%>%
group_by(Sub.Category)%>%
summarise(avgprofit=mean(Profit))
by_subcategory$avgprofit<-round(by_subcategory$avgprofit,1)
ggplot(by_subcategory,aes(Sub.Category,avgprofit,label=avgprofit,fill="color"))+
geom_bar(stat="identity",position = "dodge")+geom_text(size=2)+
ggtitle("Average Profit by Sub Category")+
theme(axis.text.x = element_text(angle=90,hjust=1))+
scale_fill_brewer(palette = "Dark2",1)
client<-data%>%
select(Customer.ID,Revenue)%>%
group_by((Customer.ID))%>%
summarise(avgrevenue=mean(Revenue))
max(client$avgrevenue)
min(client$avgrevenue)
sum(client$avgrevenue)
sum(data$Revenue)
sum(data$Profit)/sum(data$Revenue)
⊘ This is a preview!⊘
Do you want full access?
Subscribe today to unlock all pages.
Trusted by 1+ million students worldwide
1 out of 13

Your All-in-One AI-Powered Toolkit for Academic Success.
+13062052269
info@desklib.com
Available 24*7 on WhatsApp / Email
![[object Object]](/_next/static/media/star-bottom.7253800d.svg)
Unlock your academic potential
Copyright © 2020–2026 A2Z Services. All Rights Reserved. Developed and managed by ZUCOL.