SPC & SQC in Manufacturing: Control Chart Implementation & Analysis
VerifiedAdded on 2023/06/16
|12
|3879
|245
Report
AI Summary
This report assesses the application of Statistical Process Control (SPC) and Statistical Quality Control (SQC) through control charts in a manufacturing setting, specifically focusing on the measurement of bearing housing box lengths. The analysis includes the creation and interpretation of Shewhart control charts (X-bar and R-bar) and Cumulative Sum (CUSUM) charts to identify variations in the manufacturing process. The report evaluates process capability using CP, CPU, and CPL indices, determining whether the process meets customer specifications. Additionally, it addresses the importance of measurement accuracy, bias, and stability in the measurement system, providing a comprehensive overview of how control charts and statistical methods can be used to monitor and improve quality in manufacturing. The report concludes that while the process is currently capable, continuous monitoring and analysis are essential to maintain quality standards and prevent deviations.

Control Chart
1 | P a g e
Use of SPC and SQC in
manufacturing
1 | P a g e
Use of SPC and SQC in
manufacturing
Paraphrase This Document
Need a fresh take? Get an instant paraphrase of this document with our AI Paraphraser
Control Chart
Contents
PART-A...........................................................................................................................................3
Solution I)....................................................................................................................................3
Solution ii)...................................................................................................................................6
Solution iii)..................................................................................................................................7
Solution iv)..................................................................................................................................7
PART-B...........................................................................................................................................9
Solution I)....................................................................................................................................9
Conclusion.....................................................................................................................................10
References......................................................................................................................................11
2 | P a g e
Control Chart
PART-A
Solution I)
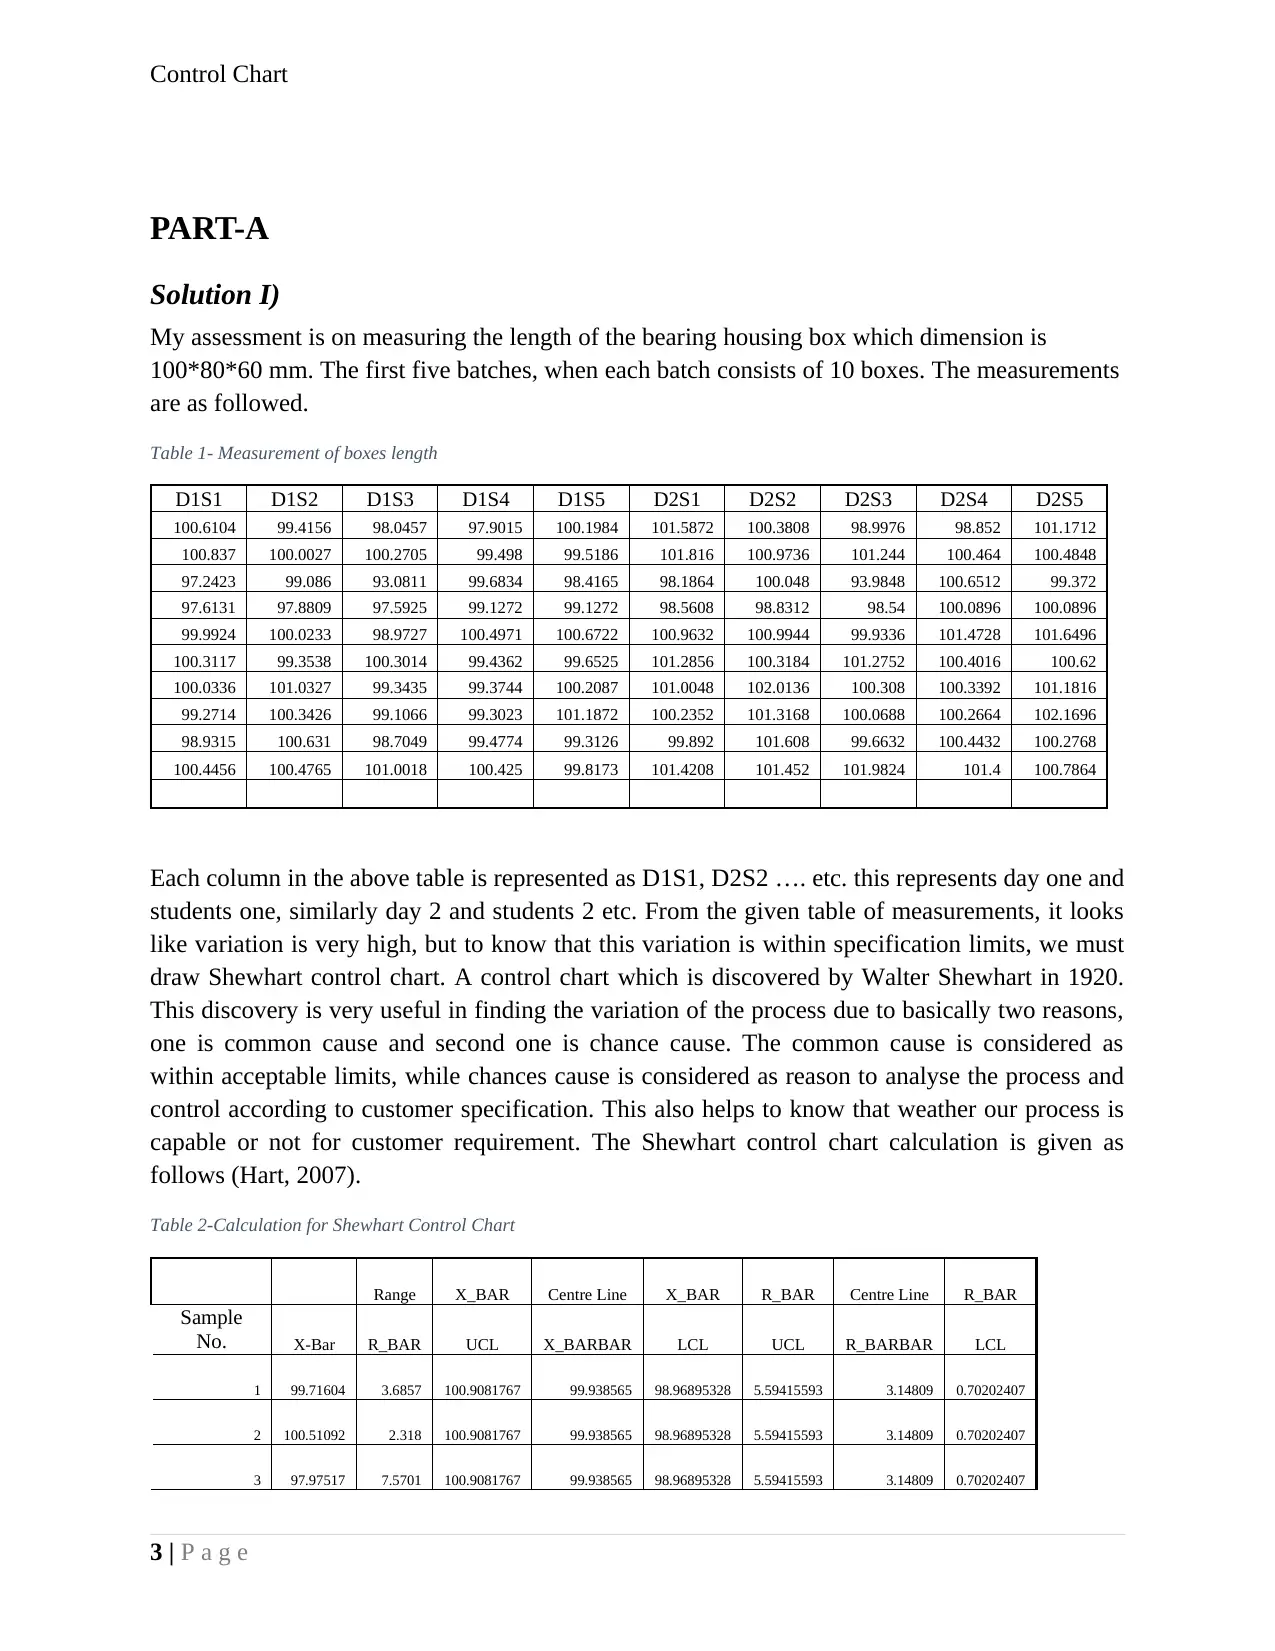
My assessment is on measuring the length of the bearing housing box which dimension is
100*80*60 mm. The first five batches, when each batch consists of 10 boxes. The measurements
are as followed.
Table 1- Measurement of boxes length
D1S1 D1S2 D1S3 D1S4 D1S5 D2S1 D2S2 D2S3 D2S4 D2S5
100.6104 99.4156 98.0457 97.9015 100.1984 101.5872 100.3808 98.9976 98.852 101.1712
100.837 100.0027 100.2705 99.498 99.5186 101.816 100.9736 101.244 100.464 100.4848
97.2423 99.086 93.0811 99.6834 98.4165 98.1864 100.048 93.9848 100.6512 99.372
97.6131 97.8809 97.5925 99.1272 99.1272 98.5608 98.8312 98.54 100.0896 100.0896
99.9924 100.0233 98.9727 100.4971 100.6722 100.9632 100.9944 99.9336 101.4728 101.6496
100.3117 99.3538 100.3014 99.4362 99.6525 101.2856 100.3184 101.2752 100.4016 100.62
100.0336 101.0327 99.3435 99.3744 100.2087 101.0048 102.0136 100.308 100.3392 101.1816
99.2714 100.3426 99.1066 99.3023 101.1872 100.2352 101.3168 100.0688 100.2664 102.1696
98.9315 100.631 98.7049 99.4774 99.3126 99.892 101.608 99.6632 100.4432 100.2768
100.4456 100.4765 101.0018 100.425 99.8173 101.4208 101.452 101.9824 101.4 100.7864
Each column in the above table is represented as D1S1, D2S2 …. etc. this represents day one and
students one, similarly day 2 and students 2 etc. From the given table of measurements, it looks
like variation is very high, but to know that this variation is within specification limits, we must
draw Shewhart control chart. A control chart which is discovered by Walter Shewhart in 1920.
This discovery is very useful in finding the variation of the process due to basically two reasons,
one is common cause and second one is chance cause. The common cause is considered as
within acceptable limits, while chances cause is considered as reason to analyse the process and
control according to customer specification. This also helps to know that weather our process is
capable or not for customer requirement. The Shewhart control chart calculation is given as
follows (Hart, 2007).
Table 2-Calculation for Shewhart Control Chart
Range X_BAR Centre Line X_BAR R_BAR Centre Line R_BAR
Sample
No. X-Bar R_BAR UCL X_BARBAR LCL UCL R_BARBAR LCL
1 99.71604 3.6857 100.9081767 99.938565 98.96895328 5.59415593 3.14809 0.70202407
2 100.51092 2.318 100.9081767 99.938565 98.96895328 5.59415593 3.14809 0.70202407
3 97.97517 7.5701 100.9081767 99.938565 98.96895328 5.59415593 3.14809 0.70202407
3 | P a g e
PART-A
Solution I)
My assessment is on measuring the length of the bearing housing box which dimension is
100*80*60 mm. The first five batches, when each batch consists of 10 boxes. The measurements
are as followed.
Table 1- Measurement of boxes length
D1S1 D1S2 D1S3 D1S4 D1S5 D2S1 D2S2 D2S3 D2S4 D2S5
100.6104 99.4156 98.0457 97.9015 100.1984 101.5872 100.3808 98.9976 98.852 101.1712
100.837 100.0027 100.2705 99.498 99.5186 101.816 100.9736 101.244 100.464 100.4848
97.2423 99.086 93.0811 99.6834 98.4165 98.1864 100.048 93.9848 100.6512 99.372
97.6131 97.8809 97.5925 99.1272 99.1272 98.5608 98.8312 98.54 100.0896 100.0896
99.9924 100.0233 98.9727 100.4971 100.6722 100.9632 100.9944 99.9336 101.4728 101.6496
100.3117 99.3538 100.3014 99.4362 99.6525 101.2856 100.3184 101.2752 100.4016 100.62
100.0336 101.0327 99.3435 99.3744 100.2087 101.0048 102.0136 100.308 100.3392 101.1816
99.2714 100.3426 99.1066 99.3023 101.1872 100.2352 101.3168 100.0688 100.2664 102.1696
98.9315 100.631 98.7049 99.4774 99.3126 99.892 101.608 99.6632 100.4432 100.2768
100.4456 100.4765 101.0018 100.425 99.8173 101.4208 101.452 101.9824 101.4 100.7864
Each column in the above table is represented as D1S1, D2S2 …. etc. this represents day one and
students one, similarly day 2 and students 2 etc. From the given table of measurements, it looks
like variation is very high, but to know that this variation is within specification limits, we must
draw Shewhart control chart. A control chart which is discovered by Walter Shewhart in 1920.
This discovery is very useful in finding the variation of the process due to basically two reasons,
one is common cause and second one is chance cause. The common cause is considered as
within acceptable limits, while chances cause is considered as reason to analyse the process and
control according to customer specification. This also helps to know that weather our process is
capable or not for customer requirement. The Shewhart control chart calculation is given as
follows (Hart, 2007).
Table 2-Calculation for Shewhart Control Chart
Range X_BAR Centre Line X_BAR R_BAR Centre Line R_BAR
Sample
No. X-Bar R_BAR UCL X_BARBAR LCL UCL R_BARBAR LCL
1 99.71604 3.6857 100.9081767 99.938565 98.96895328 5.59415593 3.14809 0.70202407
2 100.51092 2.318 100.9081767 99.938565 98.96895328 5.59415593 3.14809 0.70202407
3 97.97517 7.5701 100.9081767 99.938565 98.96895328 5.59415593 3.14809 0.70202407
3 | P a g e
⊘ This is a preview!⊘
Do you want full access?
Subscribe today to unlock all pages.
Trusted by 1+ million students worldwide
Control Chart
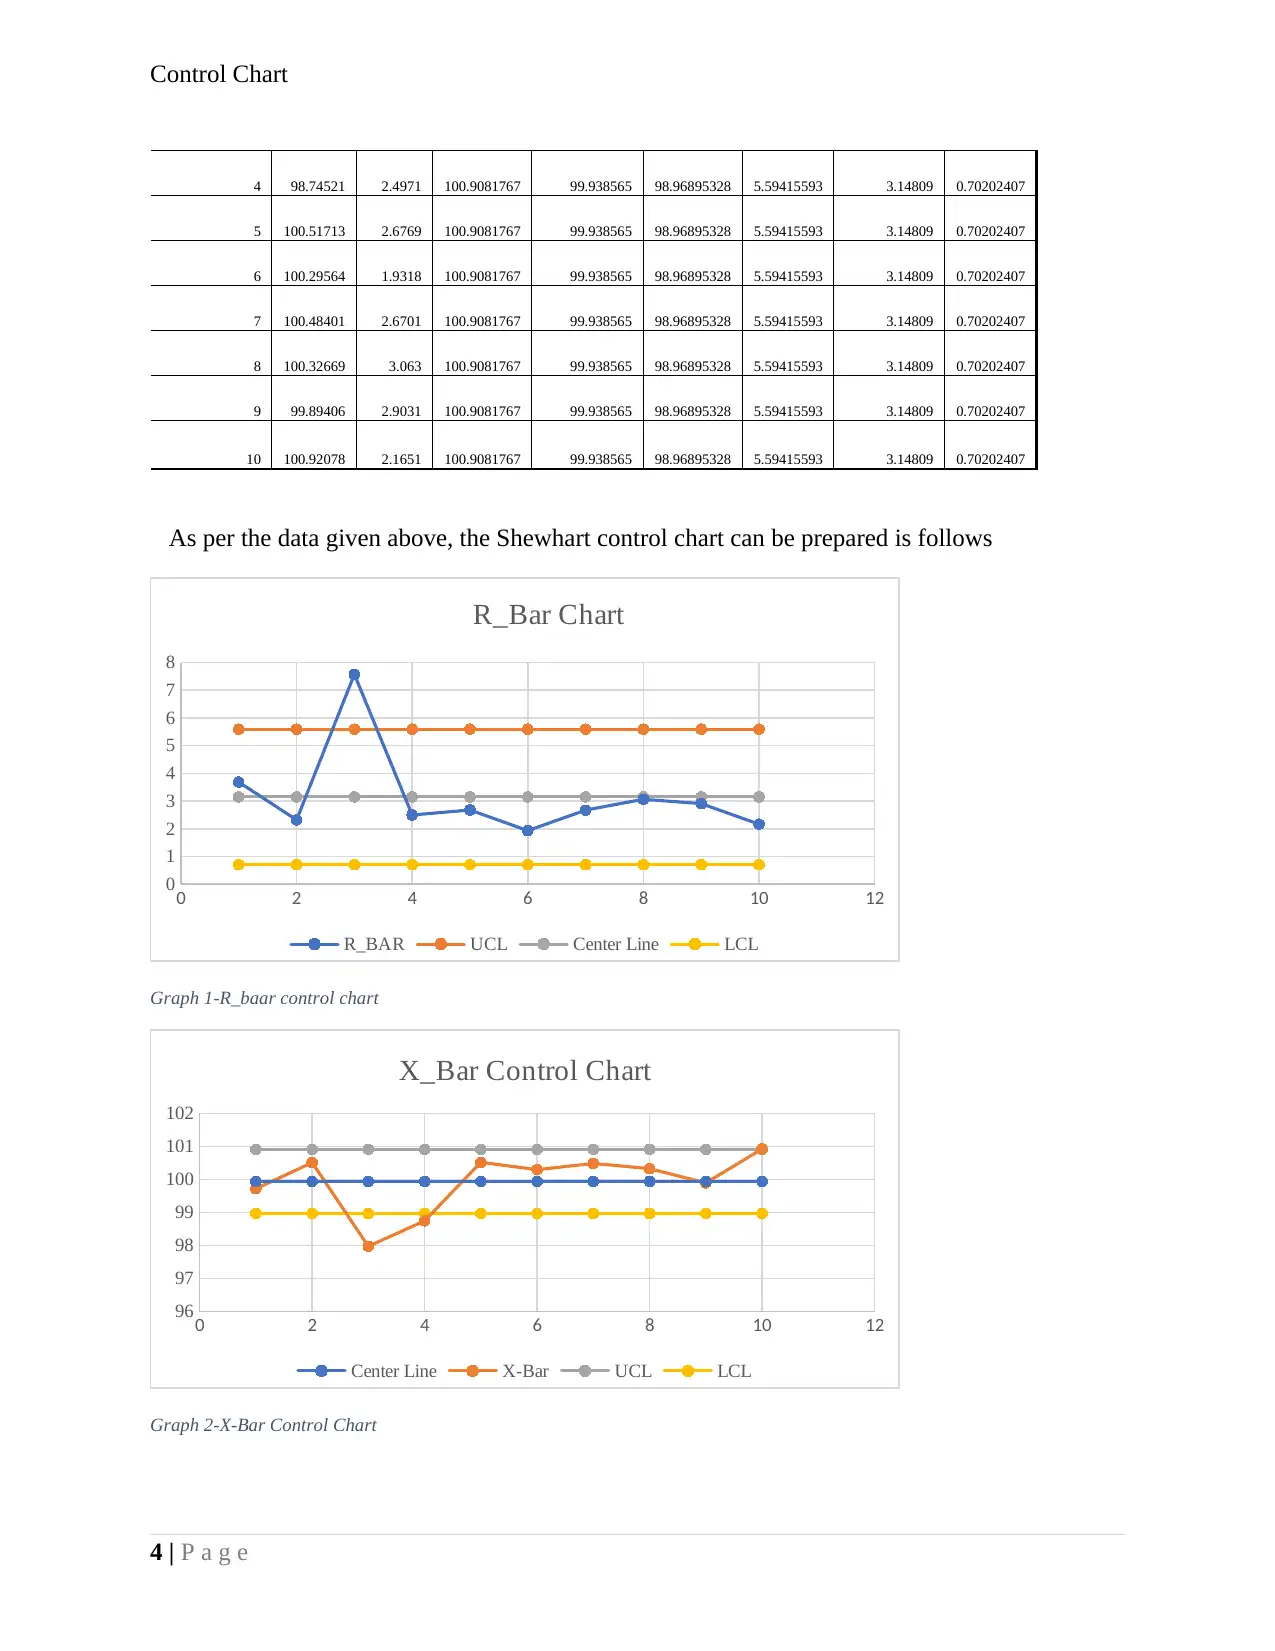
4 98.74521 2.4971 100.9081767 99.938565 98.96895328 5.59415593 3.14809 0.70202407
5 100.51713 2.6769 100.9081767 99.938565 98.96895328 5.59415593 3.14809 0.70202407
6 100.29564 1.9318 100.9081767 99.938565 98.96895328 5.59415593 3.14809 0.70202407
7 100.48401 2.6701 100.9081767 99.938565 98.96895328 5.59415593 3.14809 0.70202407
8 100.32669 3.063 100.9081767 99.938565 98.96895328 5.59415593 3.14809 0.70202407
9 99.89406 2.9031 100.9081767 99.938565 98.96895328 5.59415593 3.14809 0.70202407
10 100.92078 2.1651 100.9081767 99.938565 98.96895328 5.59415593 3.14809 0.70202407
As per the data given above, the Shewhart control chart can be prepared is follows
0 2 4 6 8 10 12
0
1
2
3
4
5
6
7
8
R_Bar Chart
R_BAR UCL Center Line LCL
Graph 1-R_baar control chart
0 2 4 6 8 10 12
96
97
98
99
100
101
102
X_Bar Control Chart
Center Line X-Bar UCL LCL
Graph 2-X-Bar Control Chart
4 | P a g e
Paraphrase This Document
Need a fresh take? Get an instant paraphrase of this document with our AI Paraphraser
Control Chart
As per graph given above, R-bar and X-bar chart, is given with upper and lower control limit are
provided, X-bar is the average of dimension measurement by 5 different students in both day,
while R-bar is the range between highest and lowest between the above condition of data.
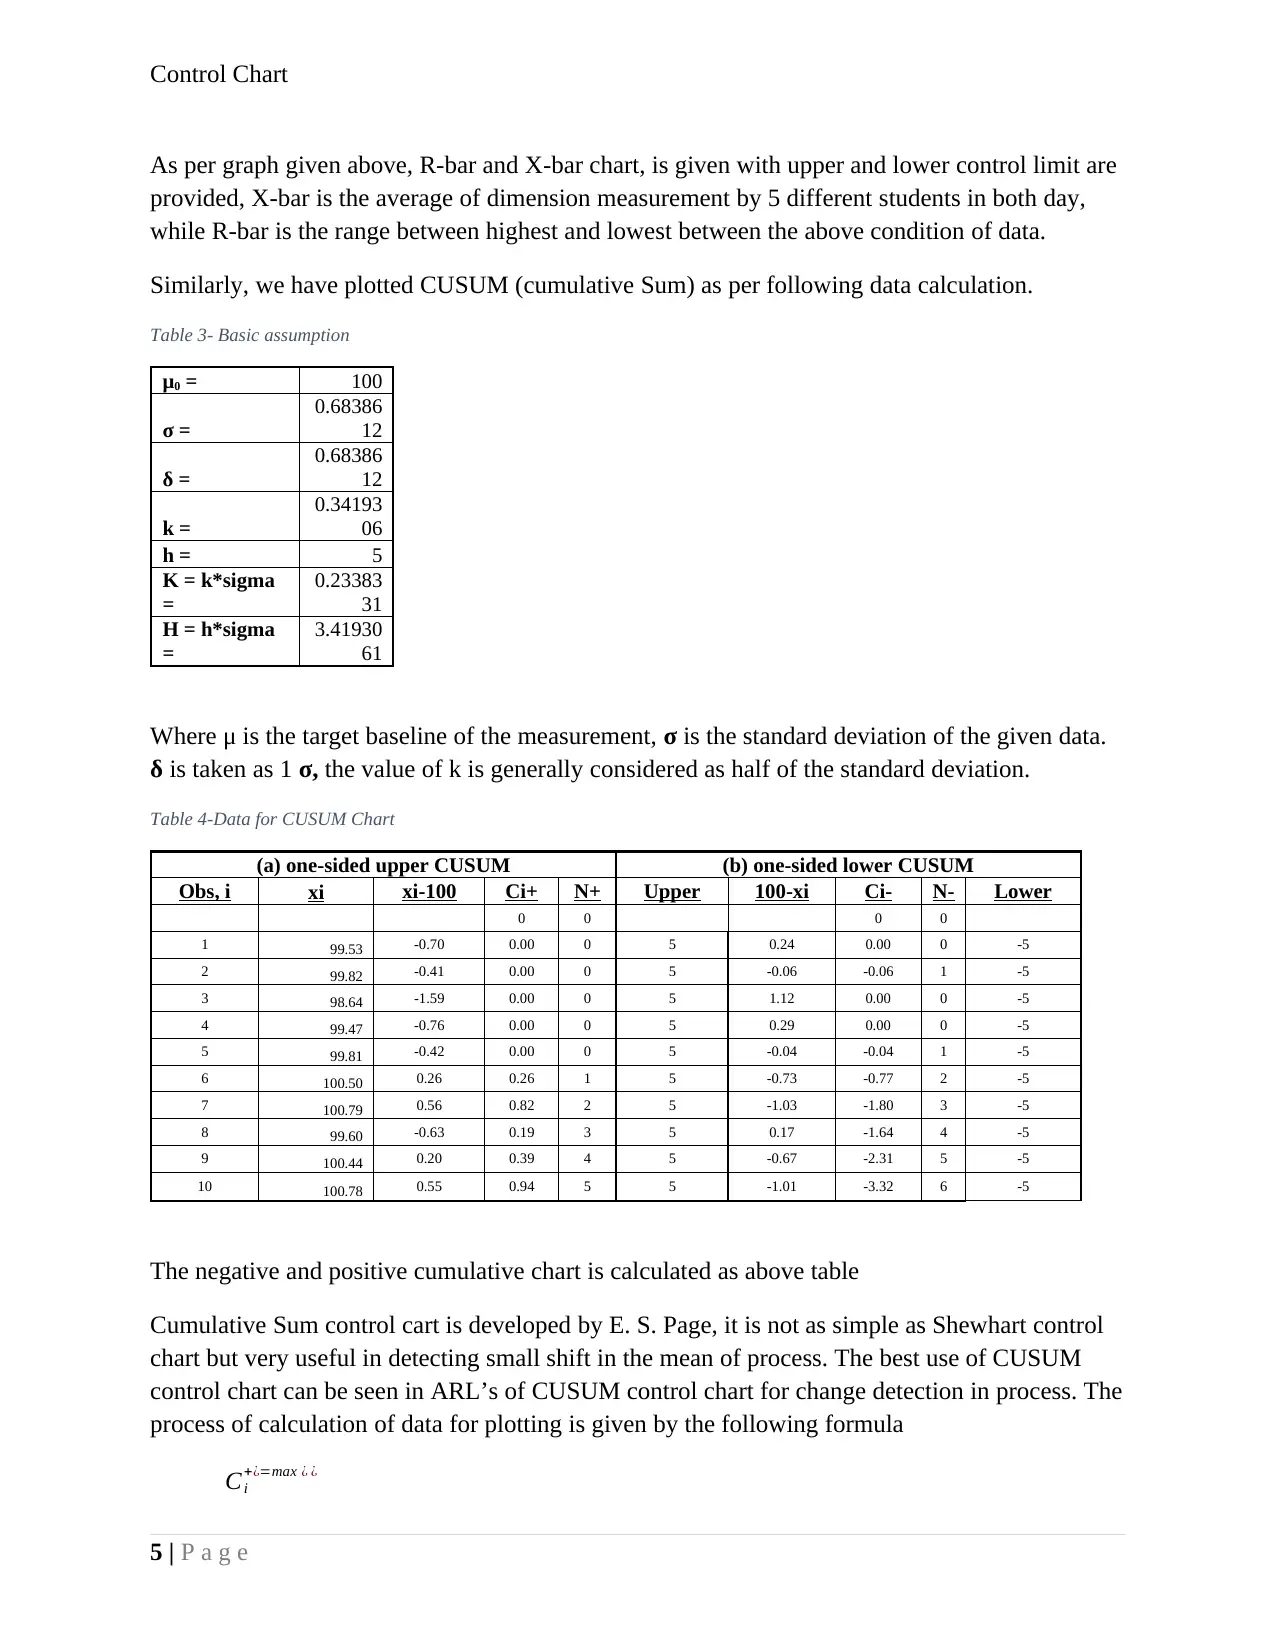
Similarly, we have plotted CUSUM (cumulative Sum) as per following data calculation.
Table 3- Basic assumption
μ0 = 100
σ =
0.68386
12
δ =
0.68386
12
k =
0.34193
06
h = 5
K = k*sigma
=
0.23383
31
H = h*sigma
=
3.41930
61
Where μ is the target baseline of the measurement, σ is the standard deviation of the given data.
δ is taken as 1 σ, the value of k is generally considered as half of the standard deviation.
Table 4-Data for CUSUM Chart
(a) one-sided upper CUSUM (b) one-sided lower CUSUM
Obs, i xi xi-100 Ci+ N+ Upper 100-xi Ci- N- Lower
0 0 0 0
1 99.53 -0.70 0.00 0 5 0.24 0.00 0 -5
2 99.82 -0.41 0.00 0 5 -0.06 -0.06 1 -5
3 98.64 -1.59 0.00 0 5 1.12 0.00 0 -5
4 99.47 -0.76 0.00 0 5 0.29 0.00 0 -5
5 99.81 -0.42 0.00 0 5 -0.04 -0.04 1 -5
6 100.50 0.26 0.26 1 5 -0.73 -0.77 2 -5
7 100.79 0.56 0.82 2 5 -1.03 -1.80 3 -5
8 99.60 -0.63 0.19 3 5 0.17 -1.64 4 -5
9 100.44 0.20 0.39 4 5 -0.67 -2.31 5 -5
10 100.78 0.55 0.94 5 5 -1.01 -3.32 6 -5
The negative and positive cumulative chart is calculated as above table
Cumulative Sum control cart is developed by E. S. Page, it is not as simple as Shewhart control
chart but very useful in detecting small shift in the mean of process. The best use of CUSUM
control chart can be seen in ARL’s of CUSUM control chart for change detection in process. The
process of calculation of data for plotting is given by the following formula
Ci
+¿=max ¿ ¿
5 | P a g e
As per graph given above, R-bar and X-bar chart, is given with upper and lower control limit are
provided, X-bar is the average of dimension measurement by 5 different students in both day,
while R-bar is the range between highest and lowest between the above condition of data.
Similarly, we have plotted CUSUM (cumulative Sum) as per following data calculation.
Table 3- Basic assumption
μ0 = 100
σ =
0.68386
12
δ =
0.68386
12
k =
0.34193
06
h = 5
K = k*sigma
=
0.23383
31
H = h*sigma
=
3.41930
61
Where μ is the target baseline of the measurement, σ is the standard deviation of the given data.
δ is taken as 1 σ, the value of k is generally considered as half of the standard deviation.
Table 4-Data for CUSUM Chart
(a) one-sided upper CUSUM (b) one-sided lower CUSUM
Obs, i xi xi-100 Ci+ N+ Upper 100-xi Ci- N- Lower
0 0 0 0
1 99.53 -0.70 0.00 0 5 0.24 0.00 0 -5
2 99.82 -0.41 0.00 0 5 -0.06 -0.06 1 -5
3 98.64 -1.59 0.00 0 5 1.12 0.00 0 -5
4 99.47 -0.76 0.00 0 5 0.29 0.00 0 -5
5 99.81 -0.42 0.00 0 5 -0.04 -0.04 1 -5
6 100.50 0.26 0.26 1 5 -0.73 -0.77 2 -5
7 100.79 0.56 0.82 2 5 -1.03 -1.80 3 -5
8 99.60 -0.63 0.19 3 5 0.17 -1.64 4 -5
9 100.44 0.20 0.39 4 5 -0.67 -2.31 5 -5
10 100.78 0.55 0.94 5 5 -1.01 -3.32 6 -5
The negative and positive cumulative chart is calculated as above table
Cumulative Sum control cart is developed by E. S. Page, it is not as simple as Shewhart control
chart but very useful in detecting small shift in the mean of process. The best use of CUSUM
control chart can be seen in ARL’s of CUSUM control chart for change detection in process. The
process of calculation of data for plotting is given by the following formula
Ci
+¿=max ¿ ¿
5 | P a g e
Control Chart
Ci
−¿=min ¿¿
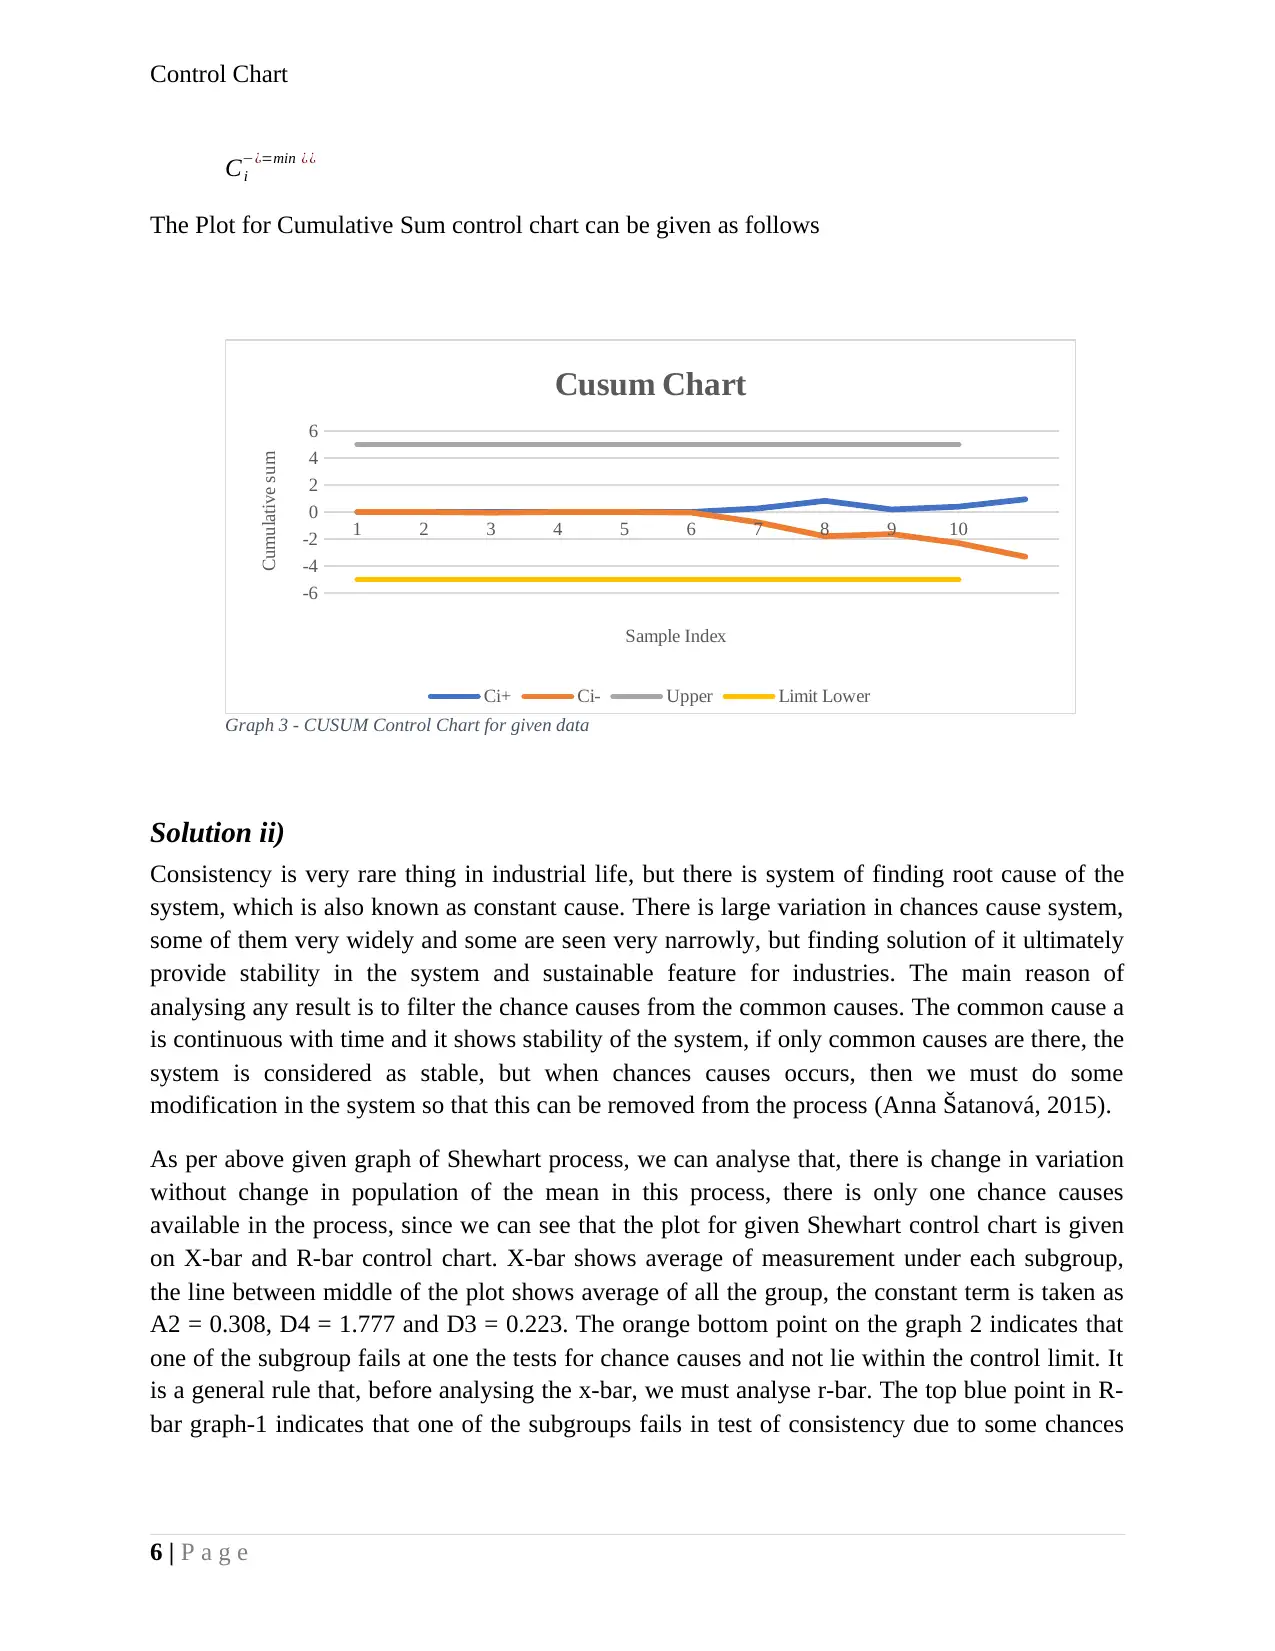
The Plot for Cumulative Sum control chart can be given as follows
1 2 3 4 5 6 7 8 9 10
-6
-4
-2
0
2
4
6
Cusum Chart
Ci+ Ci- Upper Limit Lower
Sample Index
Cumulative sum
Graph 3 - CUSUM Control Chart for given data
Solution ii)
Consistency is very rare thing in industrial life, but there is system of finding root cause of the
system, which is also known as constant cause. There is large variation in chances cause system,
some of them very widely and some are seen very narrowly, but finding solution of it ultimately
provide stability in the system and sustainable feature for industries. The main reason of
analysing any result is to filter the chance causes from the common causes. The common cause a
is continuous with time and it shows stability of the system, if only common causes are there, the
system is considered as stable, but when chances causes occurs, then we must do some
modification in the system so that this can be removed from the process (Anna Šatanová, 2015).
As per above given graph of Shewhart process, we can analyse that, there is change in variation
without change in population of the mean in this process, there is only one chance causes
available in the process, since we can see that the plot for given Shewhart control chart is given
on X-bar and R-bar control chart. X-bar shows average of measurement under each subgroup,
the line between middle of the plot shows average of all the group, the constant term is taken as
A2 = 0.308, D4 = 1.777 and D3 = 0.223. The orange bottom point on the graph 2 indicates that
one of the subgroup fails at one the tests for chance causes and not lie within the control limit. It
is a general rule that, before analysing the x-bar, we must analyse r-bar. The top blue point in R-
bar graph-1 indicates that one of the subgroups fails in test of consistency due to some chances
6 | P a g e
Ci
−¿=min ¿¿
The Plot for Cumulative Sum control chart can be given as follows
1 2 3 4 5 6 7 8 9 10
-6
-4
-2
0
2
4
6
Cusum Chart
Ci+ Ci- Upper Limit Lower
Sample Index
Cumulative sum
Graph 3 - CUSUM Control Chart for given data
Solution ii)
Consistency is very rare thing in industrial life, but there is system of finding root cause of the
system, which is also known as constant cause. There is large variation in chances cause system,
some of them very widely and some are seen very narrowly, but finding solution of it ultimately
provide stability in the system and sustainable feature for industries. The main reason of
analysing any result is to filter the chance causes from the common causes. The common cause a
is continuous with time and it shows stability of the system, if only common causes are there, the
system is considered as stable, but when chances causes occurs, then we must do some
modification in the system so that this can be removed from the process (Anna Šatanová, 2015).
As per above given graph of Shewhart process, we can analyse that, there is change in variation
without change in population of the mean in this process, there is only one chance causes
available in the process, since we can see that the plot for given Shewhart control chart is given
on X-bar and R-bar control chart. X-bar shows average of measurement under each subgroup,
the line between middle of the plot shows average of all the group, the constant term is taken as
A2 = 0.308, D4 = 1.777 and D3 = 0.223. The orange bottom point on the graph 2 indicates that
one of the subgroup fails at one the tests for chance causes and not lie within the control limit. It
is a general rule that, before analysing the x-bar, we must analyse r-bar. The top blue point in R-
bar graph-1 indicates that one of the subgroups fails in test of consistency due to some chances
6 | P a g e
⊘ This is a preview!⊘
Do you want full access?
Subscribe today to unlock all pages.
Trusted by 1+ million students worldwide
Control Chart
cause in the system. If such chance causes are so many times in the plot, we must consider
rework om process and try to find out the root cause of the problem.
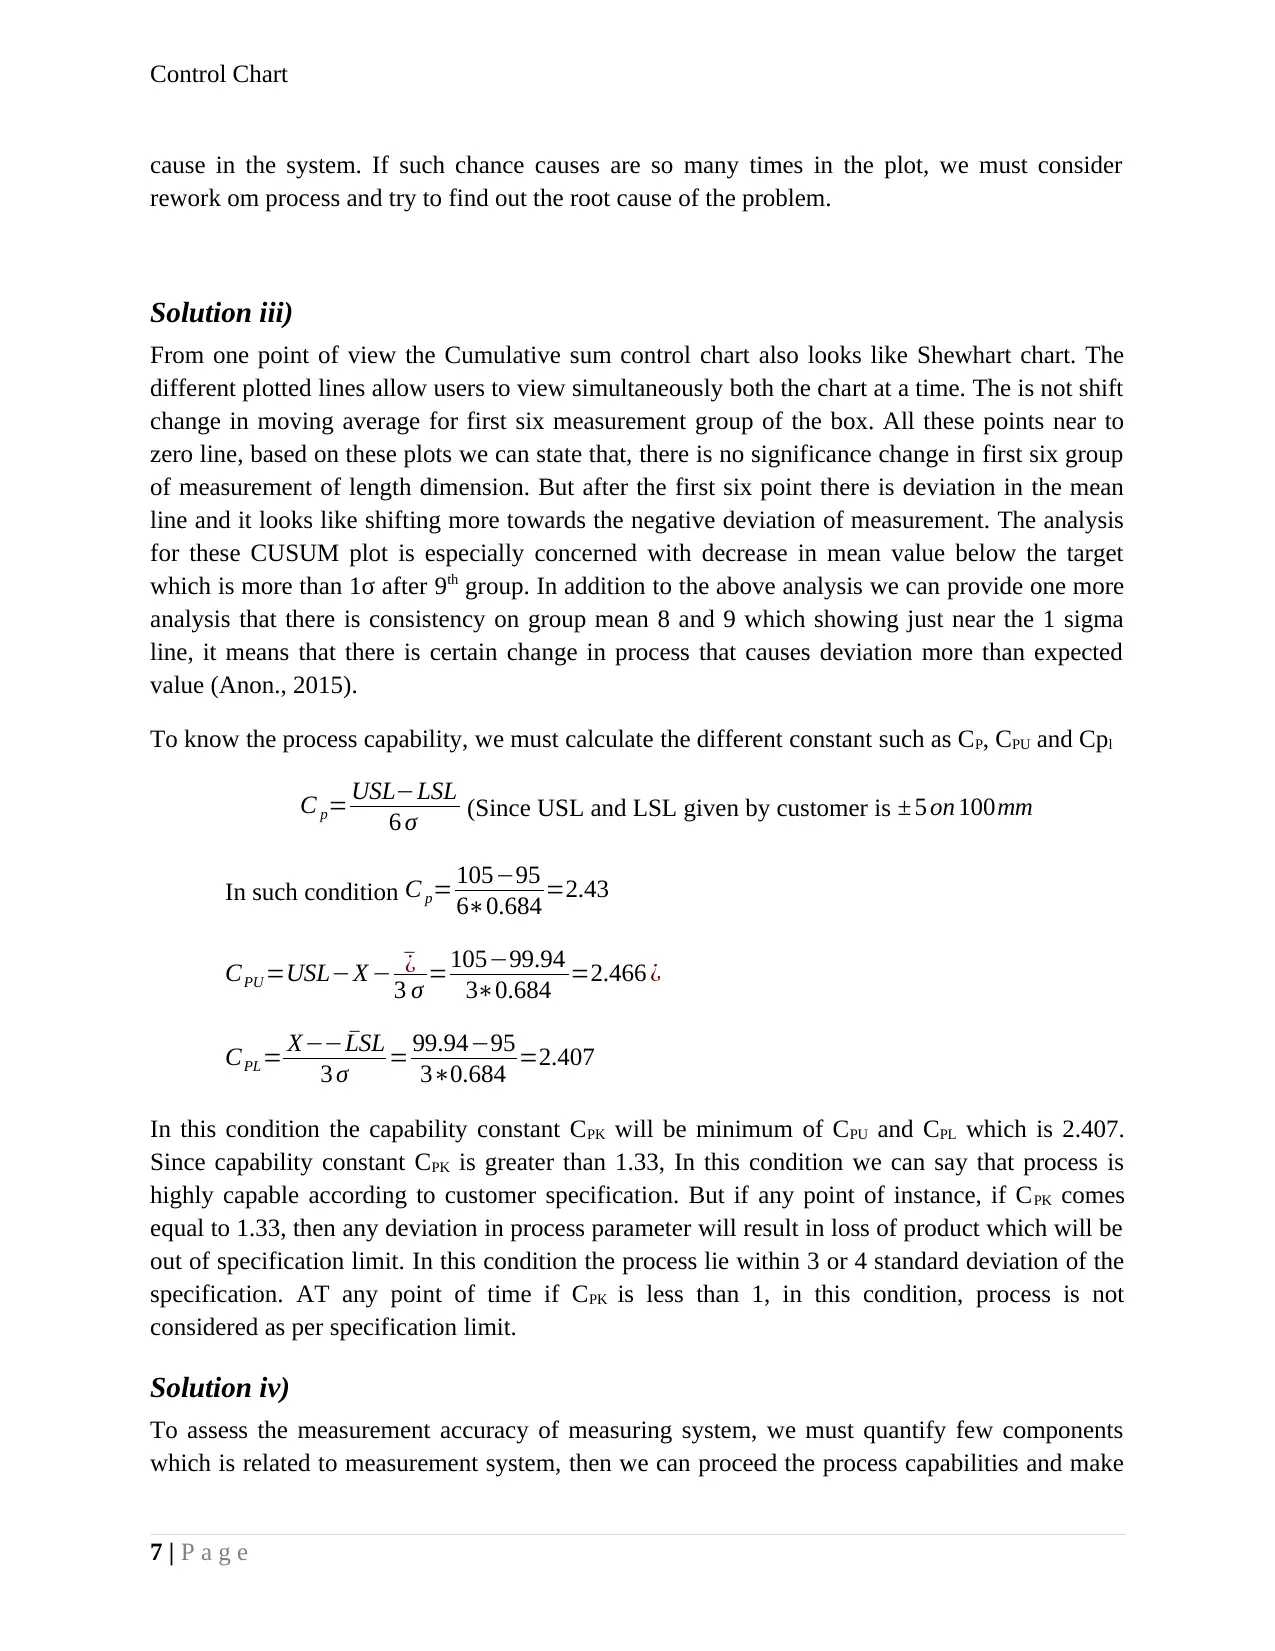
Solution iii)
From one point of view the Cumulative sum control chart also looks like Shewhart chart. The
different plotted lines allow users to view simultaneously both the chart at a time. The is not shift
change in moving average for first six measurement group of the box. All these points near to
zero line, based on these plots we can state that, there is no significance change in first six group
of measurement of length dimension. But after the first six point there is deviation in the mean
line and it looks like shifting more towards the negative deviation of measurement. The analysis
for these CUSUM plot is especially concerned with decrease in mean value below the target
which is more than 1σ after 9th group. In addition to the above analysis we can provide one more
analysis that there is consistency on group mean 8 and 9 which showing just near the 1 sigma
line, it means that there is certain change in process that causes deviation more than expected
value (Anon., 2015).
To know the process capability, we must calculate the different constant such as CP, CPU and Cpl
C p= USL−LSL
6 σ (Since USL and LSL given by customer is ± 5 on 100mm
In such condition C p= 105−95
6∗0.684 =2.43
CPU =USL−X − ¯¿
3 σ =105−99.94
3∗0.684 =2.466 ¿
CPL= X− ¯−LSL
3 σ = 99.94−95
3∗0.684 =2.407
In this condition the capability constant CPK will be minimum of CPU and CPL which is 2.407.
Since capability constant CPK is greater than 1.33, In this condition we can say that process is
highly capable according to customer specification. But if any point of instance, if CPK comes
equal to 1.33, then any deviation in process parameter will result in loss of product which will be
out of specification limit. In this condition the process lie within 3 or 4 standard deviation of the
specification. AT any point of time if CPK is less than 1, in this condition, process is not
considered as per specification limit.
Solution iv)
To assess the measurement accuracy of measuring system, we must quantify few components
which is related to measurement system, then we can proceed the process capabilities and make
7 | P a g e
cause in the system. If such chance causes are so many times in the plot, we must consider
rework om process and try to find out the root cause of the problem.
Solution iii)
From one point of view the Cumulative sum control chart also looks like Shewhart chart. The
different plotted lines allow users to view simultaneously both the chart at a time. The is not shift
change in moving average for first six measurement group of the box. All these points near to
zero line, based on these plots we can state that, there is no significance change in first six group
of measurement of length dimension. But after the first six point there is deviation in the mean
line and it looks like shifting more towards the negative deviation of measurement. The analysis
for these CUSUM plot is especially concerned with decrease in mean value below the target
which is more than 1σ after 9th group. In addition to the above analysis we can provide one more
analysis that there is consistency on group mean 8 and 9 which showing just near the 1 sigma
line, it means that there is certain change in process that causes deviation more than expected
value (Anon., 2015).
To know the process capability, we must calculate the different constant such as CP, CPU and Cpl
C p= USL−LSL
6 σ (Since USL and LSL given by customer is ± 5 on 100mm
In such condition C p= 105−95
6∗0.684 =2.43
CPU =USL−X − ¯¿
3 σ =105−99.94
3∗0.684 =2.466 ¿
CPL= X− ¯−LSL
3 σ = 99.94−95
3∗0.684 =2.407
In this condition the capability constant CPK will be minimum of CPU and CPL which is 2.407.
Since capability constant CPK is greater than 1.33, In this condition we can say that process is
highly capable according to customer specification. But if any point of instance, if CPK comes
equal to 1.33, then any deviation in process parameter will result in loss of product which will be
out of specification limit. In this condition the process lie within 3 or 4 standard deviation of the
specification. AT any point of time if CPK is less than 1, in this condition, process is not
considered as per specification limit.
Solution iv)
To assess the measurement accuracy of measuring system, we must quantify few components
which is related to measurement system, then we can proceed the process capabilities and make
7 | P a g e
Paraphrase This Document
Need a fresh take? Get an instant paraphrase of this document with our AI Paraphraser
Control Chart
decision. The first component is considered as accuracy or biasing in measuring system. For this
purpose, we must accept all the collected data, the recoding time of data should be just at the
occurrence of data is best suited for accuracy (Gasper Skulj, 2013) states that at least 5 distinct
value should be collected from measuring system. The format of the data should be as per
quantity of data. The collection of data should be as per acceptable limit of measuring tools. In
our case the, measurement was taken from 75 to 100 mm and 100 to 125 mm of micrometre. The
main thing is that linearity should be maintained as per the requirement of data collection. The
stability of the data can be checked instantly the measurement of 120 mm cannot be considered
while measure of 100 mm length. The data tolerance is provided as per specification limit and it
should be ± 5 mm (Azizi, 2015)
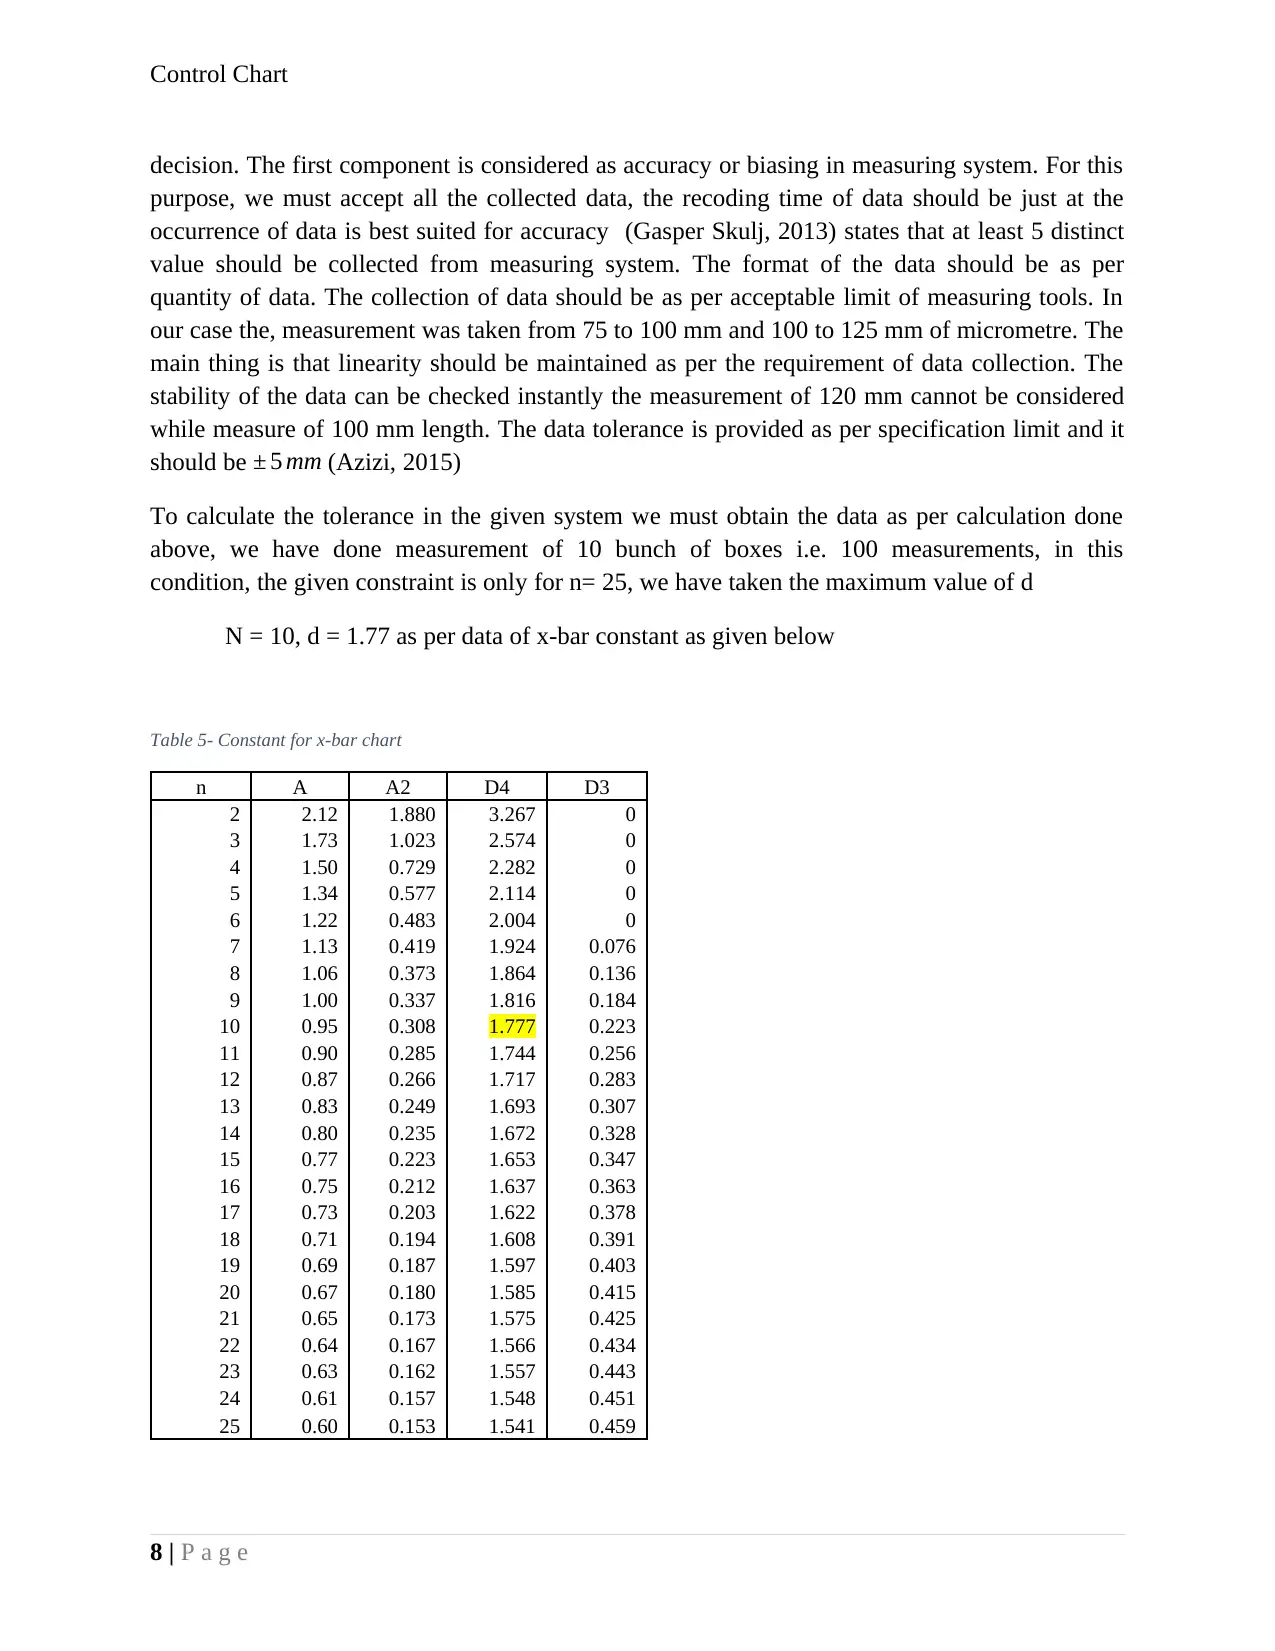
To calculate the tolerance in the given system we must obtain the data as per calculation done
above, we have done measurement of 10 bunch of boxes i.e. 100 measurements, in this
condition, the given constraint is only for n= 25, we have taken the maximum value of d
N = 10, d = 1.77 as per data of x-bar constant as given below
Table 5- Constant for x-bar chart
n A A2 D4 D3
2 2.12 1.880 3.267 0
3 1.73 1.023 2.574 0
4 1.50 0.729 2.282 0
5 1.34 0.577 2.114 0
6 1.22 0.483 2.004 0
7 1.13 0.419 1.924 0.076
8 1.06 0.373 1.864 0.136
9 1.00 0.337 1.816 0.184
10 0.95 0.308 1.777 0.223
11 0.90 0.285 1.744 0.256
12 0.87 0.266 1.717 0.283
13 0.83 0.249 1.693 0.307
14 0.80 0.235 1.672 0.328
15 0.77 0.223 1.653 0.347
16 0.75 0.212 1.637 0.363
17 0.73 0.203 1.622 0.378
18 0.71 0.194 1.608 0.391
19 0.69 0.187 1.597 0.403
20 0.67 0.180 1.585 0.415
21 0.65 0.173 1.575 0.425
22 0.64 0.167 1.566 0.434
23 0.63 0.162 1.557 0.443
24 0.61 0.157 1.548 0.451
25 0.60 0.153 1.541 0.459
8 | P a g e
decision. The first component is considered as accuracy or biasing in measuring system. For this
purpose, we must accept all the collected data, the recoding time of data should be just at the
occurrence of data is best suited for accuracy (Gasper Skulj, 2013) states that at least 5 distinct
value should be collected from measuring system. The format of the data should be as per
quantity of data. The collection of data should be as per acceptable limit of measuring tools. In
our case the, measurement was taken from 75 to 100 mm and 100 to 125 mm of micrometre. The
main thing is that linearity should be maintained as per the requirement of data collection. The
stability of the data can be checked instantly the measurement of 120 mm cannot be considered
while measure of 100 mm length. The data tolerance is provided as per specification limit and it
should be ± 5 mm (Azizi, 2015)
To calculate the tolerance in the given system we must obtain the data as per calculation done
above, we have done measurement of 10 bunch of boxes i.e. 100 measurements, in this
condition, the given constraint is only for n= 25, we have taken the maximum value of d
N = 10, d = 1.77 as per data of x-bar constant as given below
Table 5- Constant for x-bar chart
n A A2 D4 D3
2 2.12 1.880 3.267 0
3 1.73 1.023 2.574 0
4 1.50 0.729 2.282 0
5 1.34 0.577 2.114 0
6 1.22 0.483 2.004 0
7 1.13 0.419 1.924 0.076
8 1.06 0.373 1.864 0.136
9 1.00 0.337 1.816 0.184
10 0.95 0.308 1.777 0.223
11 0.90 0.285 1.744 0.256
12 0.87 0.266 1.717 0.283
13 0.83 0.249 1.693 0.307
14 0.80 0.235 1.672 0.328
15 0.77 0.223 1.653 0.347
16 0.75 0.212 1.637 0.363
17 0.73 0.203 1.622 0.378
18 0.71 0.194 1.608 0.391
19 0.69 0.187 1.597 0.403
20 0.67 0.180 1.585 0.415
21 0.65 0.173 1.575 0.425
22 0.64 0.167 1.566 0.434
23 0.63 0.162 1.557 0.443
24 0.61 0.157 1.548 0.451
25 0.60 0.153 1.541 0.459
8 | P a g e
Control Chart
The average of range bar is = 31.481 / 100 = 0.3148
The measurement error can be calculated by ¿ 5.15 x R
d
Putting the values in above equation ¿ 5.15 x 0.3148
1.77 =0.916
We must convert this measurement tolerance by dividing it with process tolerance which is 10
mm in this case.
Measurement error = 0.916 x 100
10 = 9.16%. The measurement error is also within
the 10 % range; therefore, the process is acceptable as error is concerned (Knowles, 2010).
PART-B
Solution I)
It is a well-known fact that, when quality of product is high, there will be reduction in scrap, and
re-machining as well as market share will be high. But to achieve this scenario, we must meet
with some definite requirement. The quality policy for that organisation should be clear and
given as paramount importance. To achieve the quality of end-product, we must apply and
inspect the quality at every stage of manufacturing. On the other hand, we must apply statistical
process control at each stage of manufacturing. Measure the system product at each stage, apply
control chart, know the variation by Shewhart control chart, know the mean shift by CUSUM
chart, asses the capability constant and reprocess the system as by finding the root cause at each
stage. If the process is statistically under control, the process can continue and there no need for
change in the process. But ideal situation does not remain for long period of time, variation
occurs, therefore we must find the assignable cause from the system and remove it. The process
of statistical control is applicable at every stage of manufacturing and servicing in industries.
There is subtle difference in statistical control in manufacturing and servicing, but it contains all
most same objective. The process needs to be control before we assess for capability constant. If
process is not controlled before assessing process capability, then we can get incorrect estimates
of our capability (Jianxin Roger Jiao, 2006).
If we want to purchase a new machine for the above discussed process, the purchase order of this
machine should consist of its result of various test done by manufacturer related to its capability
run. This requirement is on and above of other requirement given on purchase order of the
9 | P a g e
⊘ This is a preview!⊘
Do you want full access?
Subscribe today to unlock all pages.
Trusted by 1+ million students worldwide
Control Chart
machine. The other requirement may include machine acceptance process, it parts availability,
too change capability, surface roughness, power consumption, its cost, installation and training
procedure and costs, hardness, its troubleshooting etc, but we must describe its capability run in
details which is as follows.
The warming up condition of the machine should be at steady state operating condition; these
conditions should be as per pre-condition documentation during the run. To achieve the
capability run, the machine should be set to its specified operating parameter condition. Each
parts and process in this machine should be identifiable clearly and each sequence of its
operation should be mentioned clearly. There should be continuous run for the machine during
capability test. It should withstand the interruption, can be able to restart after stopping the
machine. The problem found in the interruption may be stated and clearly mentioned in the
purchase order. As in todays scenario each machine is a combination of modular component, the
basic features of this modular component are that it can run and be tested individually as well as
run and be tested after integration. The acceptance of quality should base on following criteria,
the first one should be Characteristics of product quality, the second one should be
characteristics of control plan and third one should be characteristics of standard products. All
these characteristics must be checked before the delivery and result should be mentioned
(Manzini, 2015).
Conclusion
As per the above analysis and discussion based on measurement of bearing boxes in a
manufacturing firm, the length measurement of hundred boxes is being carried out with the help
of micrometre. The after calculation of R-bar and X-bar in excel, the Shewhart and cumulative
sum control chart were prepared based on guiltiness given in different journals and articles. The
control charts depict that there is only one deviation from lower control limits in the process. In
the CUSUM control chart the same thing is depicted through deviation in mean of the process.
One deviation can be caused due to so many factor, whether the measuring taken as wrong or
there is some power fluctuation during the manufacturing of boxes. It may be anything from
several causes in manufacturing process. It is better to omits this measurement so that we will get
continuous and stable process control in the next measurement. If some chances causes are
coming again in the future then we must analyse it by finding root cause, till the time we should
stick to this process, because it is providing within the specified limit of tolerance (Ignatio
Madanhire, 2016).
Further we have calculated capability constant, and it was found that process value if around 2.4
which quite greater than continuous specification value 1.33. this also depicts the same thing that
the process is within the specified limit of tolerance. If anytime process is coming equal to or
below the specified limit of 1.33, then we must reconsider the process change. The tolerance
10 | P a g e
Paraphrase This Document
Need a fresh take? Get an instant paraphrase of this document with our AI Paraphraser
Control Chart
limits are also calculated for above described process and the result was found around 9.1%,
which is lower that acceptance limit of 10%. In this criterion, where each of the calculation show
that the process is stable, and we must stick with this process (Sérgio Sousa, 2017).
The purchase order requirement of new machine from the process control point of view is clearly
described in the second part of this assignment. This show clear details of use of statistical
control in a manufacturing process.
References
Anna Šatanová, L, F, M, S, 2015, Optimization of Production Process through Selected
Statistical Methods, Procedia Economics and Finance, 23(1), pp, 1-5,
Anon, 2015, Cumulative Sum (CUSUM) Charts, Cumulative Sum (CUSUM) Control Charts,
1(1), pp, 1-20,
Anon, 2016, Process capability improvement by putting statistical control into practice,
Mechanical Engineering Journal, 1(1), pp, 1-6,
Artiles-Leon, N, 2010, The statistical optimal design of Shewhart control charts with
supplementary stopping rules, 1 ed, Iowa: Iowa state university,
Azizi, A, 2015, Evaluation Improvement of Production Productivity Performance using
Statistical Process Control, Overall Equipment Efficiency, and Autonomous Maintenance,
Manufacturing Engineering Conference, 1(1), pp, 1-5,
Christopher Wild, G, S, 2010, Chance Encounters: A First Course in Data Analysis and
Inference, 2nd ed, New York: WIley Publishers,
Gasper Skulj, R, V, P, B, 2013, Statistical Process Control as a Service: An Industrial Case
Study, Conference on Manufacturing Systems, 7(1), pp, 1-6,
Gejdoša, P, 2015, Continuous Quality Improvement by Statistical Process Control, Business
Economics and Management 2015 Conference, 34(1), pp, 1-8,
Hart, M, K, 2007, Introduction to Stattistical Process Control techniques, 1 ed, Oregon: Statit
Software,
11 | P a g e
Control Chart
Ignatio Madanhire, C, M, 2016, Application of Statistical Process Control (SPC) in
Manufacturing Industry in a Developing Country, 13th Global Conference on Sustainable
Manufacturing, 40(1), pp, 1-4,
Jianxin Roger Jiao, P, T, H, 2006, Optimization design of a CUSUM control chart based on
taguchi’s loss function, Logistics Research Group, 1(1), pp, 1-10,
Knowles, G, 2010, Building and Using Control Charts, 1 ed, london: Warwick publisher,
Ľubica Simanová, P, G, 2015, The Use of Statistical Quality Control Tools to Quality Improving
in the Furniture Business, Procedia Economics and Finance, 34(1), pp, 1-8,
Manzini, R, 2015, QualityManagement Systems and Statistical Quality Control, 1 ed, London:
Springer,
Molly Franke, G, J, W, M, 2017, Comparison of two control groups for estimation of oral
cholera vaccine estimation of oral cholera vaccine, Department of Global Health and Social
Medicine, 35(1), pp, 1-9,
Oladipupo Olaitan, Q, Y, E, A, 2017, Work In Process Control for a High Product Mix
Manufacturing System, Procedia CIRP, 1(1), pp, 1-6,
P Stavropoulos, D, C, P, 2013, Monitoring and control of manufacturing processes: A review,
CIRP Conference on Modeling of Machining Operations, 1(1), pp, 1-5,
S Bangphan, P, B, T, B, 2014, Process Capability Analysis by Using Statistical Process Control
of Rice Polished Cylinder Turning Practice, World Academy of Science, 1(1), pp, 1-7,
Sérgio Sousa, N, R, 2017, Application of SPC and quality tools for process improvement,
Procedia Manufacturing, 11(1), pp, 1-8,
Spano, A, 2012, Process Capability Analysis, Process Capability Analysis, 1(1), pp, 1-34,
12 | P a g e
⊘ This is a preview!⊘
Do you want full access?
Subscribe today to unlock all pages.
Trusted by 1+ million students worldwide
1 out of 12
Related Documents


Your All-in-One AI-Powered Toolkit for Academic Success.
+13062052269
info@desklib.com
Available 24*7 on WhatsApp / Email
![[object Object]](/_next/static/media/star-bottom.7253800d.svg)
Unlock your academic potential
Copyright © 2020–2025 A2Z Services. All Rights Reserved. Developed and managed by ZUCOL.